
GEOG 135 Economic Geography Professor Dr JeanPaul Rodrigue
- Slides: 59
GEOG 135 – Economic Geography Professor: Dr. Jean-Paul Rodrigue Topic 3 – Population and Labor A – Population Distribution and Structure B – Demographic Theory C – Migration Hofstra University, Department Global Studies & Geography Hofstra Department of of Global Studies & Geography Hofstra. University, Department of Global Studies & Geography
Objectives ■ Look at the distribution of the world’s population ■ Look at the causes and consequences of population change ■ Understand economic demographic perspectives ■ Understand the demographic transition theory ■ Look at the economic factors of migration © Dr. Jean-Paul Rodrigue
A – POPULATION DISTRIBUTION AND STRUCTURE 1. Global Population Distribution 2. Fertility and Mortality 3. Population Structure © Dr. Jean-Paul Rodrigue
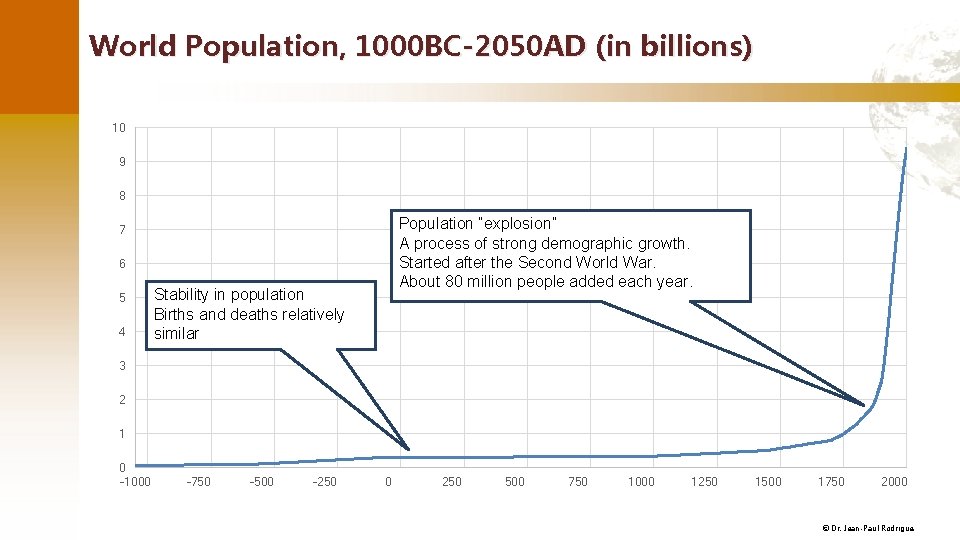
World Population, 1000 BC-2050 AD (in billions) 10 9 8 Population “explosion” A process of strong demographic growth. Started after the Second World War. About 80 million people added each year. 7 6 5 4 Stability in population Births and deaths relatively similar 3 2 1 0 -1000 -750 -500 -250 0 250 500 750 1000 1250 1500 1750 2000 © Dr. Jean-Paul Rodrigue
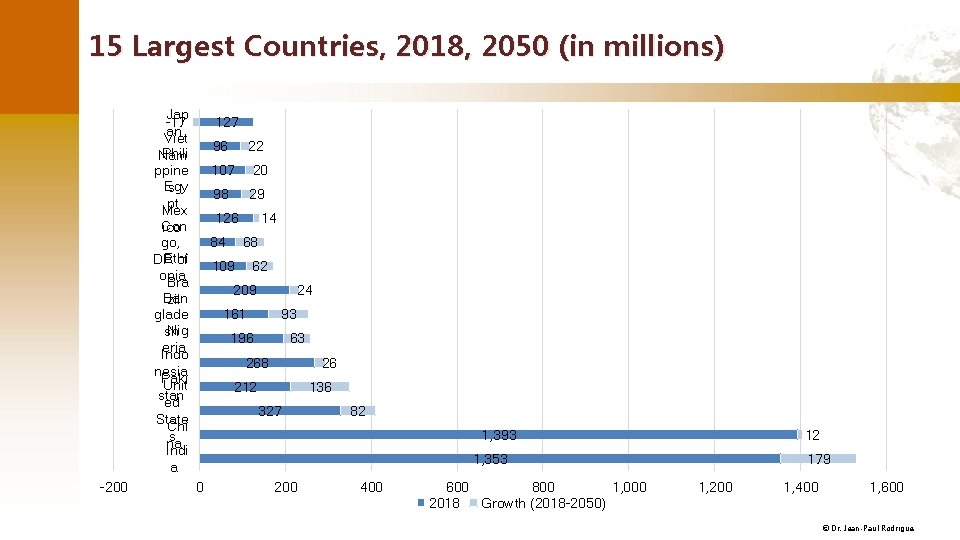
15 Largest Countries, 2018, 2050 (in millions) Jap -17 an Viet Phili Nam ppine Egy s pt Mex Con ico go, Ethi DR of opia Bra Ban zil glade Nig sh eria Indo nesia Paki Unit stan ed State Chi s na Indi a -200 127 96 22 107 20 98 29 126 84 14 68 109 62 209 24 161 93 196 63 268 26 212 136 327 82 1, 393 12 1, 353 0 200 400 600 800 1, 000 2018 Growth (2018 -2050) 179 1, 200 1, 400 1, 600 © Dr. Jean-Paul Rodrigue
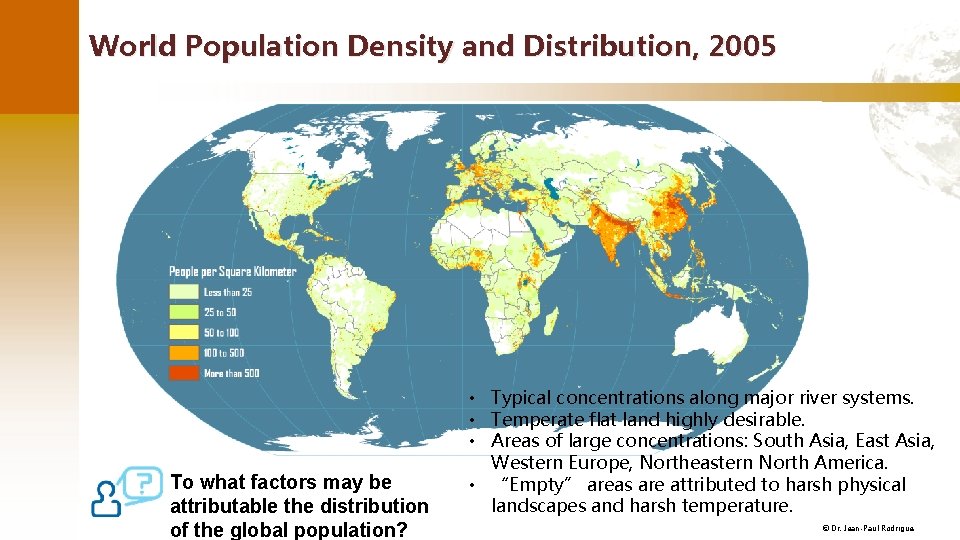
World Population Density and Distribution, 2005 To what factors may be attributable the distribution of the global population? • Typical concentrations along major river systems. • Temperate flat land highly desirable. • Areas of large concentrations: South Asia, East Asia, Western Europe, Northeastern North America. • “Empty” areas are attributed to harsh physical landscapes and harsh temperature. © Dr. Jean-Paul Rodrigue
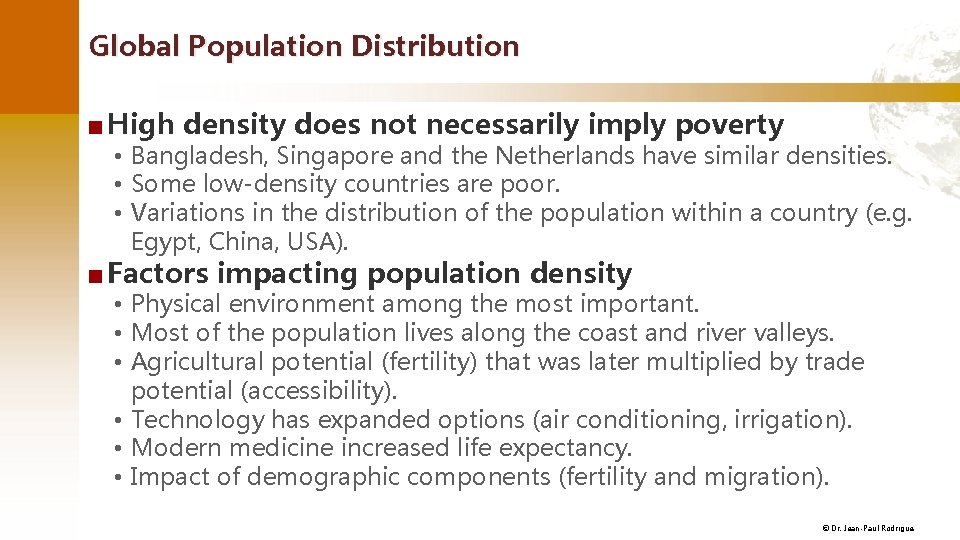
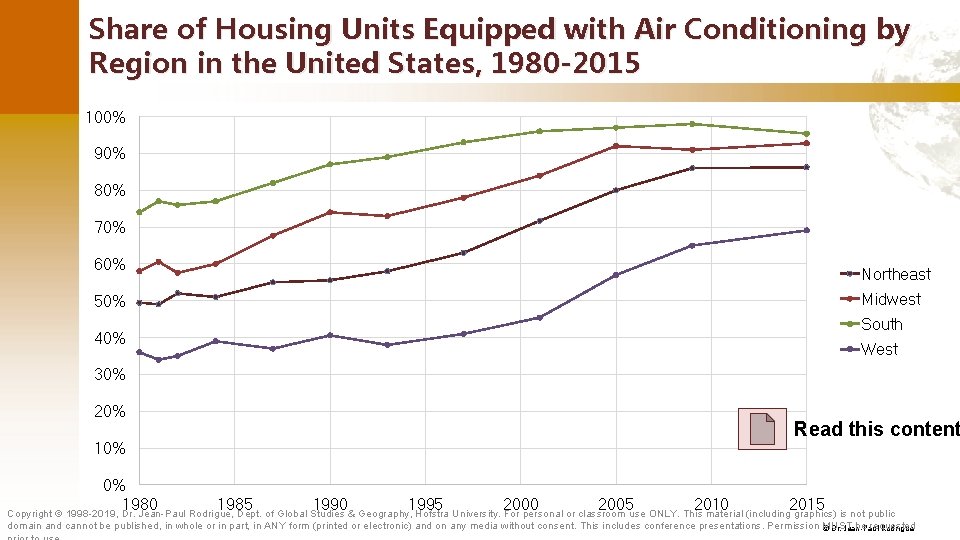
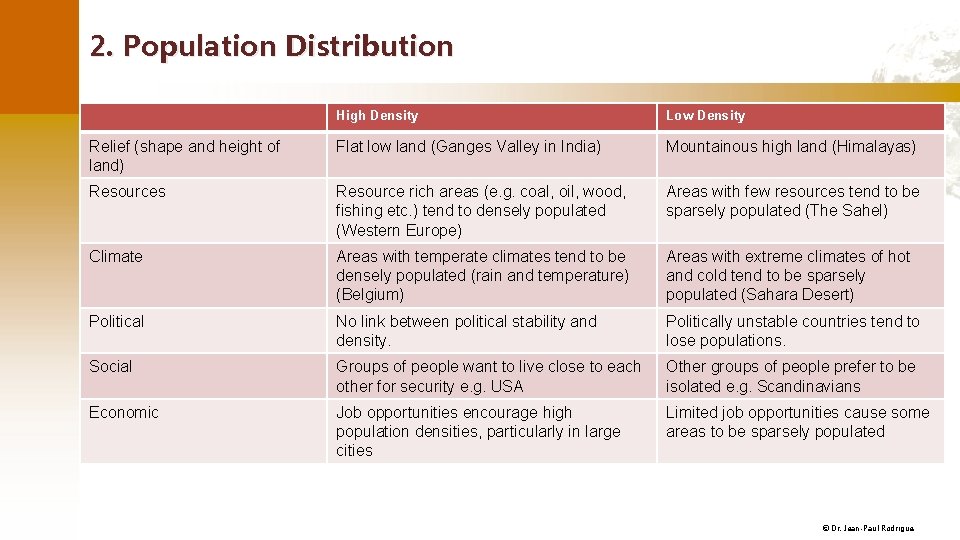
Global Population Distribution ■ High density does not necessarily imply poverty • Bangladesh, Singapore and the Netherlands have similar densities. • Some low-density countries are poor. • Variations in the distribution of the population within a country (e. g. Egypt, China, USA). ■ Factors impacting population density • Physical environment among the most important. • Most of the population lives along the coast and river valleys. • Agricultural potential (fertility) that was later multiplied by trade potential (accessibility). • Technology has expanded options (air conditioning, irrigation). • Modern medicine increased life expectancy. • Impact of demographic components (fertility and migration). © Dr. Jean-Paul Rodrigue
Share of Housing Units Equipped with Air Conditioning by Region in the United States, 1980 -2015 100% 90% 80% 70% 60% 50% 40% Northeast Midwest South West 30% 20% 10% Read this content 0% 1980 1985 1990 1995 2000 2005 2010 2015 Copyright © 1998 -2019, Dr. Jean-Paul Rodrigue, Dept. of Global Studies & Geography, Hofstra University. For personal or classroom use ONLY. This material (including graphics) is not public domain and cannot be published, in whole or in part, in ANY form (printed or electronic) and on any media without consent. This includes conference presentations. Permission MUST be requested © Dr. Jean-Paul Rodrigue
2. Population Distribution High Density Low Density Relief (shape and height of land) Flat low land (Ganges Valley in India) Mountainous high land (Himalayas) Resources Resource rich areas (e. g. coal, oil, wood, fishing etc. ) tend to densely populated (Western Europe) Areas with few resources tend to be sparsely populated (The Sahel) Climate Areas with temperate climates tend to be densely populated (rain and temperature) (Belgium) Areas with extreme climates of hot and cold tend to be sparsely populated (Sahara Desert) Political No link between political stability and density. Politically unstable countries tend to lose populations. Social Groups of people want to live close to each other for security e. g. USA Other groups of people prefer to be isolated e. g. Scandinavians Economic Job opportunities encourage high population densities, particularly in large cities Limited job opportunities cause some areas to be sparsely populated © Dr. Jean-Paul Rodrigue
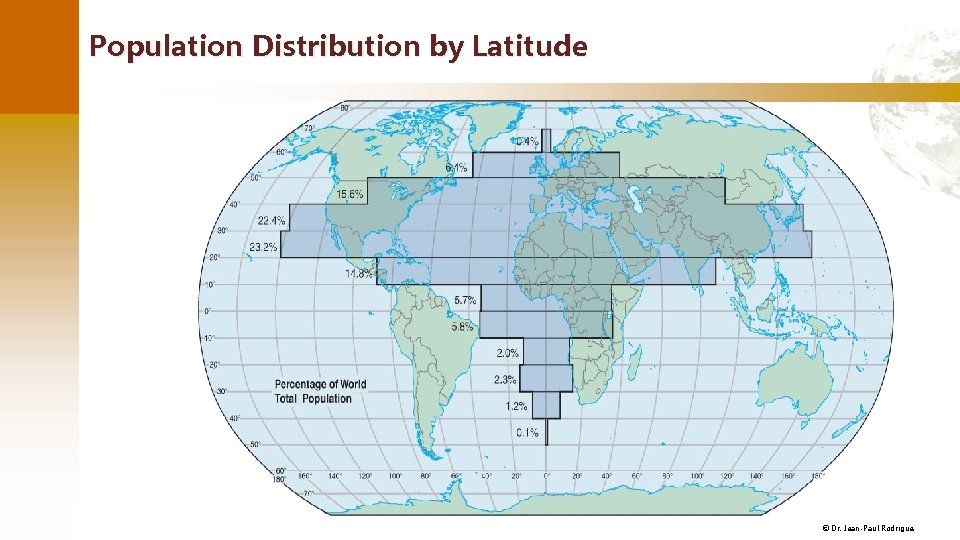
Population Distribution by Latitude © Dr. Jean-Paul Rodrigue
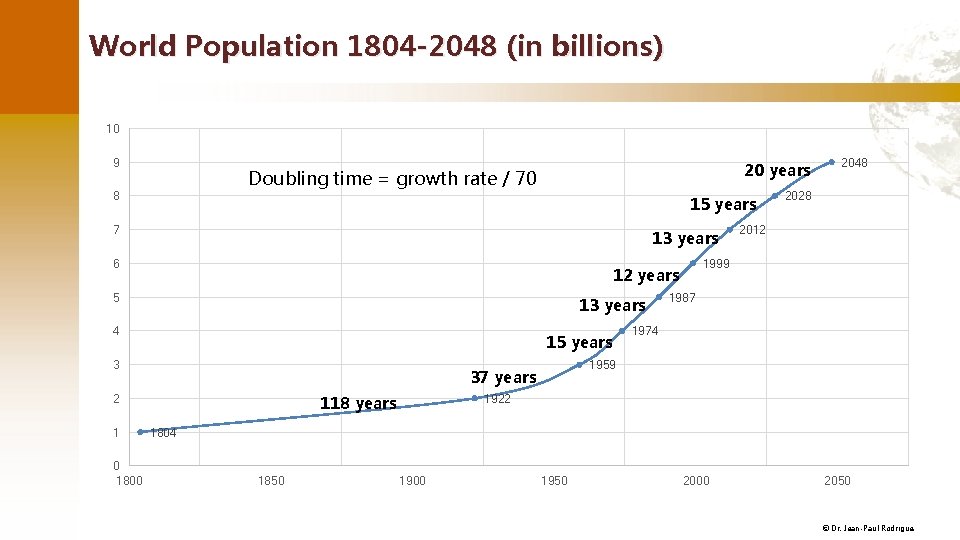
World Population 1804 -2048 (in billions) 10 9 20 years Doubling time = growth rate / 70 8 15 years 7 13 years 6 13 years 4 15 years 3 1 0 1800 2012 1987 1974 1959 37 years 2 2028 1999 12 years 5 2048 1922 118 years 1804 1850 1900 1950 2000 2050 © Dr. Jean-Paul Rodrigue
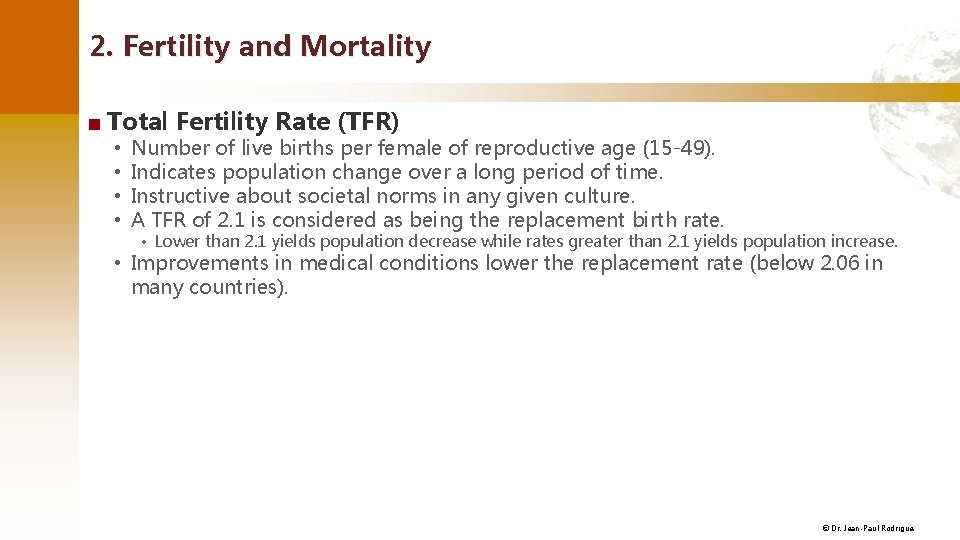
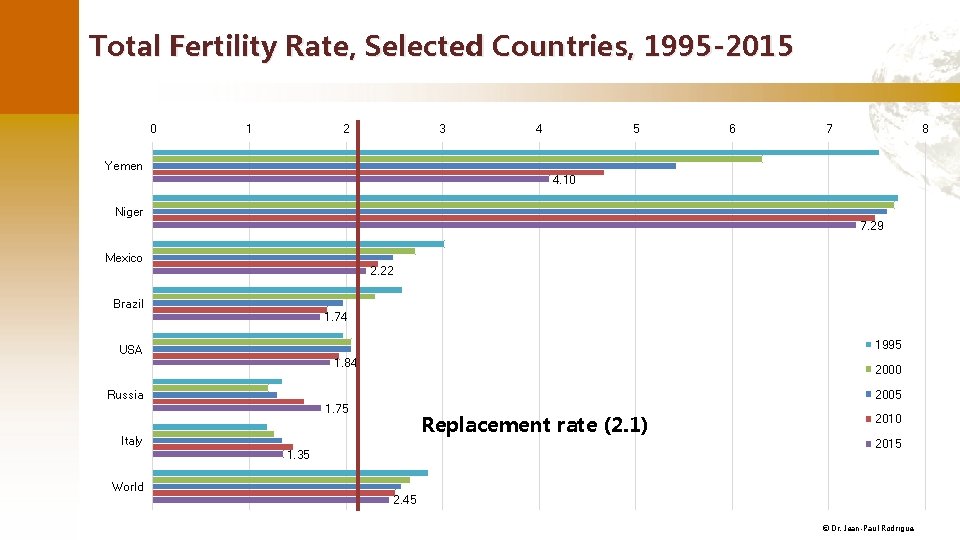
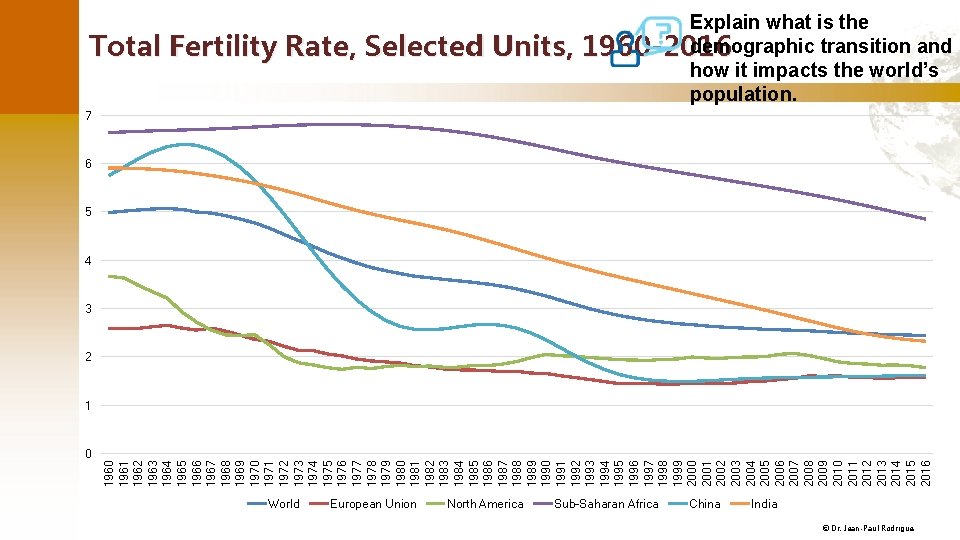
2. Fertility and Mortality ■ Total Fertility Rate (TFR) • • Number of live births per female of reproductive age (15 -49). Indicates population change over a long period of time. Instructive about societal norms in any given culture. A TFR of 2. 1 is considered as being the replacement birth rate. • Lower than 2. 1 yields population decrease while rates greater than 2. 1 yields population increase. • Improvements in medical conditions lower the replacement rate (below 2. 06 in many countries). © Dr. Jean-Paul Rodrigue
World Total Fertility Rate, 2010 © Dr. Jean-Paul Rodrigue
Total Fertility Rate, Selected Countries, 1995 -2015 0 1 2 3 Yemen 4 5 8 7. 29 Mexico 2. 22 Brazil 1. 74 1995 USA 1. 84 2000 2005 Russia World 7 4. 10 Niger Italy 6 1. 75 Replacement rate (2. 1) 2010 2015 1. 35 2. 45 © Dr. Jean-Paul Rodrigue
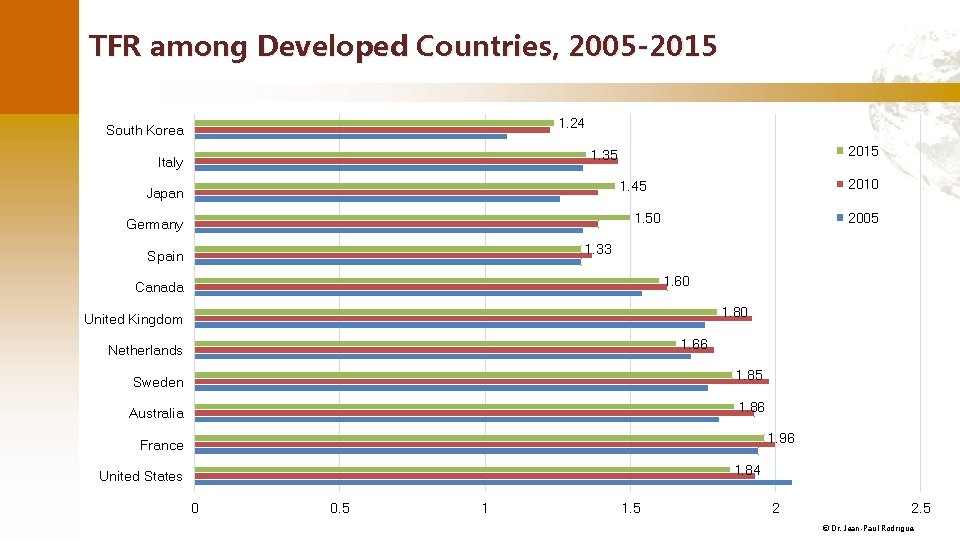
TFR among Developed Countries, 2005 -2015 1. 24 South Korea 2015 1. 35 Italy 2010 1. 45 Japan 2005 1. 50 Germany 1. 33 Spain 1. 60 Canada 1. 80 United Kingdom 1. 66 Netherlands Sweden 1. 85 Australia 1. 86 1. 96 France 1. 84 United States 0 0. 5 1 1. 5 2 2. 5 © Dr. Jean-Paul Rodrigue
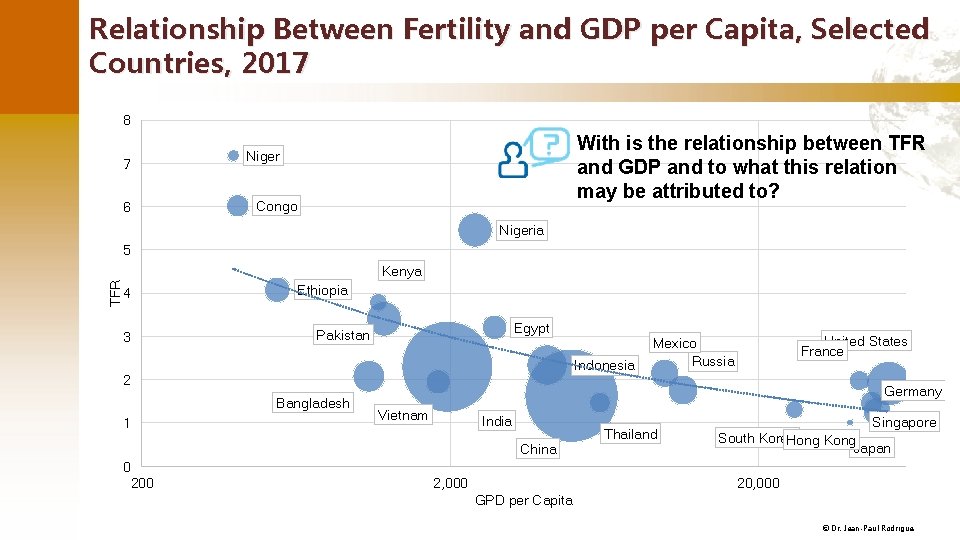
Relationship Between Fertility and GDP per Capita, Selected Countries, 2017 8 7 6 With is the relationship between TFR and GDP and to what this relation may be attributed to? Niger Congo Nigeria 5 TFR Kenya 4 3 Ethiopia Egypt Pakistan Indonesia 2 Bangladesh 1 Germany Vietnam India China 0 200 United States France Mexico Russia 2, 000 Thailand Singapore South Korea Hong Kong Japan 20, 000 GPD per Capita © Dr. Jean-Paul Rodrigue
2. Fertility and Mortality ■ Causes of death • Throughout most of history famine, epidemics, and wars have been the leading causes of death. • Primary causes of death began to shift to degenerative problems related to aging. • These include such factors as heart disease and cancer. ■ Death and welfare • Used to be considered a sign of the health of a population. • Different age structures among the populations of different countries. • Possible for a nation with high living standards to have a higher death rate than a poorer nation. • Reason: overall older population. © Dr. Jean-Paul Rodrigue
World Crude Death Rate, 2010 © Dr. Jean-Paul Rodrigue
2. Fertility and Mortality ■ Life expectancy • • Number of years a person is expected to live. Based on current death rates. Does not necessarily apply to current generation. May change due to ameliorations in standards of living. • • Strong geographical variations in life expectancy. Half a century ago, most people died before the age of 50. Global average life expectancy reached 72 years in 2017. Several achievements and failures: ■ Context • Economic development has benefited human health. • Improvement in diet and sanitation. • Urbanization may have adverse effects. © Dr. Jean-Paul Rodrigue
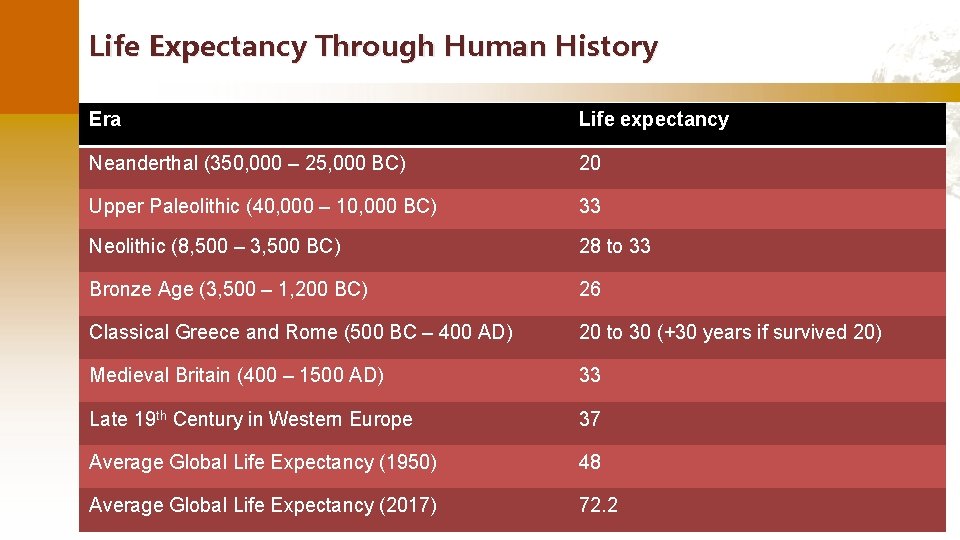
Life Expectancy Through Human History Era Life expectancy Neanderthal (350, 000 – 25, 000 BC) 20 Upper Paleolithic (40, 000 – 10, 000 BC) 33 Neolithic (8, 500 – 3, 500 BC) 28 to 33 Bronze Age (3, 500 – 1, 200 BC) 26 Classical Greece and Rome (500 BC – 400 AD) 20 to 30 (+30 years if survived 20) Medieval Britain (400 – 1500 AD) 33 Late 19 th Century in Western Europe 37 Average Global Life Expectancy (1950) 48 Average Global Life Expectancy (2017) 72. 2 © Dr. Jean-Paul Rodrigue
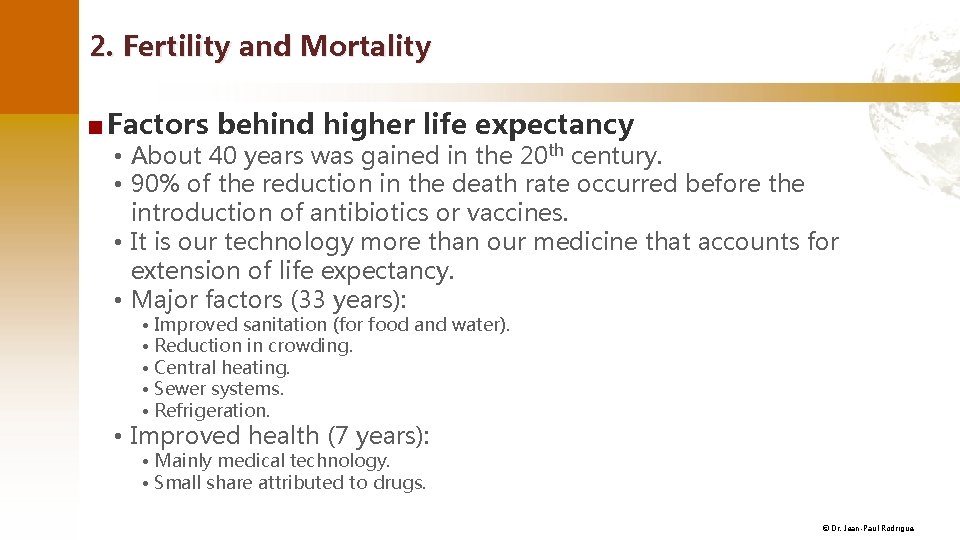
2. Fertility and Mortality ■ Factors behind higher life expectancy • About 40 years was gained in the 20 th century. • 90% of the reduction in the death rate occurred before the introduction of antibiotics or vaccines. • It is our technology more than our medicine that accounts for extension of life expectancy. • Major factors (33 years): • Improved sanitation (for food and water). • Reduction in crowding. • Central heating. • Sewer systems. • Refrigeration. • Improved health (7 years): • Mainly medical technology. • Small share attributed to drugs. © Dr. Jean-Paul Rodrigue
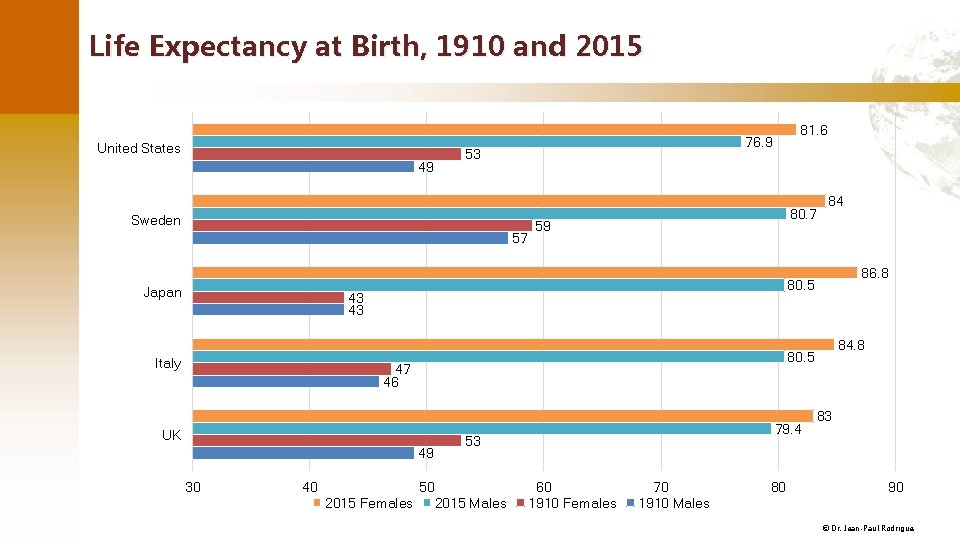
Life Expectancy at Birth, 1910 and 2015 United States 49 53 Sweden 57 Japan 81. 6 76. 9 80. 7 59 UK 49 40 2015 Females 84. 8 80. 5 47 46 30 86. 8 80. 5 43 43 Italy 84 79. 4 53 50 2015 Males 60 1910 Females 70 1910 Males 80 83 90 © Dr. Jean-Paul Rodrigue
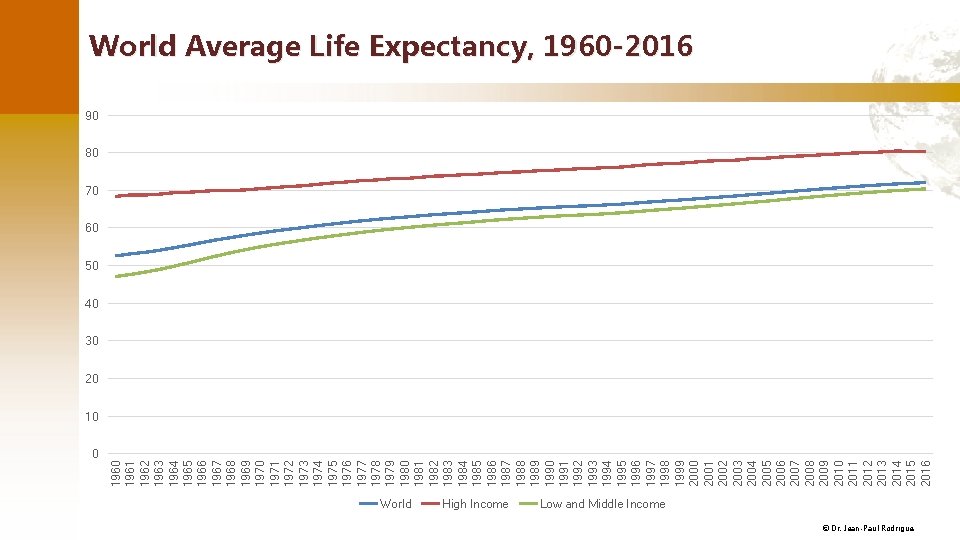
0 1961 1962 1963 1964 1965 1966 1967 1968 1969 1970 1971 1972 1973 1974 1975 1976 1977 1978 1979 1980 1981 1982 1983 1984 1985 1986 1987 1988 1989 1990 1991 1992 1993 1994 1995 1996 1997 1998 1999 2000 2001 2002 2003 2004 2005 2006 2007 2008 2009 2010 2011 2012 2013 2014 2015 2016 World Average Life Expectancy, 1960 -2016 90 80 70 60 50 40 30 20 10 World High Income Low and Middle Income © Dr. Jean-Paul Rodrigue
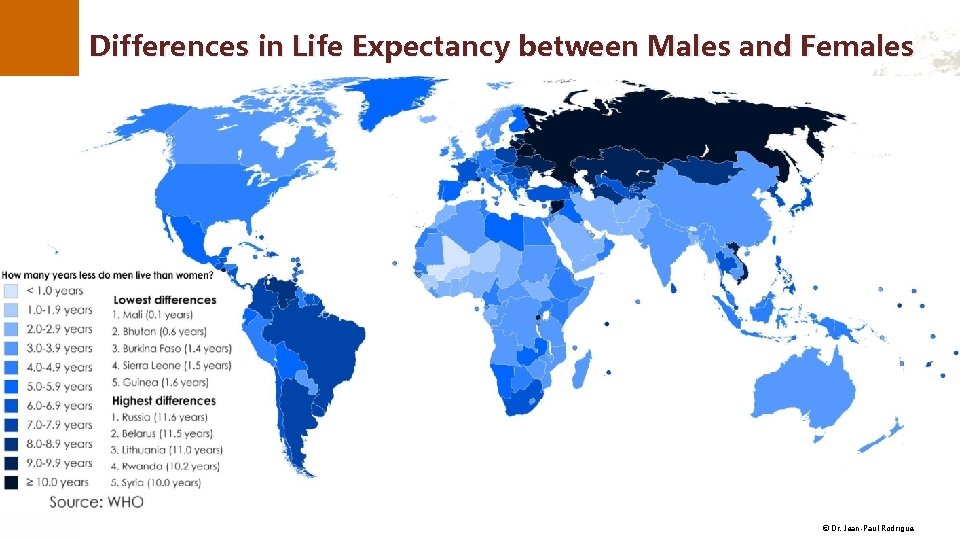
Differences in Life Expectancy between Males and Females © Dr. Jean-Paul Rodrigue
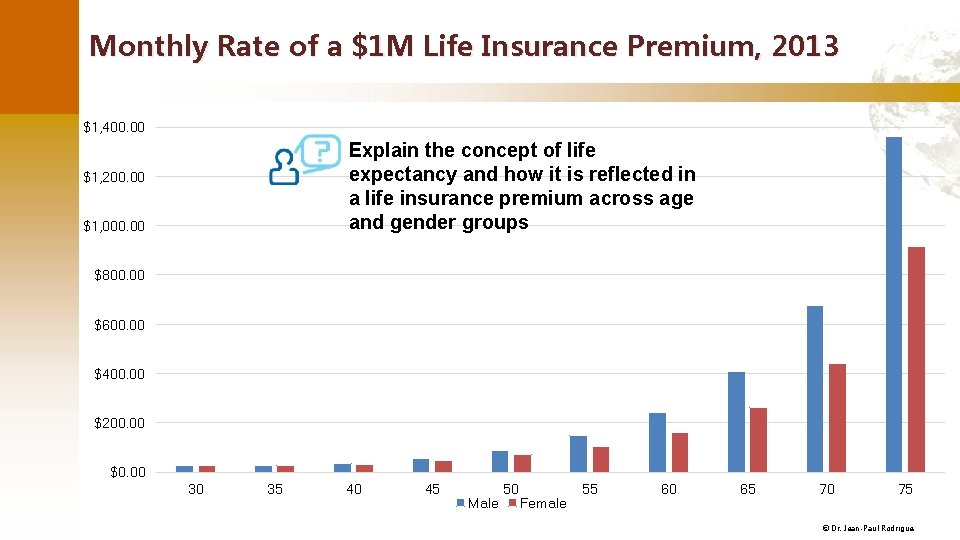
Monthly Rate of a $1 M Life Insurance Premium, 2013 $1, 400. 00 Explain the concept of life expectancy and how it is reflected in a life insurance premium across age and gender groups $1, 200. 00 $1, 000. 00 $800. 00 $600. 00 $400. 00 $200. 00 $0. 00 30 35 40 45 Male 50 Female 55 60 65 70 75 © Dr. Jean-Paul Rodrigue
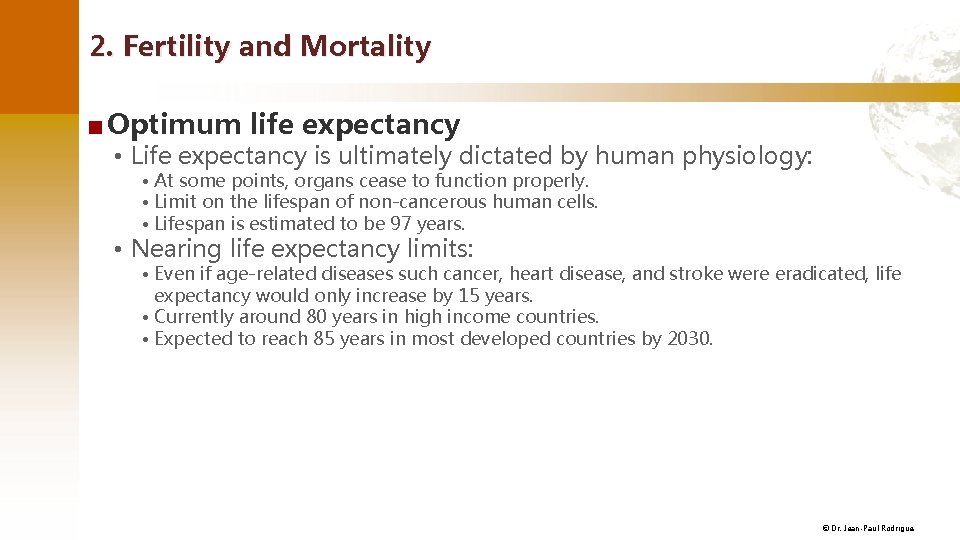
2. Fertility and Mortality ■ Optimum life expectancy • Life expectancy is ultimately dictated by human physiology: • At some points, organs cease to function properly. • Limit on the lifespan of non-cancerous human cells. • Lifespan is estimated to be 97 years. • Nearing life expectancy limits: • Even if age-related diseases such cancer, heart disease, and stroke were eradicated, life expectancy would only increase by 15 years. • Currently around 80 years in high income countries. • Expected to reach 85 years in most developed countries by 2030. © Dr. Jean-Paul Rodrigue
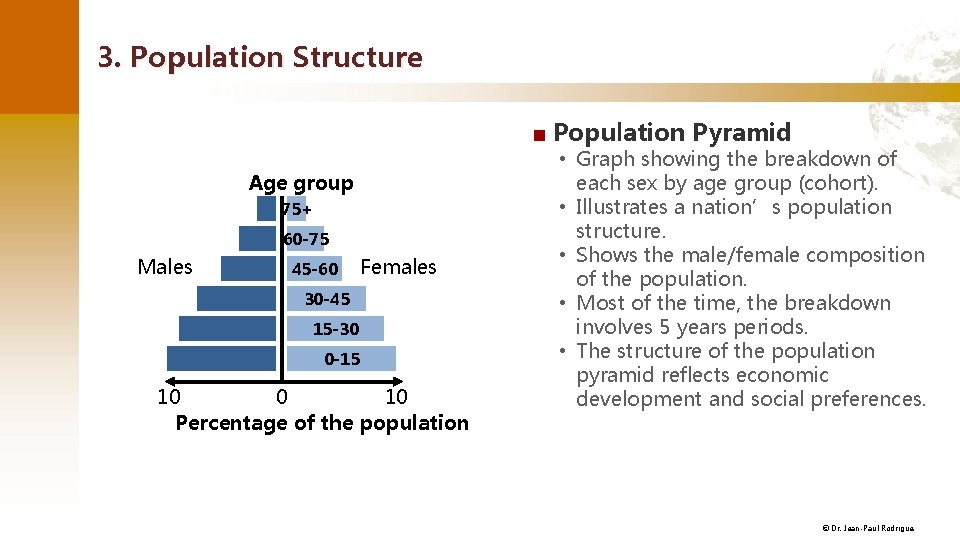
3. Population Structure ■ Population Pyramid Age group 75+ 60 -75 Males 45 -60 Females 30 -45 15 -30 0 -15 10 0 10 Percentage of the population • Graph showing the breakdown of each sex by age group (cohort). • Illustrates a nation’s population structure. • Shows the male/female composition of the population. • Most of the time, the breakdown involves 5 years periods. • The structure of the population pyramid reflects economic development and social preferences. © Dr. Jean-Paul Rodrigue
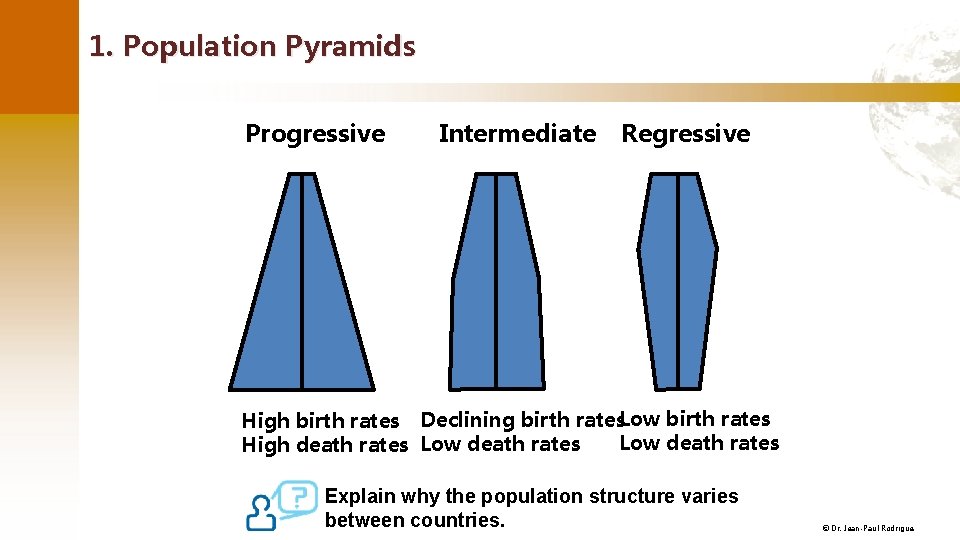
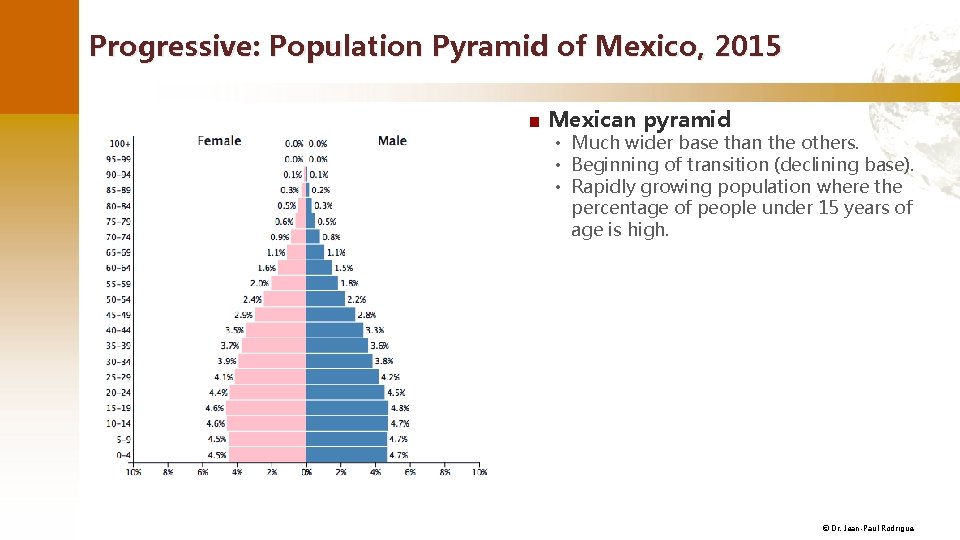
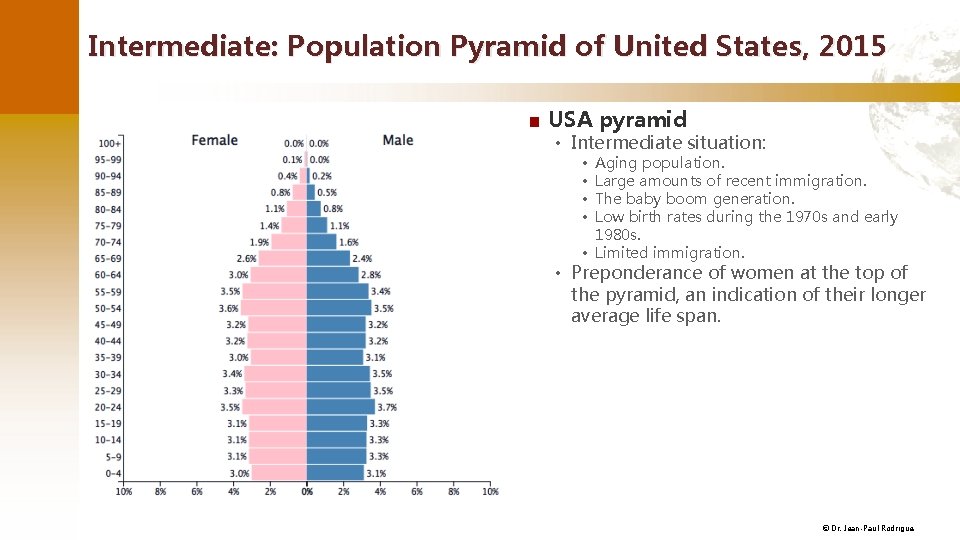
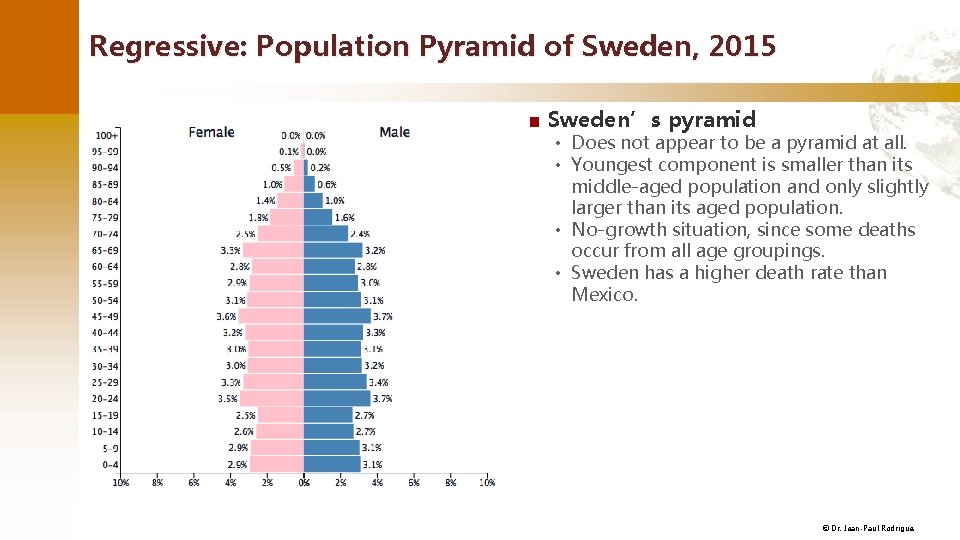
1. Population Pyramids Progressive Intermediate Regressive High birth rates Declining birth rates. Low birth rates Low death rates High death rates Low death rates Explain why the population structure varies between countries. © Dr. Jean-Paul Rodrigue
Progressive: Population Pyramid of Mexico, 2015 ■ Mexican pyramid • Much wider base than the others. • Beginning of transition (declining base). • Rapidly growing population where the percentage of people under 15 years of age is high. © Dr. Jean-Paul Rodrigue
Intermediate: Population Pyramid of United States, 2015 ■ USA pyramid • Intermediate situation: • • Aging population. Large amounts of recent immigration. The baby boom generation. Low birth rates during the 1970 s and early 1980 s. • Limited immigration. • Preponderance of women at the top of the pyramid, an indication of their longer average life span. © Dr. Jean-Paul Rodrigue
Regressive: Population Pyramid of Sweden, 2015 ■ Sweden’s pyramid • Does not appear to be a pyramid at all. • Youngest component is smaller than its middle-aged population and only slightly larger than its aged population. • No-growth situation, since some deaths occur from all age groupings. • Sweden has a higher death rate than Mexico. © Dr. Jean-Paul Rodrigue
B – DEMOGRAPHIC THEORY 1. The Malthusian Trap 2. Demographic Transition Theory © Dr. Jean-Paul Rodrigue
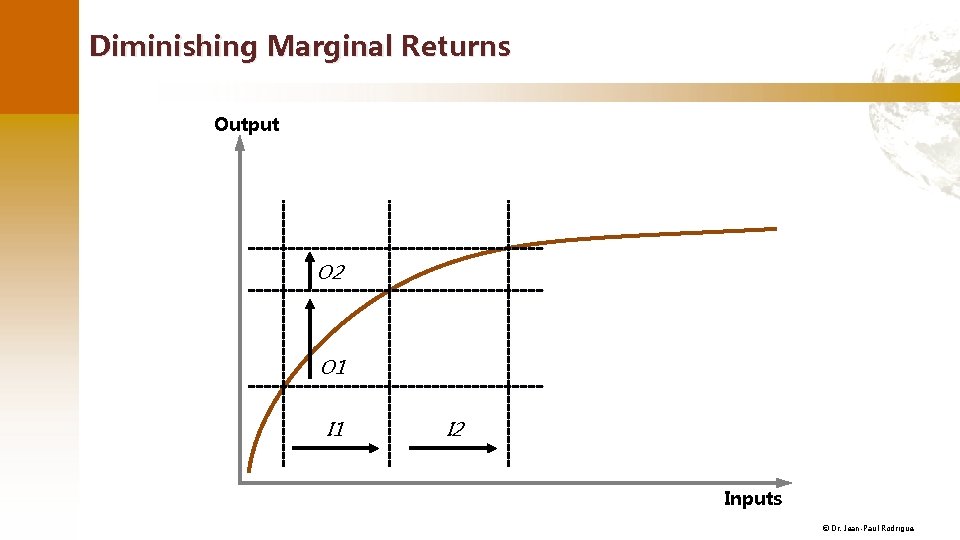
1. The Malthusian Trap ■ Malthusian theory • Based on demographic observations made in the late 18 th century. • Early phases of industrialization in Great Britain with fast population growth. • Considers that population grows in an exponential fashion while resource (food supply) growth is linear. • Agricultural output facing declining marginal returns: • Available agricultural land is limited. • New agricultural land being developed tends to be marginal (less suitable for crop production). © Dr. Jean-Paul Rodrigue
Diminishing Marginal Returns Output O 2 O 1 I 2 Inputs © Dr. Jean-Paul Rodrigue
1. The Malthusian Trap ■ The “Malthusian crisis” • Differential growth: • If growth persists, the population will eventually surpass available resources. • An increase in inputs such as land labor did not lead to an inconsistent growth in outputs. • The outcomes are “Malthusian crises”: • Food shortages. • Famines. • War and epidemics. • “Fix” the population in accordance with available resources. • Necessity of a “moral restraint” on reproduction. • Enduring Malthusian view in the contemporary environmental movement: • “every life saved this year in a poor country diminishes the quality of life for subsequent generations. ” Paul Ehrlich (The Population Bomb). © Dr. Jean-Paul Rodrigue
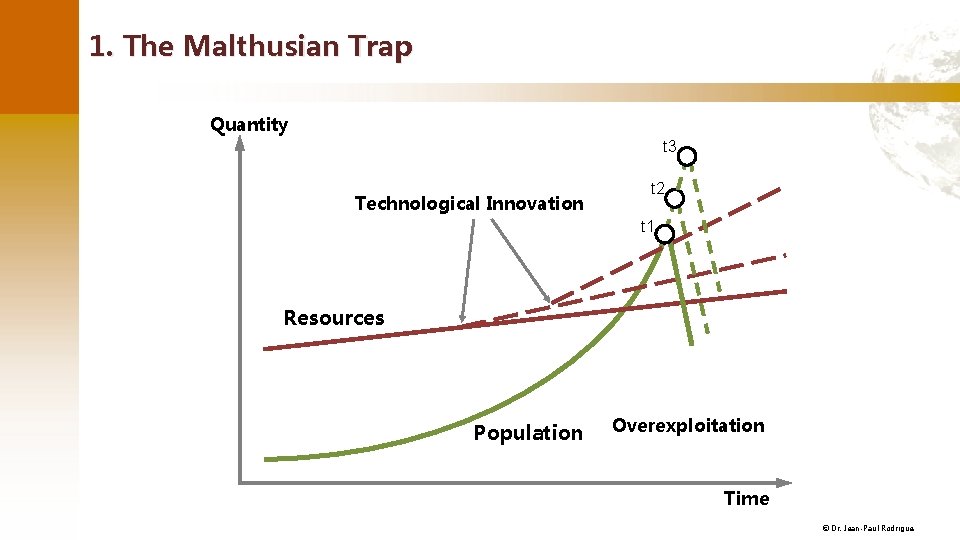
1. The Malthusian Trap Quantity t 3 Technological Innovation t 2 t 1 Resources Population Overexploitation Time © Dr. Jean-Paul Rodrigue
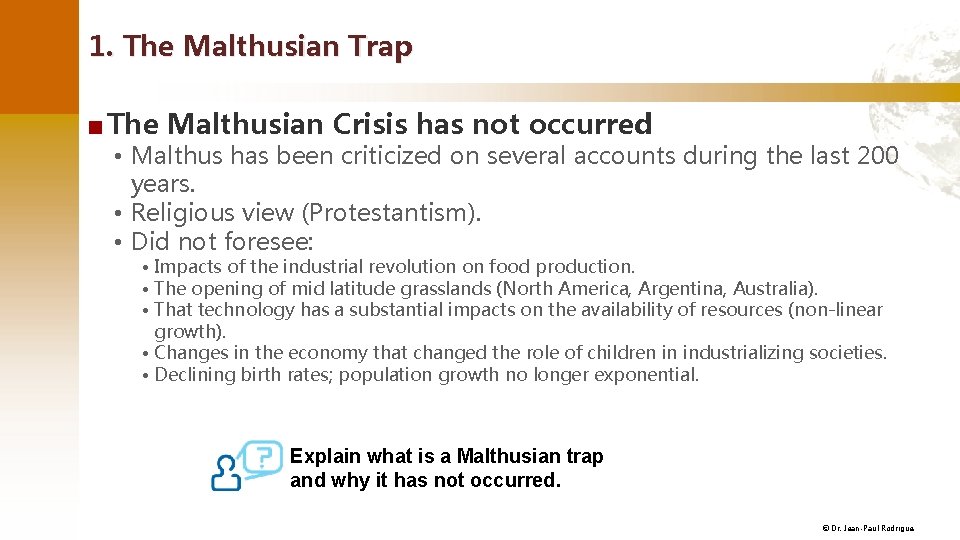
1. The Malthusian Trap ■ The Malthusian Crisis has not occurred • Malthus has been criticized on several accounts during the last 200 years. • Religious view (Protestantism). • Did not foresee: • Impacts of the industrial revolution on food production. • The opening of mid latitude grasslands (North America, Argentina, Australia). • That technology has a substantial impacts on the availability of resources (non-linear growth). • Changes in the economy that changed the role of children in industrializing societies. • Declining birth rates; population growth no longer exponential. Explain what is a Malthusian trap and why it has not occurred. © Dr. Jean-Paul Rodrigue
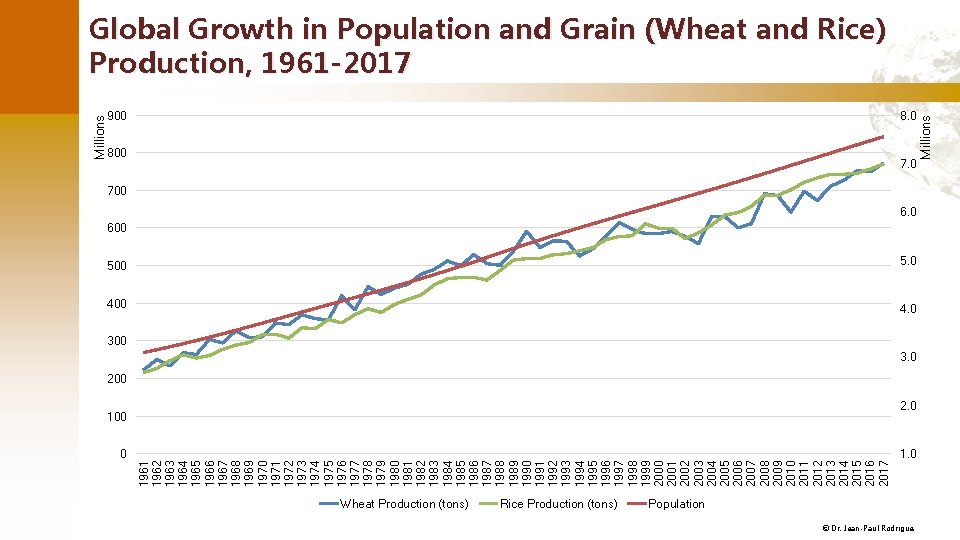
0 1961 1962 1963 1964 1965 1966 1967 1968 1969 1970 1971 1972 1973 1974 1975 1976 1977 1978 1979 1980 1981 1982 1983 1984 1985 1986 1987 1988 1989 1990 1991 1992 1993 1994 1995 1996 1997 1998 1999 2000 2001 2002 2003 2004 2005 2006 2007 2008 2009 2010 2011 2012 2013 2014 2015 2016 2017 Millions 900 8. 0 800 7. 0 700 6. 0 600 5. 0 400 4. 0 300 3. 0 200 100 2. 0 Wheat Production (tons) Rice Production (tons) 1. 0 Population © Dr. Jean-Paul Rodrigue Millions Global Growth in Population and Grain (Wheat and Rice) Production, 1961 -2017
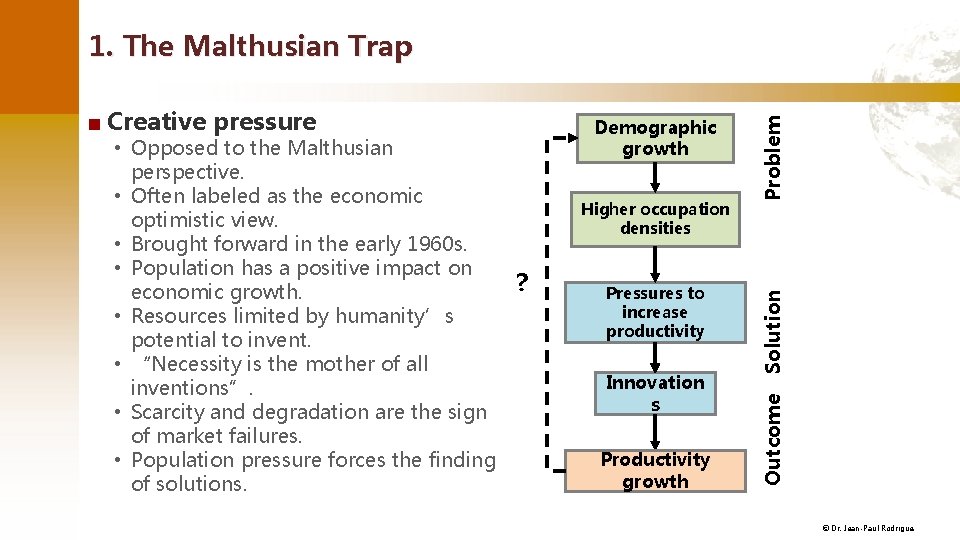
Higher occupation densities Pressures to increase productivity Innovation s Productivity growth Solution • Opposed to the Malthusian perspective. • Often labeled as the economic optimistic view. • Brought forward in the early 1960 s. • Population has a positive impact on ? economic growth. • Resources limited by humanity’s potential to invent. • “Necessity is the mother of all inventions”. • Scarcity and degradation are the sign of market failures. • Population pressure forces the finding of solutions. Demographic growth Outcome ■ Creative pressure Problem 1. The Malthusian Trap © Dr. Jean-Paul Rodrigue
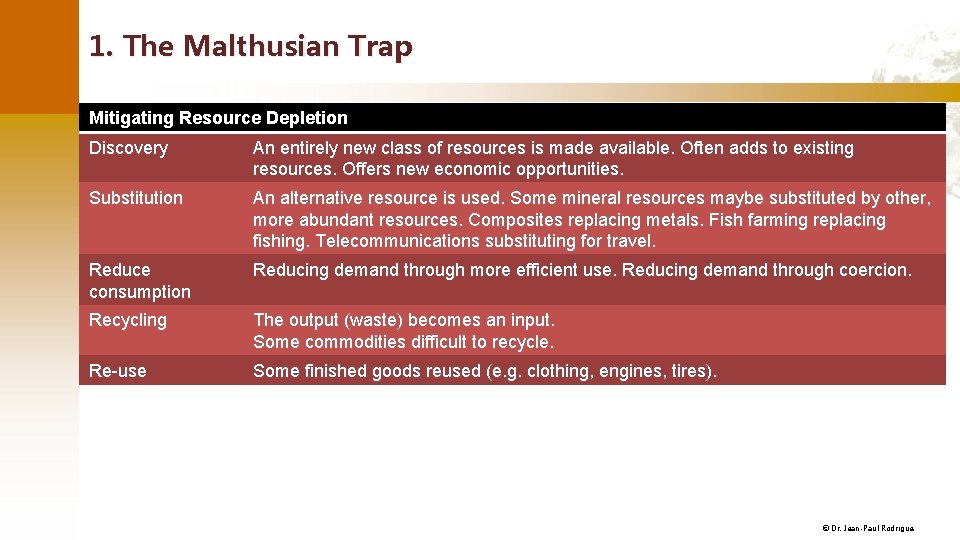
1. The Malthusian Trap Mitigating Resource Depletion Discovery An entirely new class of resources is made available. Often adds to existing resources. Offers new economic opportunities. Substitution An alternative resource is used. Some mineral resources maybe substituted by other, more abundant resources. Composites replacing metals. Fish farming replacing fishing. Telecommunications substituting for travel. Reduce consumption Reducing demand through more efficient use. Reducing demand through coercion. Recycling The output (waste) becomes an input. Some commodities difficult to recycle. Re-use Some finished goods reused (e. g. clothing, engines, tires). © Dr. Jean-Paul Rodrigue
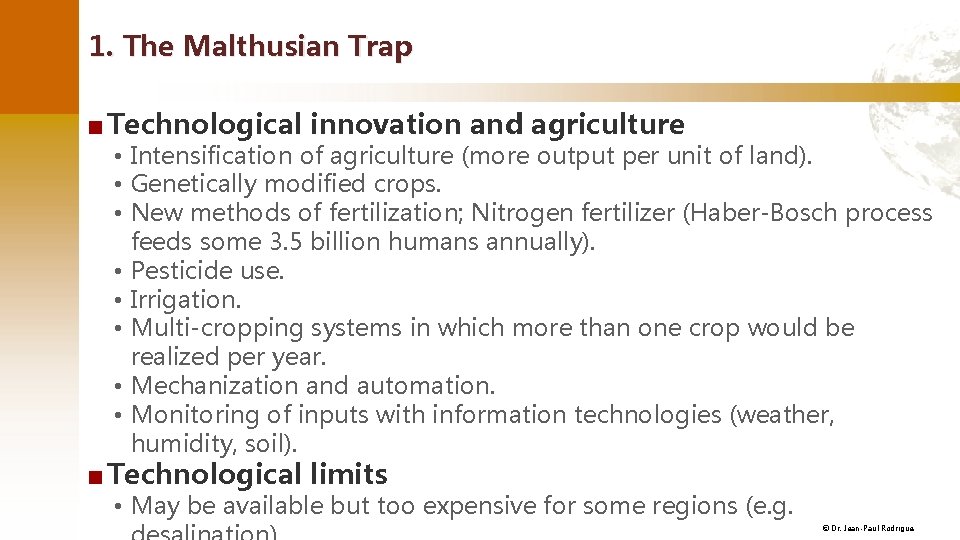
1. The Malthusian Trap ■ Technological innovation and agriculture • Intensification of agriculture (more output per unit of land). • Genetically modified crops. • New methods of fertilization; Nitrogen fertilizer (Haber-Bosch process feeds some 3. 5 billion humans annually). • Pesticide use. • Irrigation. • Multi-cropping systems in which more than one crop would be realized per year. • Mechanization and automation. • Monitoring of inputs with information technologies (weather, humidity, soil). ■ Technological limits • May be available but too expensive for some regions (e. g. © Dr. Jean-Paul Rodrigue
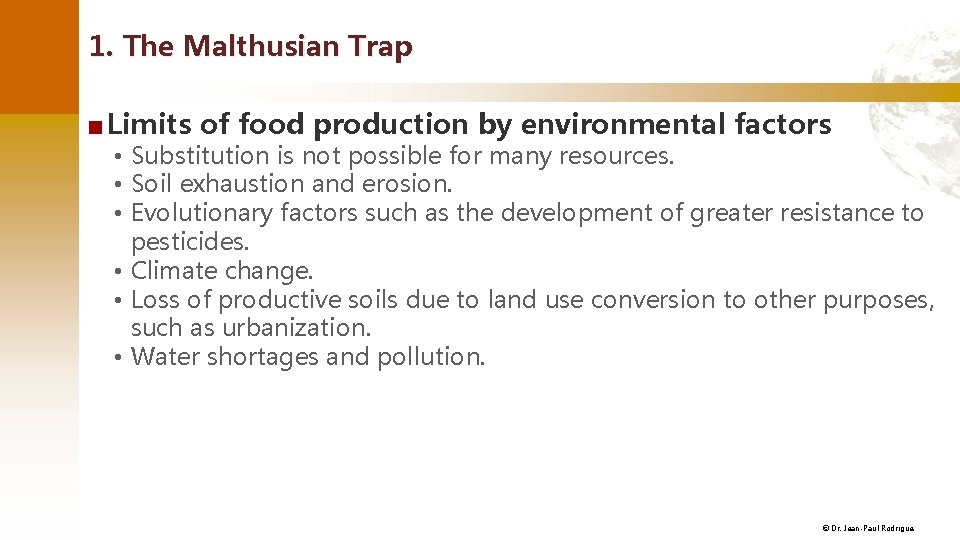
1. The Malthusian Trap ■ Limits of food production by environmental factors • Substitution is not possible for many resources. • Soil exhaustion and erosion. • Evolutionary factors such as the development of greater resistance to pesticides. • Climate change. • Loss of productive soils due to land use conversion to other purposes, such as urbanization. • Water shortages and pollution. © Dr. Jean-Paul Rodrigue
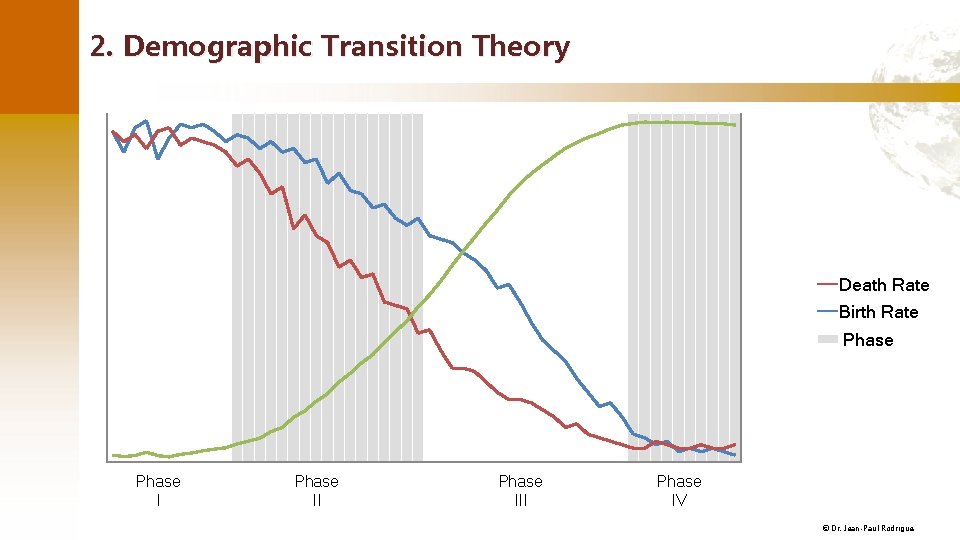
2. Demographic Transition Theory Death Rate Birth Rate Phase III Phase IV © Dr. Jean-Paul Rodrigue
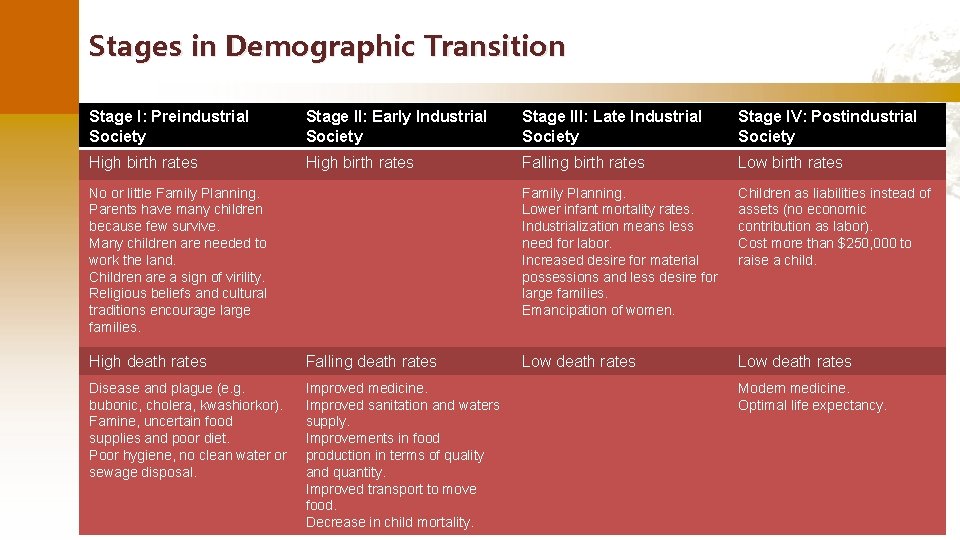
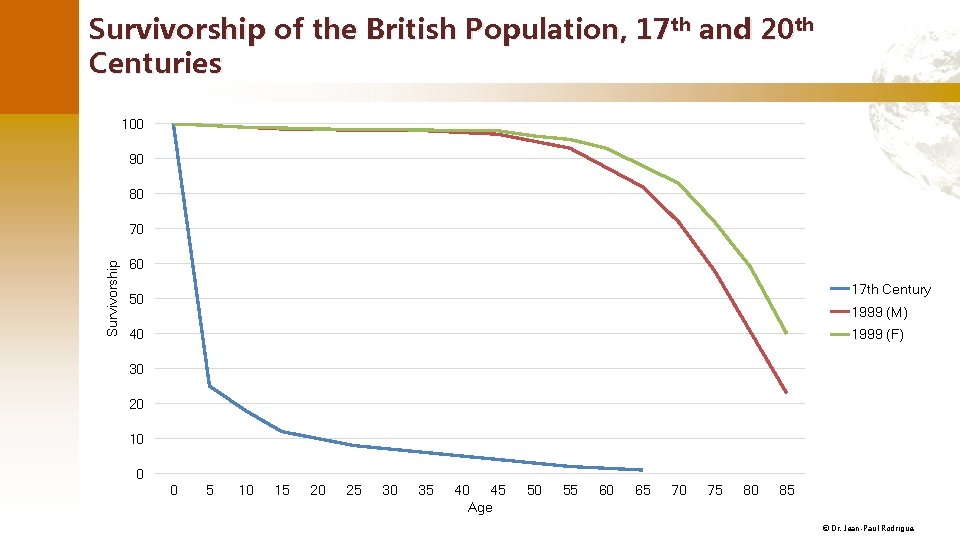
Stages in Demographic Transition Stage I: Preindustrial Society Stage II: Early Industrial Society Stage III: Late Industrial Society Stage IV: Postindustrial Society High birth rates Falling birth rates Low birth rates Family Planning. Lower infant mortality rates. Industrialization means less need for labor. Increased desire for material possessions and less desire for large families. Emancipation of women. Children as liabilities instead of assets (no economic contribution as labor). Cost more than $250, 000 to raise a child. Low death rates No or little Family Planning. Parents have many children because few survive. Many children are needed to work the land. Children are a sign of virility. Religious beliefs and cultural traditions encourage large families. High death rates Falling death rates Disease and plague (e. g. bubonic, cholera, kwashiorkor). Famine, uncertain food supplies and poor diet. Poor hygiene, no clean water or sewage disposal. Improved medicine. Improved sanitation and waters supply. Improvements in food production in terms of quality and quantity. Improved transport to move food. Decrease in child mortality. Modern medicine. Optimal life expectancy. © Dr. Jean-Paul Rodrigue
Survivorship of the British Population, 17 th and 20 th Centuries 100 90 80 Survivorship 70 60 17 th Century 50 1999 (M) 40 1999 (F) 30 20 10 0 0 5 10 15 20 25 30 35 40 45 Age 50 55 60 65 70 75 80 85 © Dr. Jean-Paul Rodrigue
0 1961 1962 1963 1964 1965 1966 1967 1968 1969 1970 1971 1972 1973 1974 1975 1976 1977 1978 1979 1980 1981 1982 1983 1984 1985 1986 1987 1988 1989 1990 1991 1992 1993 1994 1995 1996 1997 1998 1999 2000 2001 2002 2003 2004 2005 2006 2007 2008 2009 2010 2011 2012 2013 2014 2015 2016 Total Fertility Rate, Selected Units, World European Union North America Explain what is the demographic transition and 1960 -2016 how it impacts the world’s population. 7 6 5 4 3 2 1 Sub-Saharan Africa China India © Dr. Jean-Paul Rodrigue
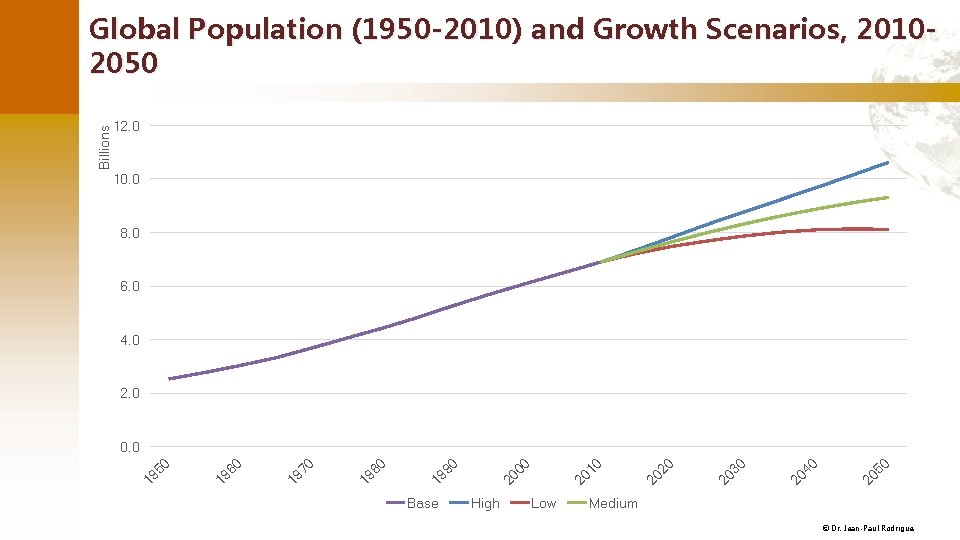
12. 0 10. 0 8. 0 6. 0 4. 0 2. 0 Base High Low 50 20 40 20 30 20 20 20 10 20 00 20 90 19 80 19 70 19 60 19 50 0. 0 19 Billions Global Population (1950 -2010) and Growth Scenarios, 20102050 Medium © Dr. Jean-Paul Rodrigue
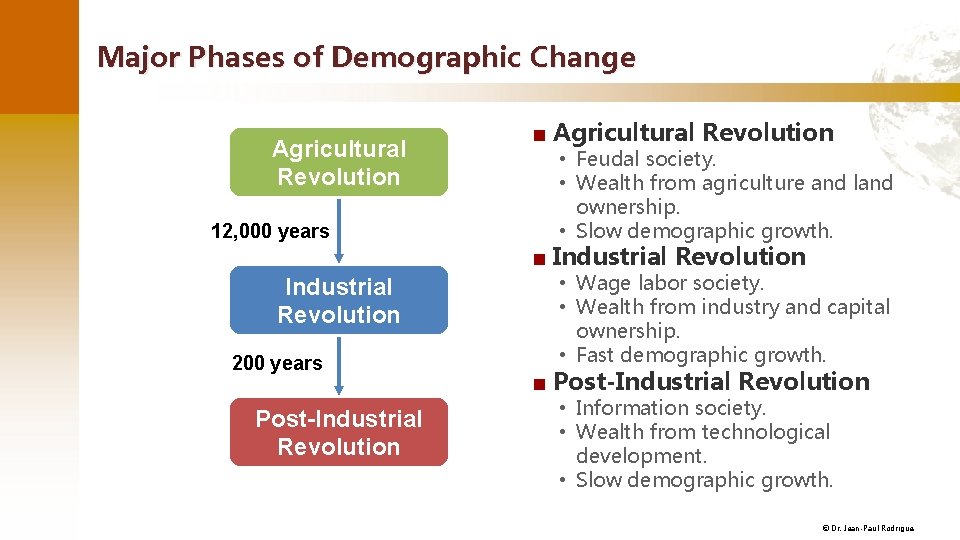
Major Phases of Demographic Change Agricultural Revolution 12, 000 years Industrial Revolution 200 years Post-Industrial Revolution ■ Agricultural Revolution • Feudal society. • Wealth from agriculture and land ownership. • Slow demographic growth. ■ Industrial Revolution • Wage labor society. • Wealth from industry and capital ownership. • Fast demographic growth. ■ Post-Industrial Revolution • Information society. • Wealth from technological development. • Slow demographic growth. © Dr. Jean-Paul Rodrigue
C – MIGRATION 1. Causes of Migration 2. Patterns of Migration © Dr. Jean-Paul Rodrigue
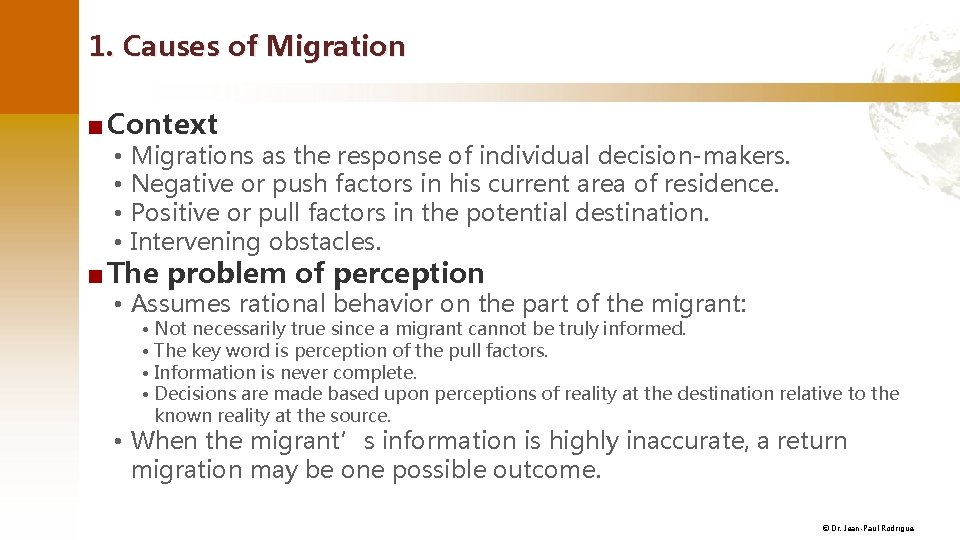
1. Causes of Migration ■ Context • • Migrations as the response of individual decision-makers. Negative or push factors in his current area of residence. Positive or pull factors in the potential destination. Intervening obstacles. ■ The problem of perception • Assumes rational behavior on the part of the migrant: • Not necessarily true since a migrant cannot be truly informed. • The key word is perception of the pull factors. • Information is never complete. • Decisions are made based upon perceptions of reality at the destination relative to the known reality at the source. • When the migrant’s information is highly inaccurate, a return migration may be one possible outcome. © Dr. Jean-Paul Rodrigue
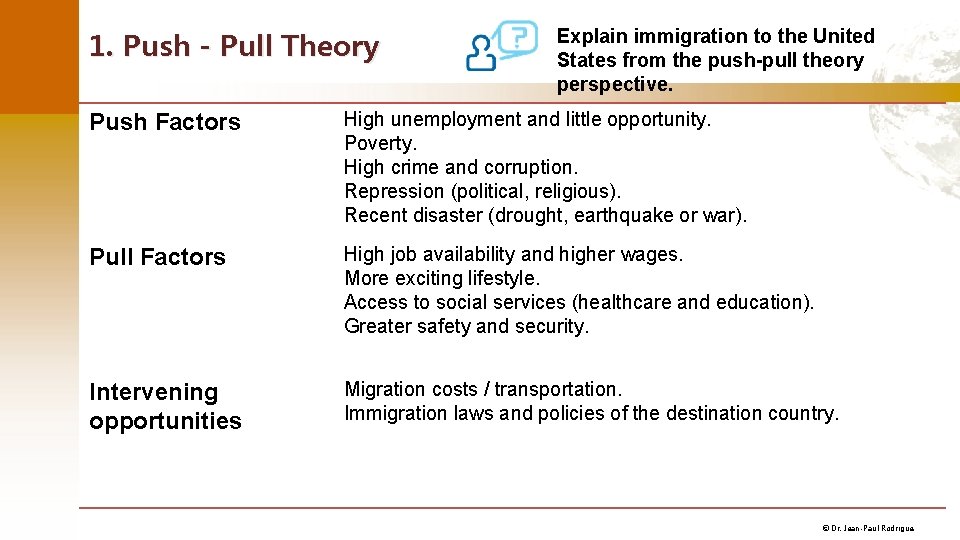
1. Push - Pull Theory Explain immigration to the United States from the push-pull theory perspective. Push Factors High unemployment and little opportunity. Poverty. High crime and corruption. Repression (political, religious). Recent disaster (drought, earthquake or war). Pull Factors High job availability and higher wages. More exciting lifestyle. Access to social services (healthcare and education). Greater safety and security. Intervening opportunities Migration costs / transportation. Immigration laws and policies of the destination country. © Dr. Jean-Paul Rodrigue
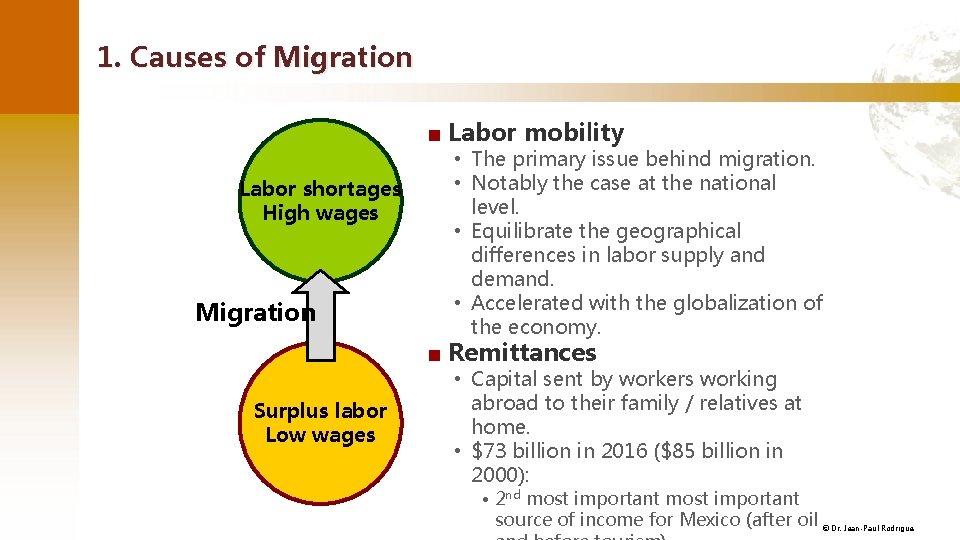
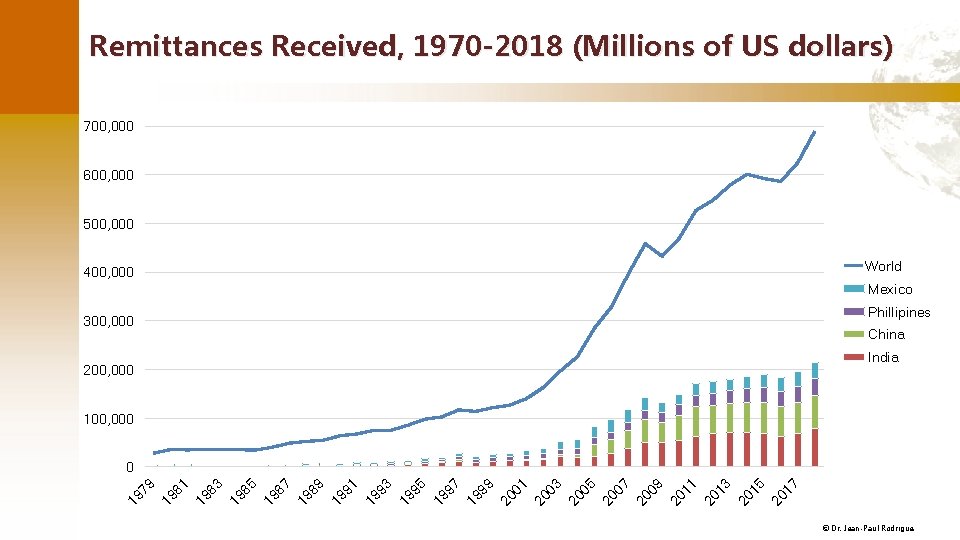
1. Causes of Migration ■ Labor mobility Labor shortages High wages Migration • The primary issue behind migration. • Notably the case at the national level. • Equilibrate the geographical differences in labor supply and demand. • Accelerated with the globalization of the economy. ■ Remittances Surplus labor Low wages • Capital sent by workers working abroad to their family / relatives at home. • $73 billion in 2016 ($85 billion in 2000): • 2 nd most important source of income for Mexico (after oil © Dr. Jean-Paul Rodrigue
Remittances Received, 1970 -2018 (Millions of US dollars) 700, 000 600, 000 500, 000 World 400, 000 Mexico Phillipines 300, 000 China India 200, 000 17 20 15 20 13 20 11 20 09 20 07 20 05 20 03 20 01 20 99 19 97 19 95 19 93 19 91 19 89 19 87 19 5 19 8 83 19 81 19 19 79 0 © Dr. Jean-Paul Rodrigue
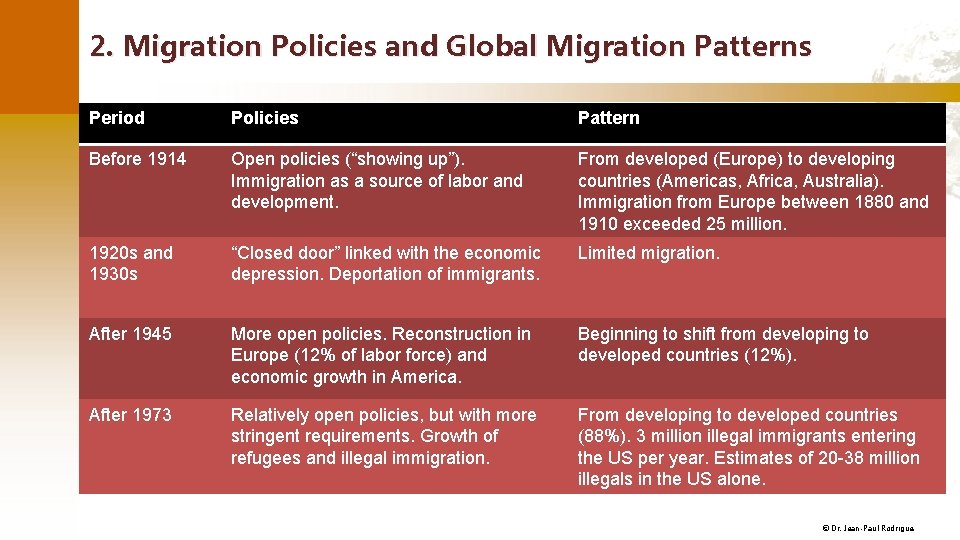
2. Migration Policies and Global Migration Patterns Period Policies Pattern Before 1914 Open policies (“showing up”). Immigration as a source of labor and development. From developed (Europe) to developing countries (Americas, Africa, Australia). Immigration from Europe between 1880 and 1910 exceeded 25 million. 1920 s and 1930 s “Closed door” linked with the economic depression. Deportation of immigrants. Limited migration. After 1945 More open policies. Reconstruction in Europe (12% of labor force) and economic growth in America. Beginning to shift from developing to developed countries (12%). After 1973 Relatively open policies, but with more stringent requirements. Growth of refugees and illegal immigration. From developing to developed countries (88%). 3 million illegal immigrants entering the US per year. Estimates of 20 -38 million illegals in the US alone. © Dr. Jean-Paul Rodrigue
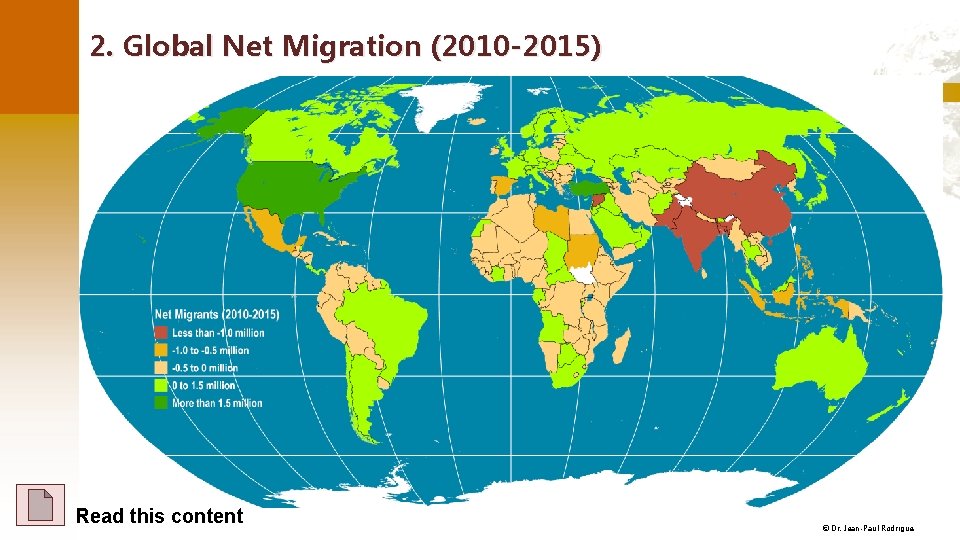
2. Global Net Migration (2010 -2015) Read this content © Dr. Jean-Paul Rodrigue
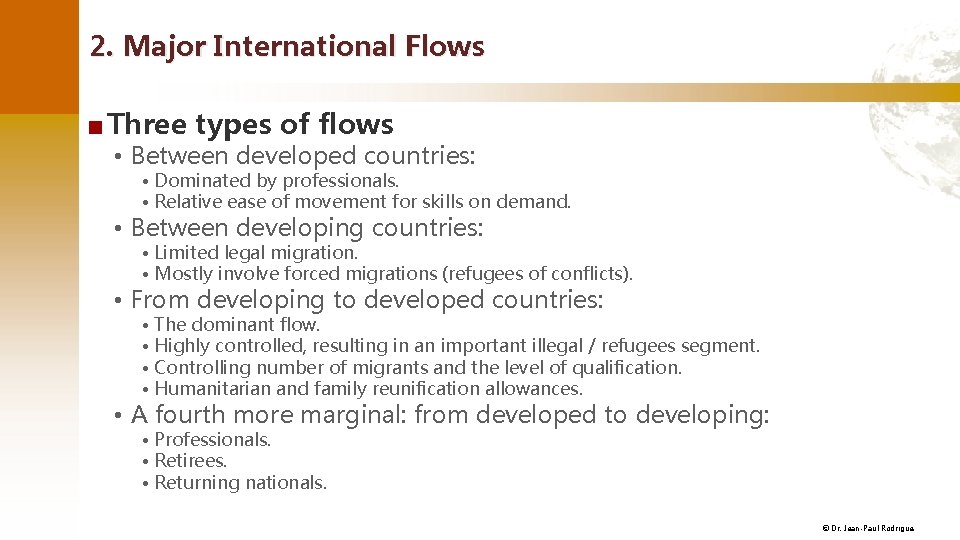
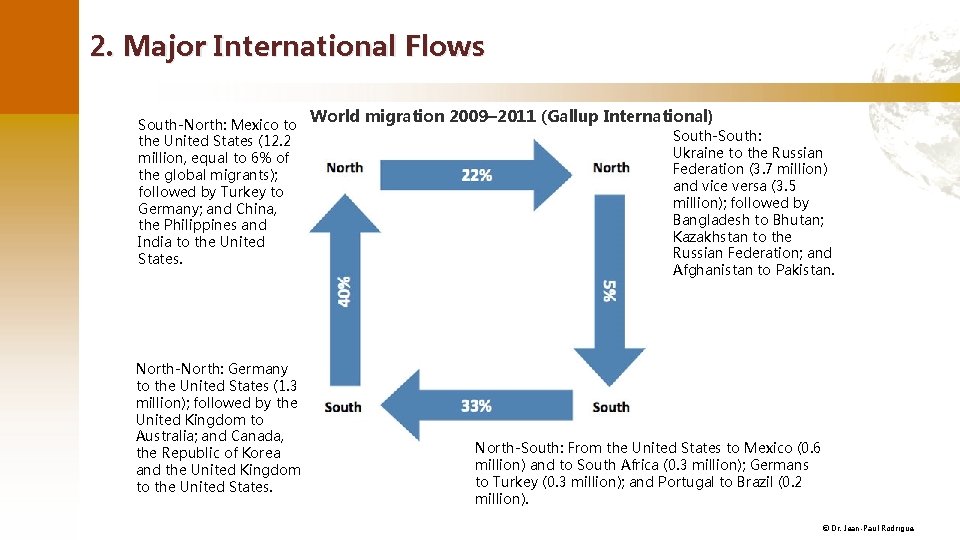
2. Major International Flows ■ Three types of flows • Between developed countries: • Dominated by professionals. • Relative ease of movement for skills on demand. • Between developing countries: • Limited legal migration. • Mostly involve forced migrations (refugees of conflicts). • From developing to developed countries: • The dominant flow. • Highly controlled, resulting in an important illegal / refugees segment. • Controlling number of migrants and the level of qualification. • Humanitarian and family reunification allowances. • A fourth more marginal: from developed to developing: • Professionals. • Retirees. • Returning nationals. © Dr. Jean-Paul Rodrigue
2. Major International Flows South-North: Mexico to the United States (12. 2 million, equal to 6% of the global migrants); followed by Turkey to Germany; and China, the Philippines and India to the United States. North-North: Germany to the United States (1. 3 million); followed by the United Kingdom to Australia; and Canada, the Republic of Korea and the United Kingdom to the United States. World migration 2009– 2011 (Gallup International) South-South: Ukraine to the Russian Federation (3. 7 million) and vice versa (3. 5 million); followed by Bangladesh to Bhutan; Kazakhstan to the Russian Federation; and Afghanistan to Pakistan. North-South: From the United States to Mexico (0. 6 million) and to South Africa (0. 3 million); Germans to Turkey (0. 3 million); and Portugal to Brazil (0. 2 million). © Dr. Jean-Paul Rodrigue
2. Patterns of Migration ■ Growing level of temporary migration schemes • Work permits. • More in tune with seasonal and economic cycles. ■ Skilled migrants are increasingly sought after • Lower costs. • Cannot be easily recruited by another corporation. ■ Growing anti-immigration stance in many countries • • Health: carry endemic diseases (e. g. rise of diseases in California). Economic: depress wages and increase social burden. Nationalism: undermine the cohesion of nation-states. Environment: cause additional population burdens. © Dr. Jean-Paul Rodrigue
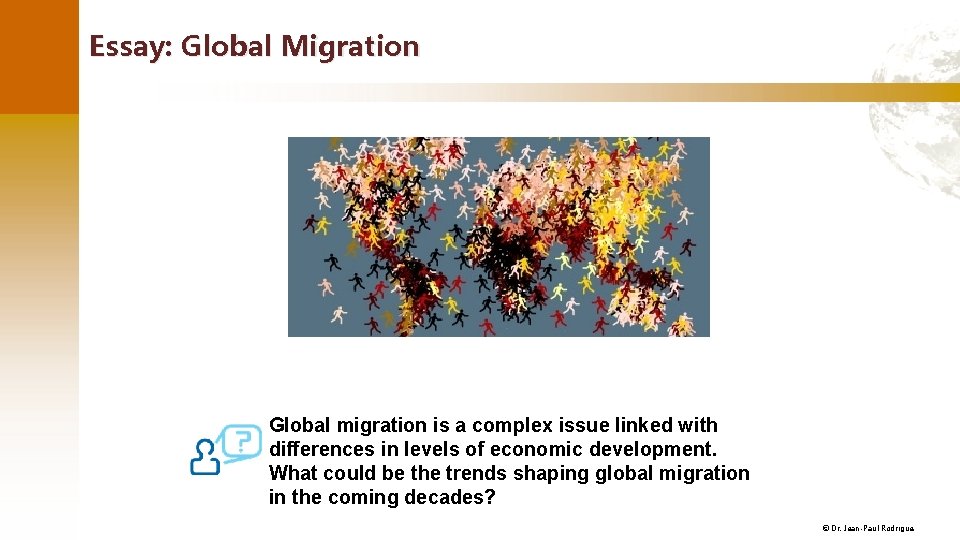
Essay: Global Migration Global migration is a complex issue linked with differences in levels of economic development. What could be the trends shaping global migration in the coming decades? © Dr. Jean-Paul Rodrigue