GEOCHEMISTRY OF GEOTHERMAL SYSTEMS WATER CHEMISTRY Chemical composition


 temperatures qusing ØChemical & isotopic composition of surface discharges")


 Øcauses changes in the composition of ascending")


")


 and amorphous silica")


 q based on the partitioning of alkalies between solid and")

![CATION GEOTHERMOMETERS Na/K Geothermometer Geotherm. Equations Reference Na-K T=[855. 6/(0. 857+log(Na/K))]-273. 15 Truesdell (1976)](https://slidetodoc.com/presentation_image/59c773b7ceb87b373f197c1fd13f48f9/image-39.jpg "CATION GEOTHERMOMETERS Na/K Geothermometer Geotherm. Equations Reference Na-K T=[855. 6/(0. 857+log(Na/K))]-273. 15 Truesdell (1976)")

+ (log ( Ca/Na)+2. 06)+")


 B, D = mixed, warm")


sample- (D/H)standard D ( ) =")
sample- (D/H)SMOW D ( ) =")


 Vapour Separation Volume of (residual) liquid Concentration of dissolved components in liquid Liquid")


 3 H = radioactive isotope of Hydrogene (with a short half-life)")


- Isotopes 32 S = 95. 02 % 33 S = 0. 75")
 - 34 S(mineral 2) 34 S")

- Slides: 91
GEOCHEMISTRY OF GEOTHERMAL SYSTEMS
WATER CHEMISTRY Chemical composition of waters is expressed in terms of major anion and cation contents. Major Cations: Na+, K+, Ca++, Mg++ Major Anions: HCO 3 - (or CO 3=), Cl-, SO 4= – – – HCO 3 - dominant in neutral conditions CO 3= dominant in alkaline (p. H>8) conditions H 2 CO 3 dominant in acidic conditions Also dissolved silica (Si. O 2) in neutral form as a major constituent Minor constituents: B, F, Li, Sr, . . .
WATER CHEMISTRY concentration of chemical constituents are expressed in units of Ømg/l (ppm=parts per million) (mg/l is the preferred unit) ØMolality = no. of moles / kg of solvent No. of moles = (mg/l*10 -3) / formula weight
WATER CHEMISTRY Errors associated with water analyses are expressed in terms of CBE (Charge Balance Error) CBE (%) = ( z x mc - z x ma ) / ( z x mc + z x ma ) * 100 where, mc is the molality of cation ma is the molality of anion z is the charge If CBE 5%, the results are appropriate to use in any kind of interpretation
The constituents encountered in geothermal fluids TRACERS Chemically inert, non-reactive, conservative constituents (once added to the fluid phase, remain unchanged allowing their origins to be traced back to their source component - used to infer about the source characteristics) e. g. He, Ar (noble gases), Cl, B, Li, Rb, Cs, N 2 GEOINDICATORS Chemically reactive, non-conservative species (respond to changes in environment - used to infer about the physico-chemical processes during the ascent of water to surface, also used in geothermometry applications) e. g. Na, K, Mg, Ca, Si. O 2
WATER CHEMISTRY In this chapter, the main emphasis will be placed on the use of water chemistry in the determination of : vunderground (reservoir) temperatures : geothermometers vboiling and mixing relations (subsurface physico-chemical processes)
HYDROTHERMAL REACTIONS The composition of geothermal fluids are controlled by : temperature-dependent reactions between minerals and fluids The factors affecting the formation of hydrothermal minerals are: Ø Ø Ø temperature pressure rock type permeability fluid composition duration of activity
The effect of rock type --- most pronounced at low temperatures & insignificant above 280 C Above 280 C and at least as high as 350 C, the typical stable mineral assemblages (in active geothermal systems) are independent of rock type and include Ø ALBITE, K-FELDSPAR, CHLORITE, Fe-EPIDOTE, CALCITE, QUARTZ, ILLITE & PYRITE At lower temperatures, ZEOLITES and CLAY MINERALS are found. At low permeabilities equilibrium between rocks and fluids is seldom achieved. When permeabilities are relatively high and water residence times are long (months to years), water & rock should reach chemical equilibrium.
At equilibrium, ratios of cations in solution are controlled by temperaturedependent exchange reactions such as: Na. Al. Si 3 O 8 (albite) + K+ = KAl. Si 3 O 8 (K-felds. ) + Na+ Keq. = Na+ / K+ Hydrogen ion activity (p. H) is controlled by hydrolysis reactions, such as : 3 KAl. Si 3 O 8 (K-felds. ) + 2 H+ = K Al 3 Si 3 O 10(OH)2 (K-mica)+ 6 Si. O 2 + 2 K+ Keq. = K+ / H+ where, Keq. = equilibrium constant, square brackets indicate activities of dissolved species (activity is unity for pure solid phases)
ESTIMATION OF RESERVOIR TEMPERATURES The evaluation of the reservoir temperatures for geothermal systems is made in terms of GEOTHERMOMETRY APPLICATIONS
GEOTHERMOMETRY APPLICATIONS
GEOTHERMOMETRY APPLICATIONS One of the major tools for the exploration & development of geothermal resources
GEOTHERMOMETRY qestimation of reservoir (subsurface) temperatures qusing ØChemical & isotopic composition of surface discharges from ü wells and/or ü natural springs/fumaroles
GEOTHERMOMETERS CHEMICAL GEOTHERMOMETERS Øutilize the chemical composition ü silica and major cation contents of water discharges ügas concentrations or relative abundances of gaseous components in steam discharges ISOTOPIC GEOTHERMOMETERS Øbased on the isotope exchange reactions between various phases (water, gas, mineral) in geothermal systems
Focus of the Course ØCHEMICAL GEOTHERMOMETERS ØAs applied to water discharges PART I. Basic Principles & Types PART II. Examples/Problems
CHEMICAL GEOTHEROMOMETERS PART I. Basic Principles &Types
BASIC PRINCIPLES Chemical Geothermometers are developed on the basis of temperature dependent chemical equilibrium between the water and the minerals at the deep reservoir conditions based on the assumption that the water preserves its chemical composition during its ascent from the reservoir to the surface
BASIC PRINCIPLES Studies of well discharge chemistry and alteration mineralogy Øthe presence of equilibrium in several geothermal fields Øthe assumption of equilibrium is valid
BASIC PRINCIPLES Assumption of the preservation of water chemistry may not always hold Because the water composition may be affected by processes such as Øcooling Ømixing with waters from different reservoirs.
BASIC PRINCIPLES Cooling during ascent from reservoir to surface: ØCONDUCTIVE ØADIABATIC
BASIC PRINCIPLES CONDUCTIVE Cooling Ø Heat loss while travelling through cooler rocks ADIABATIC Cooling Ø Boiling because of decreasing hydrostatic head
BASIC PRINCIPLES Conductive cooling Ødoes not by itself change the composition of the water Øbut may affect its degree of saturation with respect to several minerals Øthus, it may bring about a modification in the chemical composition of the water by mineral dissolution or precipitation
BASIC PRINCIPLES Adiabatic cooling (Cooling by boiling) Øcauses changes in the composition of ascending water Øthese changes include üdegassing, and hence üthe increase in the solute content as a result of steam loss.
BASIC PRINCIPLES MIXING affects chemical composition since the solubility of most of the compounds in waters increases with increasing temperature, mixing with cold groundwater results in the dilution of geothermal water
Geothermometry applications are not simply inserting values into specific geothermometry equations. Interpretation of temperatures obtained from geothermometry equations requires a sound understanding of the chemical processes involved in geothermal systems. The main task of geochemist is to verify or disprove the validity of assumptions made in using specific geothermometers in specific fields.
TYPES OF CHEMICAL GEOTHERMOMETERS SILICA GEOTHERMOMETERS CATION GEOTHERMOMETERS (Alkali Geothermometers)
SILICA GEOTHERMOMETERS based on the Øexperimentally determined Øtemperature dependent variation in the solubility of silica in water Since silica can occur in various forms in geothermal fields (such as quartz, crystobalite, chalcedony, amorphous silica) different silica geothermometers have been developed by different workers
SILICA GEOTHERMOMETERS Geothermometer Equation Reference Quartz-no steam loss T = 1309 / (5. 19 – log C) - 273. 15 Fournier (1977) Quartz-maximum steam loss at 100 o. C T = 1522 / (5. 75 - log C) - 273. 15 Fournier (1977) Quartz T = 42. 198 + 0. 28831 C - 3. 6686 x 10 -4 C 2 + 3. 1665 x 10 -7 C 3 + 77. 034 log C Fournier and Potter (1982) Quartz T = 53. 500 + 0. 11236 C - 0. 5559 x 10 -4 C 2 + 0. 1772 x 10 -7 C 3 + 88. 390 log C Arnorsson (1985) based on Fournier and Potter (1982) Chalcedony T = 1032 / (4. 69 - log C) - 273. 15 Fournier (1977) Chalcedony T = 1112 / (4. 91 - log C) - 273. 15 Arnorsson et al. (1983) Alpha-Cristobalite T = 1000 / (4. 78 - log C) - 273. 15 Fournier (1977) Opal-CT (Beta-Cristobalite) T = 781 / (4. 51 - log C) - 273. 15 Fournier (1977) Amorphous silica T = 731 / (4. 52 - log C) - 273. 15 Fournier (1977)
SILICA GEOTHERMOMETERS The followings should be considered : temperature range in which the equations are valid effects of steam separation possible precipitation of silica Ø before sample collection (during the travel of fluid to surface, due to silica oversaturation) Ø after sample collection (due to improper preservation of sample) effects of p. H on solubility of silica possible mixing of hot water with cold water
SILICA GEOTHERMOMETERS Temperature Range silica geothermometers are valid for temperature ranges up to 250 C above 250 C, the equations depart drastically from the experimentally determined solubility curves
SILICA GEOTHERMOMETERS Temperature Range Fig. 1. Solubility of quartz (curve A) and amorphous silica (curve C) as a function of temperature at the vapour pressure of the solution. Curve B shows the amount of silica that would be in solution after an initially quartz-saturated solution cooled adiabatically to 100 C without any precipitation of silica (from Fournier and Rowe, 1966, and Truesdell and Fournier, 1976). At low T ( C) qtz less soluble amorph. silica more soluble Silica solubility is controlled by amorphous silica at low T ( C) quartz at high T ( C)
SILICA GEOTHERMOMETERS Effects of Steam Separation Boiling Steam Separation volume of residual liquid Concentration in liquid Temperature Estimate e. g. T = 1309 / (5. 19 – log C) - 273. 15 C = Si. O 2 in ppm increase in C (Si. O 2 in water > Si. O 2 in reservoir) decrease in denominator of the equation increase in T v for boiling springs boiling-corrected geothermometers (i. e. Quartz-max. steam loss)
SILICA GEOTHERMOMETERS Silica Precipitation Si. O 2 Temperature Estimate e. g. T = 1309 / (5. 19 – log C) - 273. 15 C = Si. O 2 in ppm decrease in C (Si. O 2 in water < Si. O 2 in reservoir) increase in denominator decrease in T
SILICA GEOTHERMOMETERS Effect of p. H Fig. 2. Calculated effect of p. H upon the solubility of quartz at various temperatures from 25 C to 300 C , using experimental data of Seward (1974). The dashed curve shows the p. H required at various temperatures to achieve a 10% increase in quartz solubility compared to the solubility at p. H=7. 0 (from Fournier, 1981). p. H Dissolved Si. O 2 (for p. H>7. 6) Temperature Estimate e. g. T = 1309 / (5. 19 – log C) - 273. 15 C = Si. O 2 in ppm increase in C decrease in denominator of the equation increase in T
SILICA GEOTHERMOMETERS Effect of Mixing Hot-Water High Si. O 2 content Cold-Water Low Si. O 2 content (Temperature Silica solubility ) Mixing (of hot-water with cold-water) Temperature Si. O 2 Temperature Estimate e. g. T = 1309 / (5. 19 – log C) - 273. 15 C = Si. O 2 in ppm decrease in C increase in denominator of the equation decrease in T
SILICA GEOTHERMOMETERS Process Reservoir Temperature Steam Separation Overestimated Silica Precipitation Underestimated Increase in p. H Overestimated Mixing with cold water Underestimated
CATION GEOTHERMOMETERS (Alkali Geothermometers) q based on the partitioning of alkalies between solid and liquid phases e. g. K+ + Na-feldspar = Na+ + K-feldspar q majority of are empirically developed geothermometers § Na/K geothermometer § Na-K-Ca-Mg geothermometer § Others (Na-Li, K-Mg, . . )
CATION GEOTHERMOMETERS Na/K Geothermometer Fig. 3. Na/K atomic ratios of well discharges plotted at measured downhole temperatures. Curve A is the least square fit of the data points above 80 C. Curve B is another empirical curve (from Truesdell, 1976). Curves C and D show the approximate locations of the low albite-microcline and high albite-sanidine lines derived from thermodynamic data (from Fournier, 1981).
CATION GEOTHERMOMETERS Na/K Geothermometer Geotherm. Equations Reference Na-K T=[855. 6/(0. 857+log(Na/K))]-273. 15 Truesdell (1976) Na-K T=[833/(0. 780+log(Na/K))]-273. 15 Tonani (1980) Na-K T=[933/(0. 993+log (Na/K))]-273. 15 (25 -250 o. C) Arnorsson et al. (1983) Na-K T=[1319/(1. 699+log(Na/K))]-273. 15 (250 -350 o. C) Arnorsson et al. (1983) Na-K T=[1217/(1. 483+log(Na/K))]-273. 15 Fournier (1979) Na-K T=[1178/(1. 470+log (Na/K))]-273. 15 Nieva and Nieva (1987) Na-K T=[1390/(1. 750+log(Na/K))]-273. 15 Giggenbach (1988)
CATION GEOTHERMOMETERS Na/K Geothermometer q gives good results for reservoir temperatures above 180 C. q yields erraneous estimates for low temperature waters vtemperature-dependent exchange equilibrium between feldspars and geothermal waters is not attained at low temperatures and the Na/K ratio in these waters are governed by leaching rather than chemical equilibrium q yields unusually high estimates for waters having high calcium contents
CATION GEOTHERMOMETERS Na-K-Ca Geothermometer Geotherm. Na-K-Ca Equations T=[1647/ (log (Na/K)+ (log ( Ca/Na)+2. 06)+ 2. 47)] Ca -273. 15 a) if log Ca/Na)+2. 06 < 0, use =1/3 and calculate T C b) if log Ca/Na)+2. 06 > 0, use =4/3 and calculate T C c) if calculated T > 100 C in (b), recalculate T C using =1/3 Reference Fournier and Truesdell (1973)
CATION GEOTHERMOMETERS Na-K-Ca Geothermometer Works well for CO 2 -rich or Ca-rich environments provided that calcite was not deposited after the water left the reservoir in case of calcite precipitation Ca 1647 T = ----------------------------log (Na/K)+ (log ( Ca/Na)+2. 06)+ 2. 47 Ca - 273. 15 Decrease in Ca concentration (Ca in water < Ca in reservoir) decrease in denominator of the equation increase in T For waters with high Mg contents, Na-K-Ca geothermometer yields erraneous results. For these waters, Mg correction is necessary
CATION GEOTHERMOMETERS Na-K-Ca-Mg Geothermometer Geotherm. Na-K-Ca-Mg Equations o T = TNa-K-Ca - t. Mg C R = (Mg / Mg + 0. 61 Ca + 0. 31 K) x 100 if R from 1. 5 to 5 t. Mgo. C = -1. 03 + 59. 971 log R + 145. 05 (log R)2 – 36711 (log R)2 / T - 1. 67 x 107 log R / T 2 if R from 5 to 50 t. Mgo. C=10. 66 -4. 7415 log R+325. 87(log R)21. 032 x 105(log R)2/T-1. 968 x 107(log R)3/T 2 Note: Do not apply a Mg correction if t. Mg is negative or R<1. 5. If R>50, assume a temperature = measured spring temperature. T is Na-K-Ca geothermometer temperature in Kelvin Reference Fournier and Potter (1979)
CATION GEOTHERMOMETERS Na-K-Ca-Mg Geothermometer Fig. 4. Graph for estimating the magnesium temperature correction to be subtracted from Na-K-Ca calculated temperature (from Fournier, 1981) R = (Mg/Mg + 0. 61 Ca + 0. 31 K)x 100
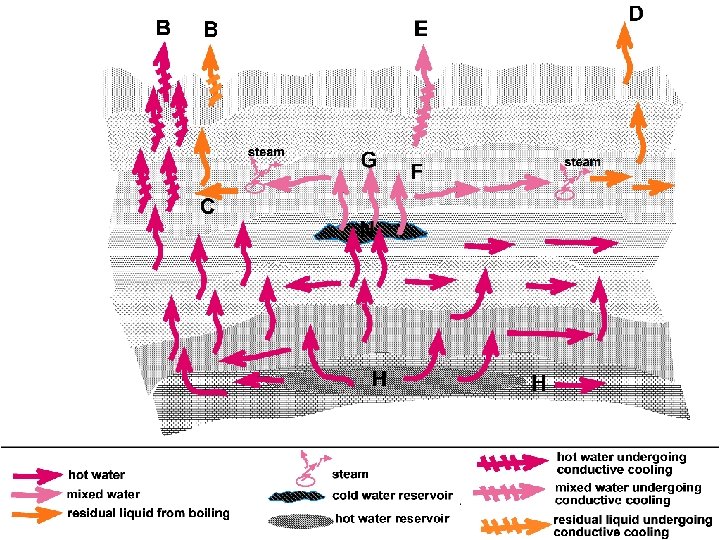
UNDERGROUND MIXING OF HOT AND COLD WATERS Recognition of Mixed Waters Mixing of hot ascending waters with cold waters at shallow depths is common. Mixing also occurs deep in hydrothermal systems. The effects of mixing on geothermometers is already discussed in previous section. Where all the waters reaching surface are mixed waters, recognition of mixing can be difficult. The recognition of mixing is especially difficult if waterrock re-equilibration occurred after mixing (complete or partial re-equilibration is more likely if the temperatures after mixing is well above 110 to 150 C, or if mixing takes place in aquifers with long residence times).
UNDERGROUND MIXING OF HOT AND COLD WATERS Some indications of mixing are as follows: systematic variations of spring compositions and measured temperatures, variations in oxygen or hydrogen isotopes, variations in ratios of relatively *conservative elements that do not precipitate from solution during movement of water through rock (e. g. Cl/B ratios).
SILICA-ENTHALPY MIXING MODEL Dissolved silica content of mixed waters can be used to determine the temperature of hot-water component. Dissolved silica is plotted against enthalpy of liquid water. Although temperature is the measured property, and enthalphy is a derived property, enthalpy is used as a coordinate rather than temperature. This is because the combined heat contents of two waters are conserved when those waters are mixed, but the combined temperatures are not. The enthalpy values are obtained from steam tables.
SILICA-ENTHALPY MIXING MODEL Fig. 5. Dissolved silicaenthalpy diagram showing procedure for calculating the initial enthalpy (and hence the reservoir temperature) of a high temperature water that has mixed with a low temperature water (from Fournier, 1981)
SILICA-ENTHALPY MIXING MODEL A = non-thermal component (cold water) B, D = mixed, warm water springs C = hot water component at reservoir conditions (assuming no steam separation before mixing) E = hot water component at reservoir conditions (assuming steam separation before mixing) Boiling T = 100 C Enthalpy = 419 J/g (corresponds to D in the graph) Enthalpy values (at corresponding temperatures) are found from Steam Table in Henley et al. (1984)
SILICA-ENTHALPY MIXING MODEL Steam Fraction did not separate before mixing The sample points are plotted. A straight line is drawn from the point representing the non -thermal component of the mixed water (i. e. the point with the lowest temperature and the lowest silica content = point A in Fig. ), through the mixed water warm springs (points B and D in Fig. ). The intersection of this line with the qtz solubility curve (point C in Fig. ) gives the enthalpy of the hot-water component (at reservoir conditions). From the steam table, the temperature corresponding to this enthalpy value is obtained as the reservoir temperature of the hot-water component.
SILICA-ENTHALPY MIXING MODEL Steam separation occurs before mixing The enthalpy at the boling temperature (100 C) is obtained from the steam tables (which is 419 j/g) A vertical line is drawn from the enthalpy value of 419 j/g From the inetrsection point of this line with the mixing line (Line AD), a horizantal line (DE) is drawn. The intersection of line DE with the solubility curve for maximum steam loss (point E) gives the enthalpy of the hotwater component. From the steam tables, the reservoir temperature of the hot-water component is determined.
SILICA-ENTHALPY MIXING MODEL In order for the silica mixing model to give accurate results, it is vital that no conductive cooling occurred after mixing. If conductive cooling occurred after mixing, then the calculated temperatures will be too high (overestimated temperatures). This is because: the original points before conductive cooling should lie to the right of the line AD (i. e. towards the higher enthalpy values at the same silica concentrations, as conductive cooling will affect only the temperatures, not the silica contents) in this case, the intersection of mixing line with the quartz solubility curve will give lower enthalpy values (i. e lower temperatures) than that obtained in case of conductive cooling. in other words, the temperatures obtained in case of conductive cooling will be higher than the actual reservoir temperatures (i. e. if conductive cooling occurred after mixing, the temperatures will be overestimated)
SILICA-ENTHALPY MIXING MODEL Another requirement for the use of enthalpy-silica model is that no silica deposition occurred before or after mixing. If silica deposition occurred, the temperatures will be underestimated. This is because: the original points before silica deposition should be towards higher silica contents (at the same enthalpy values) in this case, the intersection point of mixing line with the silica solubility curve will have higher enthalpy values(higher temperatures) than that obtained in case of silica deposition in other words, the temperatures obtained in case of no silica deposition will be higher than that in case of silica deposition (i. e. the temperatures will be underestimated in case of silica deposition)
CHLORIDE-ENTHALPY MIXING MODEL Fig. 6. Enthalpy-chloride diagram for waters from Yellowstone National Park. Small circles indicate Geyser Hill-type waters and smal dots indicate Black Sand-type waters (From Fournier, 1981).
CHLORIDE-ENTHALPY MIXING MODEL ESTIMATION OF RESERVOIR TEMPERATURE Geyser Hill-type Waters A = maximum Cl content B = minimum Cl content C = minimum enthalpy at the reservoir Black Sand-type Waters D = maximum Cl content E = minimum Cl content F = minimum enthalpy at the reservoir Enthalpy of steam at 100 C = 2676 J/g (Henley et al. , 1984)
CHLORIDE-ENTHALPY MIXING MODEL ORIGIN OF WATERS N = cold water component C, F = hot water components F is more dilute & slightly cooler than C F can not be derived from C by process of mixing between hot and cold water (point N), because any mixture would lie on or close to line CN. C and F are probably both related to a still higher enthalpy water such as point G or H.
CHLORIDE-ENTHALPY MIXING MODEL ORIGIN OF WATERS water C could be related to water G by boiling water C could also be related to water H by conductive cooling water F could be related to water G or water H by mixing with cold water N
ISOTOPES IN GEOTHERMAL EXPLORATION & DEVELOPMENT
ISOTOPE STUDIES IN GEOTHERMAL SYSTEMS At Exploration, Development and Exploitation Stages Most commonly used isotopes – Hydrogen (1 H, 2 H =D, 3 H) – Oxygen (18 O, 16 O) – Sulphur (32 S, 34 S) – Helium (3 He, 4 He)
ISOTOPE STUDIES IN GEOTHERMAL SYSTEMS Geothermal Fluids Sources – Source of fluids (meteoric, magmatic, . . ) – Physico-chemical processes affecting the fluid comosition ü Water-rock interaction ü Evaporation ü Condensation – Source of components in fluids (mantle, crust, . . ) Ages (time between recharge-discharge, recharge-sampling) Temperatures (Geothermometry Applications)
Sources of Geothermal Fluids ÄH- & O- Isotopes Physico-chemical processes affecting the fluid composition ÄH- & O- Isotopes Sources of components (elements, compounds) in geothermal fluids ÄHe-Isotopes (volatile elements)
Sources of Geothermal Fluids and Physico-Chemical Processes STABLE H- & O-ISOTOPES
Sources of Geothermal Fluids Stable H- & O-Isotopes 1 H = % 99. 9852 2 H (D) = % 0. 0148 D/H 16 O = % 99. 76 17 O = % 0. 04 18 O = % 0. 20 18 O / 16 O
Sources of Geothermal Fluids Stable H- & O-Isotopes (D/H)sample- (D/H)standard D ( ) = ------------------ x 103 (D/H)standard (18 O/16 O)sample- (18 O/16 O)standard 18 O ( ) = ---------------------- x 103 (18 O/16 O)standard Standard = Standard Mean Ocean Water = SMOW
Sources of Geothermal Fluids Stable H- & O-Isotopes (D/H)sample- (D/H)SMOW D ( ) = ------------------ x 103 (D/H)SMOW (18 O/16 O)sample- (18 O/16 O)SMOW 18 O ( ) = ---------------------- x 103 (18 O/16 O)SMOW
Sources of Geothermal Fluids Stable H- & O-Isotopes Sources of Natural Waters: 1. 2. 3. Meteoric Water (rain, snow) Sea Water Fossil Waters (trapped in sediments in sedimanary basins) 4. Magmatic Waters 5. Metamorphic Waters
Sources of Geothermal Fluids Stable H- & O-Isotopes
Sources of Geothermal Fluids Stable H- & O-Isotopes
Sources of Geothermal Fluids Stable H- & O-Isotopes
Sources of Geothermal Fluids Stable H- & O-Isotopes
Physico-Chemical Processes: Stable H- & O-Isotopes Latitute – D 18 O Altitute from Sea level – D 18 O
Physico-Chemical Processes: Stable H- & O-Isotopes Aquifers recharged by precipitation from lower altitutes higher D - 18 O values q Aquifers recharged by precipitation from higher altitutes lower D - 18 O values Mixing of waters from different aquifers
Physico-Chemical Processes: Stable H- & O-Isotopes Boiling and vapor separation D 18 O in residual liquid Possible subsurface boiling as a consequence of pressure decrease (due to continuous exploitation from production wells)
Monitoring Studies in Geothermal Exploitation Aquifers recharged by precipitation from lower altitutes higher D - 18 O Aquifers recharged by precipitation from higher altitutes lower D - 18 O Boiling and vapor separation D 18 O in residual liquid Any increase in D - 18 O values due to sudden pressure drop in production wells recharge from (other) aquifers fed by precipitation from lower altitutes subsurface boiling and vapour separation
Monitoring Studies in Geothermal Exploitation Monitoring of isotope composition of geothermal fluids during exploitation can lead to determination of, and the development of necessary precautions against – Decrease in enthalpy due to start of recharge from cold, shallow aquifers, or – Scaling problems developed as a result of subsurface boiling
(Scaling) Vapour Separation Volume of (residual) liquid Concentration of dissolved components in liquid Liquid will become oversaturated Component (calcite, silica, etc. ) will precipitate Scaling
Dating of Geothermal Fluids 3 H- & 3 He-ISOTOPES
Dating of Geothermal Fluids Time elapsed between Recharge. Discharge or Recharge-Sampling points (subsurface residence time) – 3 H method – 3 H-3 He method
TRITIUM (3 H) 3 H = radioactive isotope of Hydrogene (with a short half-life) 3 H forms Ø Reaction of 14 N isotope (in the atmosphere) with cosmic rays 14 N 7 + n 31 H + 12 C 6 Ø Nuclear testing 3 H concentration u Tritium Unit (TU) u 1 TU = 1 atom 3 H / 1018 atom H l 3 He + – Half-life = 12. 26 year – Decay constant ( ) = 0. 056 y-1 3 H
3 H – Dating Method 3 H concentration level in the atmosphere has shown large changes – İn between 1950 s and 1960 s (before and after the nuclear testing) – Particularly in the northern hemisphere Before 1953 : 5 -25 TU In 1963 : 3000 TU
3 H – Dating Method 3 H-concentration in groundwater < 1. 1 TU Recharge by precipitations older than nuclear testing 3 H-concentration in groundwater > 1. 1 TU Recharge by precipitations younger than nuclear testing N=N 0 e- t 3 H= 3 H e- t 0 3 H (before 0 1963) 10 TU = 0. 056 y-1 t = 2003 -1963 = 40 years 3 H 1. 1 TU
3 H – Dating Method APPARENT AGE 3 H= 3 H e- t 0 3 H = measured at sampling point 3 H = measured at recharge point 0 (assumed to be the initial tritium concentration) = 0. 056 y-1 t = apparent age
3 H 3 He – Dating Method 3 He = 3 H 0 – 3 H (D = N 0 -N) 3 H= 3 H e- t (N = N 0 e - t) 0 3 H = 3 H e t 0 3 He = 3 H e t - 3 H = 3 H (e t – 1) t = 1/ * ln (3 He/3 H + 1) 3 He & 3 H – present-day concentrations measured in water sample
Geothermometry Applications Isotope Fractionation – Temperature Dependent Stable isotope compositions utilized in Reservoir Temperature estimation Isotope geothermometers – Based on: isotope exchange reactions between phases in natural systems (phases: watre-gas, vapor-gas, water-mineral. . . ) – Assumes: reaction is at equilibrium at reservoir conditions
Isotope Geothermometers 12 CO 13 CH = 13 CO + 12 CH (CO gas - methane gas) + 2 2 4 CH 3 D + H 2 O = HDO + CH 4 (methane gas – water vapor) HD + H 2 O = H 2 + HDO (H 2 gas – water vapor) S 16 O 4 + H 218 O = S 18 O 4 + H 216 O (dissolved sulphate-water) 1000 ln (SO 4 – H 2 O) = 2. 88 x 106/T 2 – 4. 1 (T = degree Kelvin = K )
Isotope Geothermometers Regarding the relation between mineralization and hydrothermal activities – Mineral Isotope Geothermometers Based on the isotopic equilibrium between the coeval mineral pairs Most commonly used isotopes: S-isotopes
Suphur (S)- Isotopes 32 S = 95. 02 % 33 S = 0. 75 % 34 S = 4. 21 % 36 S = 0. 02 % (34 S/32 S)sample- (34 S/32 S)std. 34 S ( ) = ---------------------- x 103 (34 S/32 S)sample Std. = CD =S-isotope composition of troilite (Fe. S) phase in Canyon Diablo Meteorite
S-Isotope Geothermometer 34 S = 34 S(mineral 1) - 34 S(mineral 2) 34 S = 34 S= A (106/T 2) + B