Genome Sequence Informatics Comparative Genome Sequence Analysis Niclas


 Alignment of DNA to protein (or HMM) allowing for splicing")


 have very low information content")


 • Coding sequences generally well conserved • Non-coding")


")
")

 • Graphical dot plot program for detailed comparison of two")
 • DNA Block Aligner • Finds co-linear blocks with")


 Genome Research 7: 315")


 Genome Research 7: 315")


- Slides: 75
Genome Sequence Informatics & Comparative Genome Sequence Analysis Niclas Jareborg Astra. Zeneca R&D Södertälje
Genome sequencing projects • Aim: Better understanding of biology • Bioinformatics • Manage data • Cut corners • Generate and test new hypotheses • Make the most of the data • comparative analysis
gttaaaattcagcagaatgaaaatgtcaataattttttattt taaaatattcatgttttactattttgatataatttttaaagaaaaaggca gaaaccactgcttattagaaggcagattttattgattttatacccctaga Where are the functional elements? cttgttgcatatcaaacctatgtaaaaacatctataaatcattaa ttgcacctagtataataattctatatatggaggtaatgtttgattcttca ggagctttaataacttgaagcccgtttgattgctttaaaatgatttctca ttgtatttgtttatattgtatcattaagcaaaagtacagagtaagcaatt agtgtgattaattcctcttccataatacagtaaagcactgcctccataga ccaattctctgggatccctggaaaacatctggcatccagcaagtcttgac ccctctttagaaagccatggagaaactggaggcaattctgttaattattt gccctctagaggcaattgggttaattacccttccctatccatgaca caatttctccagttacatgtagaatgctgttatgtgtctcctgaccagac cccttatttcatagatgtggaaactgaggccatgaaggatgaggtgactg ttcacaatccacatggctagtgtccagagcctggacttctc tcttgttctggggccttgagttctctccctcttctttagtacatatggcc acaggtaacgtaatctgcgtaccacatttggagtgcatctgttt tgcatttaatcttgttgagatggtttgcttgttgacctactcagtc agttatcttttcacctttgtgagttgagagctttgtgtattaaatctgta aaactttgcatcgtggaaagtgacataatctgtagcagacccatgctgtt
Features in genome sequences • Genes • Exons, introns, promoters • RNA genes • Cp. G islands • Enhancers • Other functional elements • e. g. Replication origins, Nuclear matrix association • Repeats
How to find genomic features • Repeats, Cp. G islands, RNA gene • Bioinformatics programs • Genes • Homology to known sequences • Bioinformatics prediction programs • Transcription regulatory regions • Bioinformatics prediction programs
Finding genes by homology • Database searches – BLAST, BLAT, SSAHA • EST and c. DNA sequences • Protein sequences High accuracy, misses unknown sequences • caveat: junk EST sequences
Genewise (Birney & Durbin) Alignment of DNA to protein (or HMM) allowing for splicing Uses dynamic programming with extra states for introns
-20 bp pkinase. hmm HSU 71 B 4 1 YELGEKLGEGA GKVYKAKHK---TGKIVAVKILKKESLSLL REIQI ++ LG + G+ Y+A + ++I+ + +K + + + E+ + INIKNLLGGDT GCLYMAPKVQATKQQIYKLCFIKIKTFVLQ TELNL -27753 aaaaactggga. GTGTGAGTA Intron 1 CAGTgtttagcagcgaaccatatttaaaaatgcc. AGGTCACTA Intron 2 CAGGagcac tataattggac <2 -----[27718: 22469]-2> ggtatccataccaaataatgttatacttta <2 -----[22375: 21185]-2> catat atcatggtata acatgaaaaattagcctaaattgta tacct - 6 bp +3 bp 45 LKRLN-HPNIVRLLGVFED-----SKDHLY LVLEYMEGGDLFDYLRRKG--PLSEKEAKKIALQILR L++++ H+NIV ++G+F L+ +V+E++ G+ D++R+ L E+++ +I ++IL+ LRKYSFHKNIVSFYGAFFKLSPPGQRHQLW MVMELCAAGSVTDVVRMTSNQSLKEDWIAYICREILQ -21168 caatttcaaagtttggttacaccgccccct. GTATGTT Intron 3 CAGagagttgggtgagggaaaaacataggtagtatcgacc tgaactaaattctagcttatgccgagaatg<0 -----[21078: 15667]-0>tttatgccgctcattgtcgaagtaaagtcatggatta gggctccactgcctaatcggtcttggcatg ggggataatgcttagagcttgtaaatgtttccaactg 104 - 66 bp - 8 bp +12 bp - 1 bp GLEYLHSNGIVHRDLKPENILLDENGTVKI DFGLAKLLK-SGEKLTTFV GL++LH ++++HRD+K +N+LL++N VK+ DFG++++++F+ GLAHLHAHRVIHRDIKGQNVLLTHNAEVKL DFGVSAQVSRTNGRRNSFI -15555 GTGAGTC Intron 4 CAGgtgcccgccgaagcagccacagggac. GGTAAGTT Intron 5 CAGTTgtggagcgaaaata <0 -----[15555: 14066]-0>gtcatacagttagaatttcaacatat <1 -----[13974: 10915]-1> atgtgcatggcagggagtt catctcacaatcgccatgtgggttttaaag ttagtcggcattaagttct 0 bp - 3 bp -1 bp +2 bp 153 GTPWYMMAPEVILKG-----RGYSTK VDVWSLGVILYELLTGKL FPG-D GTP++M APEV + R Y+ + +DVWS+G++ +E++ G + + GTPYWM-APEV-IDCDEDPRRSYDYR SDVWSVGITAIEMAEGAP LCNLQ -10855 gactta gcgg agtgggcacttgta. GTGAGTG Intron 6 CAGaggttggaagagaggggc. CGTGAGTA Intron 7 CAGCTctacc gccagt ccat tagaaacggcaaag<0 -----[10783: 8881]-0>gatgctgtcctatcagcc <1 -----[8825 : 4234]-1> tgata gaacgg atgg tcttgcaaccttca ttggtgattctagtaact gtcta +1 bp 196 PLEELFRIKKRLRLPLPPNC SEELKDLLKKCLNKDPSKRPTAKELLEHPW PLE+LF I+++ ++ S+ + +++KC K+ RPT +L+HP+ PLEALFVILRESAPTVKSSG SRKFHNFMEKCTIKNFLFRPTSANMLQHPF -4214 ctggctgatcgtgcagatag. TGGTAAAGA Intron 8 TAGGtcatcatagataaaatctccatgaacccct ctactttttgacccctacgg <2 -----[4154 : 3085]-2> cgataattaagctaatttgccccattaact cgatccttggattcacacca ctgcctcgagtgaatcgtttttacgtacat
Gene prediction methods • • • ATGs Stop codons ORFs Coding preference Splice sites easy hard • profiles, statistical methods, neural networks etc. High coverage, low accuracy
Accuracy of gene-finding programs for 1. 4 MB genomic region BRCA 2 on human chromosome 13 q Region includes 159 true exons fgenesh. masked fgenesh fgenes. masked fgenes genscan fgeneh mzef NE 169 190 238 281 292 381 623 fgeneshm+genescan fgeneshm+fgenes 118 89 exact N acc 110 0. 65 109 0. 57 103 0. 43 104 0. 37 105 0. 36 68 0. 18 95 0. 15 match cov 0. 69 0. 65 0. 66 0. 43 0. 60 97 0. 82 0. 61 83 0. 93 0. 52 overlap N acc 125 0. 74 126 0. 66 132 0. 55 136 0. 48 129 0. 44 101 0. 27 122 0. 20 exons cov 0. 79 0. 83 0. 86 0. 81 0. 64 0. 77 106 0. 90 0. 67 86 0. 97 0. 54 5'N 118 117 114 116 79 106 splice site acc cov 0. 70 0. 74 0. 62 0. 74 0. 48 0. 72 0. 41 0. 73 0. 40 0. 73 0. 21 0. 50 0. 17 0. 67 101 0. 86 0. 64 86 0. 97 0. 54 3'N 116 117 118 120 115 87 107 splice site acc cov 0. 69 0. 73 0. 62 0. 74 0. 50 0. 74 0. 43 0. 75 0. 39 0. 72 0. 23 0. 55 0. 17 0. 67 101 0. 86 0. 64 83 0. 93 0. 52 acc - specificity (true predicted/all predicted) cov - sensitivity (true predicted/true) NE - number of predicted exons data provided by Tim Hubbard and Richard Bruskiewich (Sanger Centre)
Repetitive elements 1/3 of the human genome • Transposable elements • LINEs (Long Interspersed Nuclear Elements), 6 -8 kb • SINEs (Short Interspersed Nuclear Elements, e. g. Alu), 100400 bp • Retrovirus-like elements, 1. 5 -10 kb (LTRs 300 -1000 bp) • DNA transposons, 80 bp-3 kb • Tandem repeats • Simple repeats/Microsatellites (1 -5 bp)n, e. g. caacaacaa • Minisatellites (6 -1000 s bp)n • Low complexity regions •
Repeat masking • Repeats disturb analysis • Homology searching • Gene prediction • Masking exchange repeat region with N's. Will be ignored by analysis programs • Repeat. Masker (Smit & Green) • LINEs, SINEs, LTR transposons, DNA transposons, Simple repeats, Low complexity regions • trf (Benson) • Tandem repeats
Predicting regulatory regions • Transcription Factor Binding Sites (TFBSs) have very low information content • Given a long enough sequence a binding site will be predicted • Combination of TFBSs • Even the best algorithms will overpredict
Cp. G islands • Associated with transcribed genes • House keeping genes + ~50% of other genes • Often in 5' ends of genes • >200 bp • GC content >50% • obs/exp Cp. G >0. 6
Gene Ontology “Biologists would rather share a toothbrush than a gene name” - Michael Ashburner • “Controlled vocabulary that can be applied to all organisms even as knowledge of gene and protein roles in cells is accumulating and changing. ”
Gene Ontology • Organizing principles • Molecular function • Biological process • Cellular component • Hierarchical structure
Genome resources • Genome sequence centered • Ensembl • http: //www. ensembl. org • NCBI • http: //www. ncbi. nlm. nih. gov • UCSC Human genome browser • http: //genome. ucsc. edu • All based on NCBI assembly • Gene centered • SOURCE • http: //source. stanford. edu • Gene. Lynx • http: //www. genelynx. org • Gene. Cards • http: //bioinformatics. weizmann. ac. il/cards/
Ensembl
Ensembl – Map view
Ensembl – Contig view
Ensembl – Contig view
Ensembl – Gene view
Ensembl – Gene view
Ensembl – Gene view
NCBI Genome resources
NCBI Map View
NCBI Locus Link
NCBI Sequence view
UCSC – Genome browser
UCSC – Genome browser
UCSC – Genome browser
Gene-centered resources • • • Genomic resources Transcripts Protein sequences Protein structure and domains Protein function and disease links Homologs Functional/GO classifications Physical clones etc
Comparative Genomic Sequence Analysis • Aid in finding functional regions • Coding regions • Regulatory regions
Comparative Genomic Sequence Analysis • Compare corresponding genomic sequences from different species • Potential protein coding and/or regulatory regions can be identified by their conservation • “Phylogenetic footprinting”
Why it works
Synteny maps • Maps corresponding regions in different genomes • Large-scale relationships • Based on • genetics • sequence • Available for • Human vs. • • • Mouse Rat Dog Chimp etc… Mouse vs Rat
Ensembl synteny views • Protein sequence based
NCBI comparative maps • Based on genetics • Several genetic maps
Human/vertebrate sequence comparisons (80 -450 Myrs) • Coding sequences generally well conserved • Non-coding regions show highly variable levels of conservation • Conservation of non-coding regions imply a functional role • • • promoters other transcriptional regulators replication origins chromatin condensation matrix association
Model organisms for vertebrate comparative analysis Not too evolutionary close • Impossible to identify functional regions through conservation • Mouse 3000 Mb 80 Myrs w Genetics w Sequence ”finished” • Chicken 1200 Mb 300 Myrs w Micro-chromosomes (~75% of genes) w Prioritized for sequencing • Fugu (Puffer fish) 400 Mb 450 Myrs w Small genome, shorter introns and intergenic regions w More or less the same gene content as higher vertebrates w Sequence finished •
What are we comparing? • Homologue • common ancestor, may have similar function • Orthologue • the “same” sequence, generated by a speciation event, probably same function • Paralogue • similar sequence within species, generated by a gene duplication event, may have similar function
Globins (I)
Globins (II)
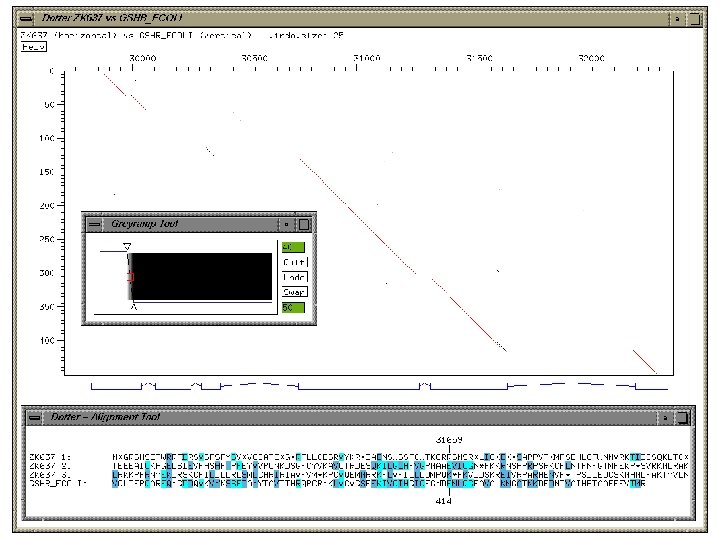
Finding conserved regions • Dot plot • Dotter • Similarity search programs • Blast • Alignment programs • • • DBA (Jareborg et al) blastz (Schwartz et al. ) Dialign (Morgenstern et al. ) WABA (Kent & Zahler) Avid (Bray et al. ) others
Dotter (Sonnhammer & Durbin) • Graphical dot plot program for detailed comparison of two sequences • Features • • • dynamic greyscale ramp for stringency cut-off alignment viewer zooming. • Unix & Windows • http: //www. cgb. ki. se/cgb/groups/sonnhammer/Dotter. html
DBA (Jareborg, Birney & Durbin) • DNA Block Aligner • Finds co-linear blocks with high similarity • Does not try to align the sequences between these blocks • Divides blocks into four different categories • approx. 60 -70%, 70 -80%, 80 -90%, 90 - 100%
Comparison-based functional prediction • Gene prediction • Regulatory region predictions
”Comparative” gene prediction programs • Twinscan • Doublescan • SGP-1 http: //genes. cs. wustl. edu/ http: //www. sanger. ac. uk/Software/analysis/doublescan/ http: //195. 37. 47. 237/sgp-1
Regulatory region prediction • Consite • Detection of TFBS conserved in corresponding genomic sequences from different species www. phylofoot. org/consite
Con. Site
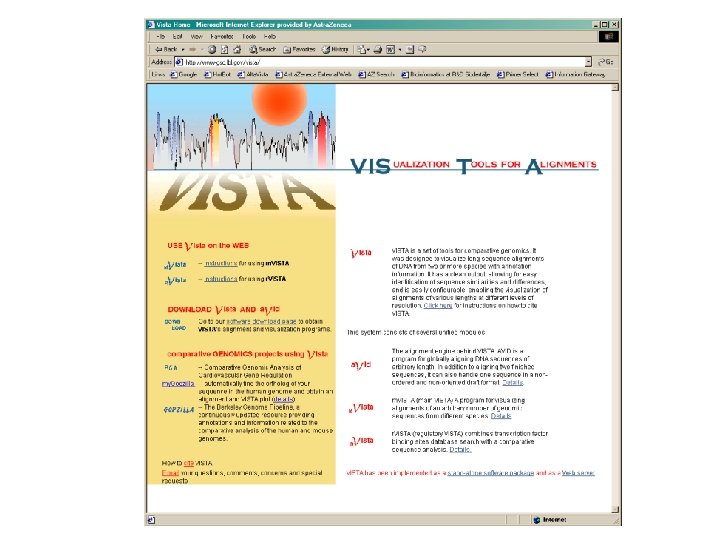
Visualisation • Easier to grasp large data volumes • Programs • Dot plot (e. g. Dotter) • PIP • Alfresco • VISTA • Genome comparative resources • VISTA genome browser • UCSC • Ensembl
PIP - Percent Identity Plot Oeltjen et al. (1997) Genome Research 7: 315
Alfresco Tool for comparative genome sequence analysis • Over-all control of comparative analysis • Display and summarize results from external analysis programs Jareborg & Durbin Genome Research 10: 1148– 1157
Alfresco Features • Interactive graphical interface • Uses external programs for analysis • • Dotter - interactive dotplot program Blastn alignments - finds conserved blocks DBA - detects and aligns conserved blocks Cpg - detects Cp. G islands Repeat. Masker - identifies repeats Genscan - gene prediction Gene. Wise - gene prediction using homologous protein sequence est_genome - gene prediction using homologous RNA sequence
Alfresco
Vista Genome Browser • Human – Mouse - Rat comparisons • VISTA viewer • http: //pipeline. lbl. gov/
VISTA genome browser
UCSC Genome browser • Human - Mouse • Twinscan predictions • Conservation profiles • Quantitative
Ensembl contig viewer • Human-Mouse match locations • Qualitative • Twinscan predictions • Move between Human and Mouse contig views
Comparative Analysis Examples • Interspecies non-coding regions conservation • Coding region predictions • Regulatory region predictions
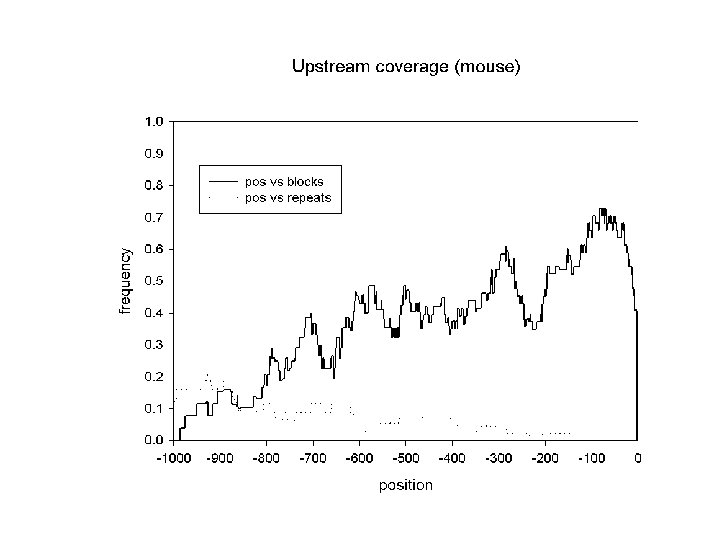
Comparative Analysis of Noncoding Regions of 77 Mouse and Human Gene Pairs Jareborg, Birney, and Durbin. (1999) Genome Research 9: 815 • How conserved are non-coding regions between mouse and human? • Measure of conservation? • % identity • fraction conserved
A “typical” intron
mouse/human data set • Genomic sequences from the EMBL database containing 78 pairs of mouse-human orthologous genes • Features as defined in feature tables • Corresponding features aligned with DBA: • Fraction covered by blocks >60 % identical: • Upstream regions: 36 % • 5’ UTRs: 49 % • Introns: 23 % • 3’ UTRs: 56 % • Sizes: Jareborg, Birney & Durbin. Genome Research 9: 815 -824 • 20 - 700 bp
Analysis example - coding region prediction UTY
Analysis example - cont.
Analysis example - Regulatory regions • BTK - Bruton’s Tyrosine Kinase • agammaglobulinemia • Expression • early stages of B-cell differentiation • myeloid cell lines • not in T cells
BTK region PIP Oeltjen et al. (1997) Genome Research 7: 315
Alfresco - BTK 5’end
Promoter constructs T-cell B-cell myeloid 2. 5 kb conserved region in first intron contributes to cell-lineage specific expression Oeltjen et al. (1997) Genome Research 7: 315
Comparative Analysis Issues for the future • Faster/better algorithms for aligning vertebrate genomes • Multiple alignments • Comparing several species can give clues to which regulatory sequences are of a basic nature, and which are lineage specific • Cataloguing of comparative data • Better visualisation • Whole syntenic region <> nucleotide level • Multiple genome sequences
Future Issues - cont. • Genome evolution • macro scale • molecular evolutionary rates • repeats • Transcriptional regulatory regions • definition/modelling • identification of combinations of conserved TFBSs coupled with gene expression data • prediction
Fin