GENETICS AND MOLECULAR BIOLOGY FOR ENVIRONMENTAL ANALYSIS MOLECULAR

GENETICS AND MOLECULAR BIOLOGY FOR ENVIRONMENTAL ANALYSIS MOLECULAR ECOLOGY LESSON 13: CONSERVATION GENETICS Prof. Alberto Pallavicini pallavic@units. it

THE NEED FOR CONSERVATION Biodiversity quite simply refers to all of the different life forms on our planet, and includes species diversity and genetic diversity.

Around 96% of all extinctions have occurred at a fairly constant rate, creating what is known as the background extinction rate. This has been estimated from the fossil record as an average of 25% of all living species going extinct every million years

THE FIVE MAJOR EXTINCTIONS.

THE NUMBERS OF SPECIES EXTINCTIONS THAT HAVE BEEN RECORDED OVER THE PAST 400 YEARS Taxonomic group Number of extinctions Percentage of taxonomic group Mammals 85 2. 1 Birds 113 1. 3 Reptiles 21 0. 3 Amphibians 2 0. 05 Fish 23 0. 1 Invertebrates 98 0. 01 Flowering plants 384 0. 2

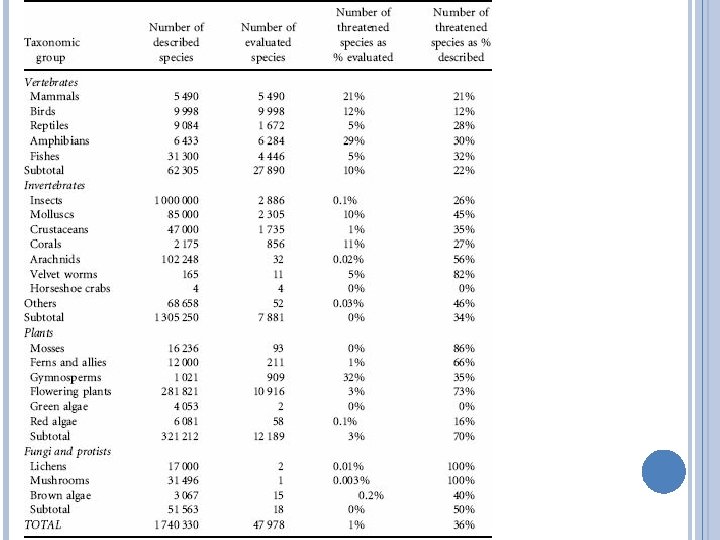
IUCN RED LIST We know little about the total proportion of threatened species simply because we lack the relevant information for most species. For example, 32% of fishes that have been evaluated are classified as threatened, but because only around 5% (4446 species out of an estimated 31 300 species) of all fish species have been assessed, this value gives us limited insight into the status of fishes as a whole.

WHY ARE SO MANY SPECIES THREATENED WITH EXTINCTION? In most cases, the answer to this is anthropogenic activity. Farming, logging, mining, damming and building have destroyed the habitats of countless species around the world. Many endemic species have suffered from humanmediated introductions of alien species, both deliberate and accidental. Hunting, fishing and trading have led to the overexploitation of many species, while countless others have suffered from industrial or agricultural pollution

TAXONOMY Taxonomy is the science that enables us to quantify biodiversity, although its applications extend much further than this because without it our understanding of ecology and evolution would be greatly reduced: put simply, species are the fundamental units of biology.

Problem 2: Lack of agreement on what “species” means.

SPECIES CONCEPTS More than 20 different species concepts can now be found in the literature. biological species concept (BSC) phylogenetic species concept (PSC). The phylogenetic species concept defines a species as a group of organisms that shares a common ancestor and can be distinguished from other organisms that do not share that ancestor

Defining what species are is a complex task Dependent on many factors Canis lupus (familiaris) • Interbreeding capabilities • Morphological variation • Ecological context • Genetic similarities Anas platyrhynchos

Problem 3: Current taxonomic methods may be insufficient.

Classical taxonomy uses terminology that can act as a barrier to understanding and reduce the number of persons qualified to describe biodiversity Leaves alternate proximally, opposite and ultimately decussate distally, 6– 16 × 4– 13 cm; petiole ca. as long as blade, winged, base clasping, basal lobes stipulate, growing as extensions of wings, less than 1 mm wide; blade 5– 7 -veined, ovate, glabrous, base typically sagittate, margins entire, apex acute to acuminate. Staminate inflorescences axillary, 1– 2 per axil, paniculate, fasciculate; panicles bearing flowers singly, bracteolate, in a zigzag pattern along rachis, internodes less than 2 mm; rachis to 25 cm, secondary axes 1– 3(– 6), fasciculate, less than 3 cm, each subtended by deltate-ovate bracteole shorter than 1 mm. Pistillate inflorescences solitary, 4– 8(– 20)-flowered, 6– 35 cm, internodes ca. 1 cm The body form ranges from hemispherical (e. g. , Cleidostethus) to elongate oval (e. g. , Clypastraea) to latridiid-like (e. g. , Foadia). Corylophids are typically dull brown, but some species have contrasting yellowish-brown patches on the pronotum or elytra. The integument is often densely punctured and may be glabrous or bear short, fine recumbent setae. Most corylophid adults can be diagnosed using the following morphological features: Maxilla with single apical lobe; Mesotrochanter short and strongly oblique; Head usually covered by pronotum; Frontoclypeal suture absent; Antennae elongate with 3 -segmented club; Procoxal cavities closed externally; Tarsal formula 4 -4 -4; Pygidium exposed . Adding to the complexity, if the specimen to be identified is immature in its development or damaged and incomplete, identification may be impossible

Using DNA can help clarify identity of different looking life forms, as well as provide the resolution that allows to differentiate species that appear identical, yet aren’t.

DNA BARCODING A more recently established approach to taxonomy seeks to identify species solely on the basis of a DNA barcode (or genetic barcode), which consists of one or a few DNA sequences. Barcoding is founded on the premise that variation in the barcoding gene is lower within species than between species.

Leaves alternate proximally, opposite and ultimately decussate distally, 6– 16 × 4– 13 cm; petiole ca. as long as blade, winged, base clasping, basal lobes stipulate, growing as extensions of wings, less than 1 mm wide; blade 5– 7 -veined, ovate, glabrous, base typically sagittate, margins entire, apex acute to acuminate. Staminate inflorescences axillary, 1– 2 per axil, paniculate, fasciculate; panicles bearing flowers singly, bracteolate, in a zigzag pattern along rachis, internodes less than 2 mm; rachis to 25 cm, secondary axes 1– 3(– 6), fasciculate, less than 3 cm, each subtended by deltateovate bracteole shorter than 1 mm. Pistillate inflorescences solitary, 4– 8(– 20)-flowered, 6– 35 cm, internodes ca. 1 cm Complex and subjective >Dioscorea alata (mat. K) gene, partial ATTTAAATTATGTGTCAGATATATTAATACCCCATCCATCTGGAAATCCTGGTTCAAATACTTCAATGCTGGACTCAAGATGTTTCCTCTT TGCATTTATTGCGATTCTCCACGAATATCATAATTCGAAT AGTTTCATTACTCCGAAAAAACCTATTTACGTGATTTCAAAAGAAA ATAAAAGATTTTTTCGAT TCCTATATAATTCTTATGTATTTGAATGTGAATTTGTATTAGTTTTCATAAGCAATCCTCTTATTT ACGATCAA GGTCCTCTGGAGTCTTGAGCGAACACATTTCTATGGAAAAATGGGGCATTTTTTAGTAGTGTGTTGTAATTATTTTCAGAAGACCCAATG GTTCTTCAAAGATCCTTTTCTGCATTATGTTCGATATC AAGGAAAAGCAATTCTGGTGTCAAAGGGAACTCGTCTTTTGATGAGGAAATGGAGA TCTTACCTTGTCCATTTTTGGCAATATTATTTTCAATTTTGGTCTCATCCGCATAGGATTCATATAAACCAATTATCAAATTATTCCTTCTGTTTTC TGGGTTATCTTTCAAATGTACTAATAAATTTTTCCGTGGTAAGGAGTCAAATGTTAGAAAATTCATTTGTAATAGATACTCTTACTAAGAAATT TGATACCAGAGTTTCAGTTATTGCTCTTATTCG ATCATTGTCTAAAGCGAAATTTTGTACCGTATCCGGGCATCCTATTAGTAAGTCAATATGGA CAAATTTC TCAGATTTGGATATTATTCATCGATTTGGATATGTAGAA Simple (A, T, G, or C), objective

Choosing a DNA barcode Several criteria go into selecting a DNA region that can serve as a barcode locus, including: • Discriminatory • Unique for species, identical for species members • Universal • Occurs in all species to be examined • Robust • Can be amplified by PCR, using a small number of primers

Candidates Fail: Sequence is completely conserved, good for PCR, but uninformative as barcode Fail: Sequence shows no conservation, impossible for PCR, but good as barcode Win: Sequence shows some (ideally ~70%) conservation, good for PCR, good as barcode

A GOOD DNA BARCODE

DNA Barcoding Plants vs. Animals The Consortium for the Barcode of Life recommended to use the mitochondrial gene for Cytochrome Oxidase I, COI, as universal barcode for animals. Caveat: As any other potential DNA barcode locus, COI also entails the possibility of failure. Barcoding specific animals for which COI does not work may therefore require newly identifying an appropriate barcoding locus.
 is an international")
WHO IS ADVANCING BARCODING? CONSORTIUM FOR THE BARCODE OF LIFE (CBOL) is an international initiative devoted to developing DNA barcoding as a global standard in taxonomy. CBOL is a collaboration of natural history museums, herbaria, biological repositories, and biodiversity inventory sites, together with academic and commercial experts in genomics, taxonomy, electronics, and computer science. CBOL has more than 100 institutional members in 40 countries.

The Consortium for the Barcode of Life recommended to use the chloroplast genes rbc. L and mat. K as universal plant barcodes. Caveat: As any other potential DNA barcode locus, rbc. L and/or mat. K entail the possibility of failure. Barcoding specific plants for which rbc. L and/or mat. K do not work may therefore require newly identifying an appropriate barcoding locus.

DNA Barcoding Plants vs. Animals Plants Animals Rbc. L Mat. K COI

Contributing to Big Science

DNA Barcoding: The Works • Extract DNA • Amplify barcoding locus • Sequence barcode • Analyze sequence

CAVEATS Although increasingly widely used, DNA barcoding is not without controversy. Critics have pointed out that the range of intraspecific sequence divergence can be difficult to predict. Other researchers have highlighted potential issues surrounding the sample sizes on which DNA barcodes are typically based.

Although barcoding is not perfect we can argue that the same can be said for taxonomic delineations that are made on the basis of morphological characteristics; limitations of morphology are particularly evident in (but not limited to) cryptic species, cryptic life stages (e. g. beetle larvae), and microbial species that require (but will not always be amenable to) culturing prior to identification.
 mitochondrial region Herbert et")
Taxonomic group Gene region Reference Animals Cytochrome oxidase I (COI) mitochondrial region Herbert et al. (2003) Plants Two chloroplast regions, rbc. L and mat. K CBOL Plant Working Group (2009) Plants Second internal transcribed spacer (ITS 2) of Chen et nuclear ribosomal DNA al. (2010) Arbuscular mycorrhizal fungi Nuclear r. DNA (1500 bp fragment spanning Stockinger et small subunit, ITS region, and large subunit) al. (2010) Red algae Cytochrome oxidase I (COI) mitochondrial region Robba et al. (2006) Microbial eukaryotes Small subunit nuclear r. DNA Huber et al. (2007) Bamboo corals Mitochondrial regions: mismatch repair gene van der homologue (msh 1) and intergenic region Ham et (igr 4) between cyt b and NADH 6 al. (2009)

CONSERVATION UNITS In an attempt to circumvent some of the problems that may be associated with taxonomic classification, conservation biologists sometimes concentrate on: management units (MU) and evolutionarily significant units (ESU).

CONSERVATION UNITS An MU is ‘any population that exchanges so few migrants with others as to be genetically distinct from them’ (Avise, 2000), and is analogous to the stocks that are identified in fisheries. Distinct MUs are often identified on the basis of significant differences in allele frequencies at multiple neutral loci.

CONSERVATION UNITS An ESU consists of one or more populations that have been reproductively isolated for a considerable period of time, during which they have been following separate evolutionary pathways. Examples of this may include lineages that diverged in separate refugia during glacial periods. ESUs have often been characterized by reciprocal monophyly in mt. DNA and significant allele frequency differences at neutral nuclear loci

CONSERVATION UNITS Non neutral markers A combination of neutral genetic data and data from the transcriptome was used to characterize conservation units of threatened Atlantic salmon, Salmo salar, around the Bay of Fundy in Canada.

Threatened populations are usually small and therefore lose genetic diversity at a relatively rapid rate following genetic drift. Because drift is more important than selection at determining the fate of alleles in small populations, deleterious alleles are more likely to reach fixation and increase the genetic load

INBREEDING Small populations are susceptible to inbreeding, and if this leads to a reduction in fitness as a result of either dominance or overdominance, then the population will experience inbreeding depression. In a diploid species, inbreeding increases the likelihood that an individual will have two alleles that are identical by descent at any given locus, and it therefore has the effect of increasing homozygosity at all loci.

INBREEDING COEFFICIENT F inbreeding accumulates at a rate that is inversely proportional to the size of the population
 of five populations of")
The increase over time in the inbreeding coefficients (F) of five populations of different sizes

INBREEDING AND GENETIC DIVERSITY Inbreeding threatens the survival of small populations when it leads to a reduction in fitness, a phenomenon that is known as inbreeding depression.

OUTBREEDING DEPRESSION Inbreeding depression is not the only possible deleterious outcome of mating between individuals with suboptimal levels of relatedness; another potential threat comes from outbreeding depression

LOSS OF LOCALLY ADAPTED GENOTYPES If individuals from two populations that are each adapted to their natal environments hybridize, their offspring will contain a mixture of alleles that may not be well suited to either environment. When this occurs, outbreeding depression will be evident in the first generation of offspring.

LOSS OF POSITIVE EPISTATIC INTERACTIONS. Epistasis refers to the interaction of genes from multiple loci, and their collective influence on particular traits.

GENETIC RESCUE When migrants are translocated from one population to another, they will often introduce new alleles into the recipient population. If this results in a reduction of inbreeding depression, it is known as genetic rescue Genetic rescue will increase the growth rate of a population over multiple generations from the time when the novel genes were introduced. This is usually attributed to heterosis, which is elevated fitness in the offspring of genetically divergent individuals (sometimes known as hybrid vigour).

TRANSLOCATIONS AND CAPTIVE BREEDING PROGRAMMES Translocations can slow or reverse the decline of small populations through genetic rescue, although source and destination populations should be genetically compatible and founder effects should be avoided.

TRANSLOCATIONS AND CAPTIVE BREEDING PROGRAMMES Small population sizes mean that captive breeding programmes must be carefully managed so as to minimize inbreeding depression and loss of genetic diversity. Pedigree information can be used to reduce inbreeding, and Ne can be maximized if bottlenecks are avoided and variation in reproductive success (VRS) is kept as low as possible.

USEFUL WEBSITES AND SOFTWARE Consortium for the barcode of life: http: //www. barcodeoflife. org Barcode of Life data systems – includes an option to compare a sequence against their database when looking for a species match: http: //www. boldsystems. org/views/login. php IUCN – The International Union for Conservation of Nature: http: //www. iucn. org/ Bird. Life International: http: //www. birdlife. org/ American Zoo and Aquarium Association Species Survival Plan Programs: www. aza. org/species-survival-plan-program/ FSTAT – software for calculating F statistics including inbreeding coefficients: http: //www 2. unil. ch/popgen/softwares/fstat. htm Software that can be used to estimate genetic relationships among individuals: Kinship and Relatedness: http: //www. gsoftnet. us/GSoft. html ML-relate: http: //www. montana. edu/kalinowski/Software/MLRelate. htm Coancestry and MER: http: //www. zsl. org/science/research/software/ STORM – a program to test a varieof hypotheses regarding relatedness and mating patterns: http: //web. me. com/tfrasier/Frasier_Lab/STORM. html
- Slides: 45