
Genetics and Genome Evolution GGE Bioinformatics for Genomics
Genetics and Genome Evolution (GGE) Bioinformatics for Genomics Lecture series 2020 Sven Bergmann Department of Computational Biology (Sven. Bergmann@unil. ch)
Bioinformatics for Genomics Overview March 23 March 24 March 30 March 31 April 1 Lecture 1: Lecture 2: Lecture 3: Lecture 4: Lecture 5: RNA-seq & DE Clustering Biclustering CHIP-seq & Hi. C Networks
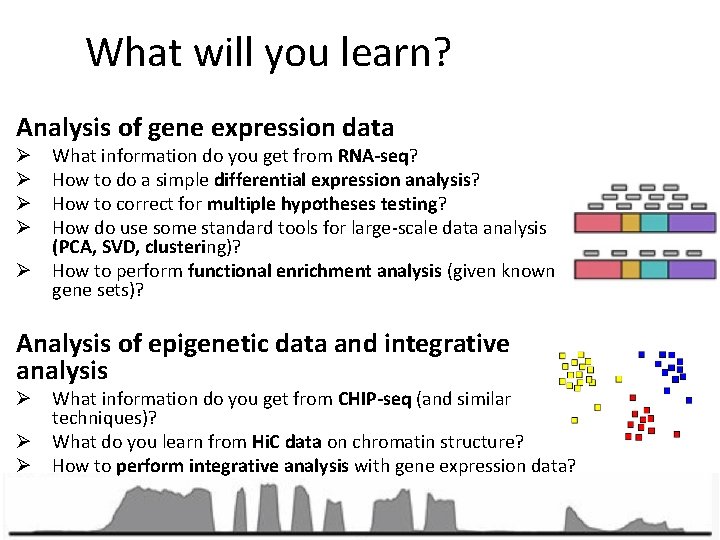
What will you learn? Analysis of gene expression data What information do you get from RNA-seq? How to do a simple differential expression analysis? How to correct for multiple hypotheses testing? How do use some standard tools for large-scale data analysis (PCA, SVD, clustering)? Ø How to perform functional enrichment analysis (given known gene sets)? Ø Ø Analysis of epigenetic data and integrative analysis Ø What information do you get from CHIP-seq (and similar techniques)? Ø What do you learn from Hi. C data on chromatin structure? Ø How to perform integrative analysis with gene expression data?

Genetics and Genome Evolution (GGE) Bioinformatics for Genomics Lecture 1: RNA-seq & DE Sven Bergmann Department of Computational Biology (Sven. Bergmann@unil. ch)
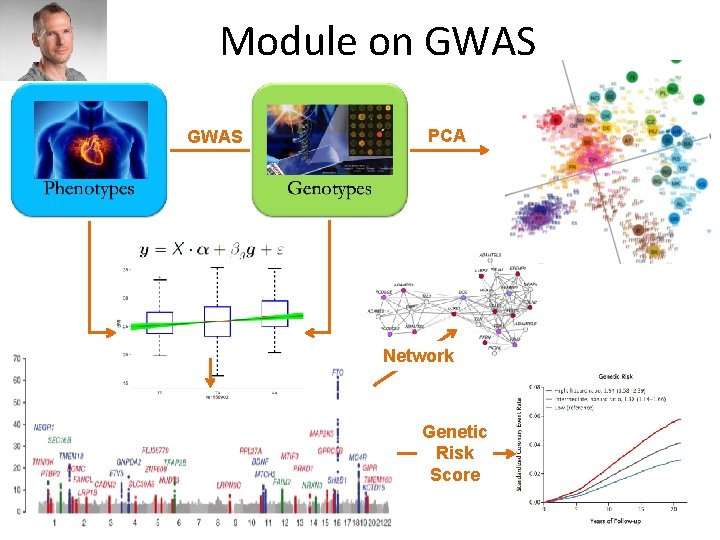
Module on GWAS PCA Network Genetic Risk Score
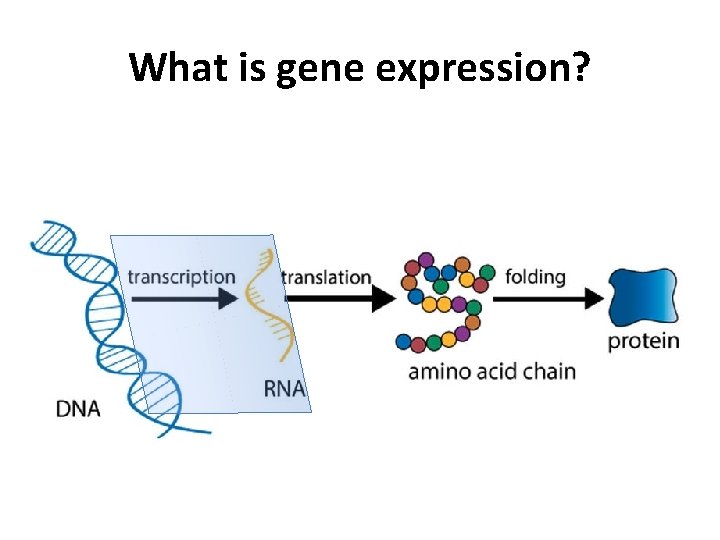
What is gene expression?
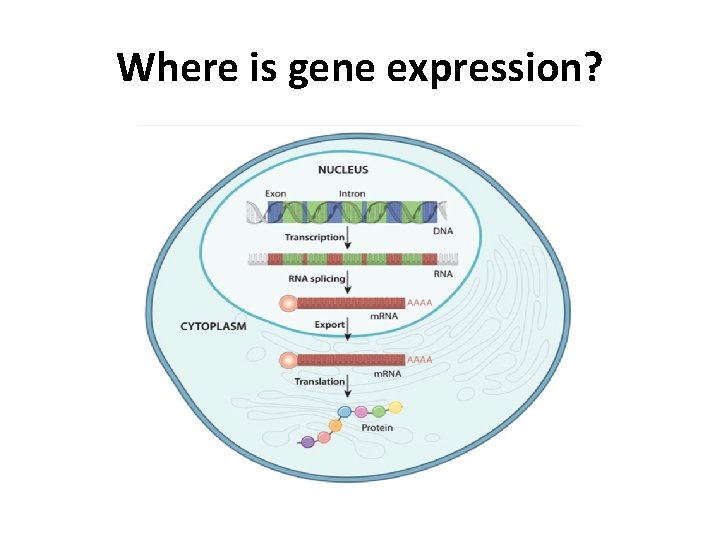
Where is gene expression?
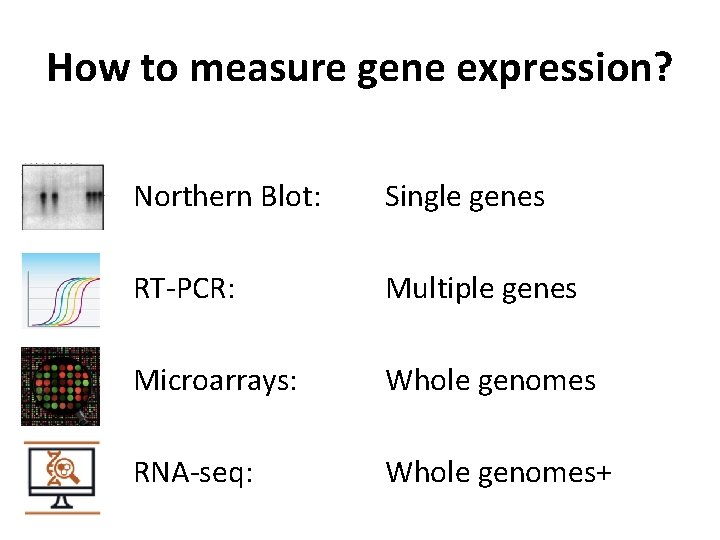
How to measure gene expression? Northern Blot: Single genes RT-PCR: Multiple genes Microarrays: Whole genomes RNA-seq: Whole genomes+
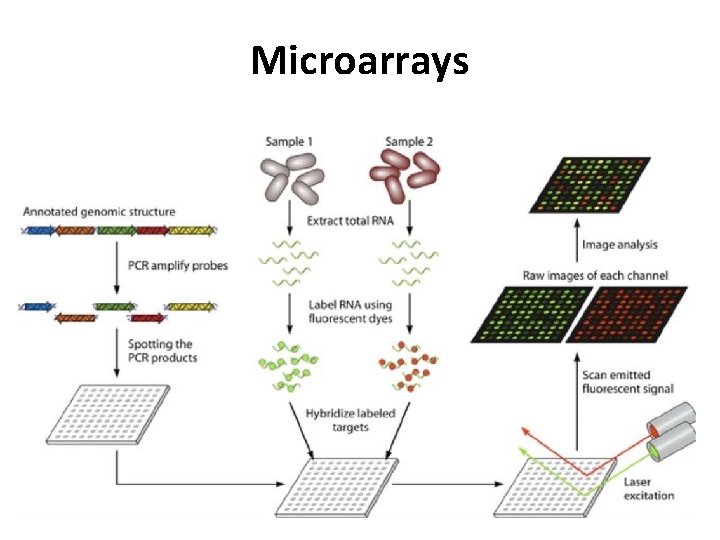
Microarrays
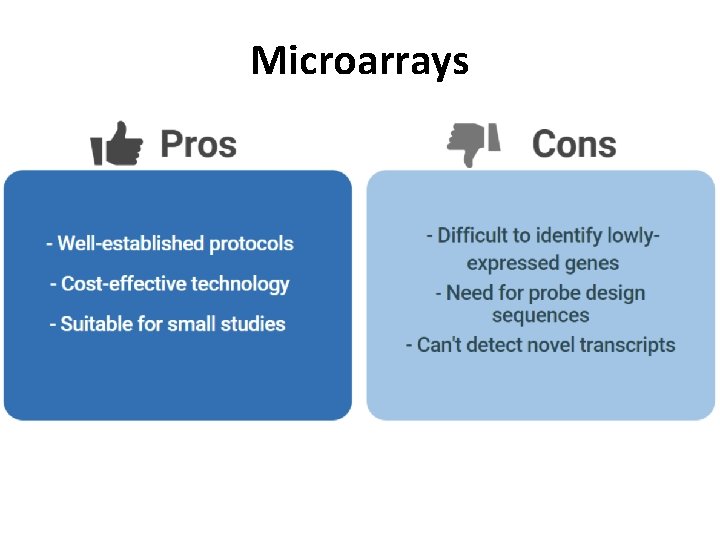
Microarrays
RNA seq RNA quantification using next generation sequencing (NGS)
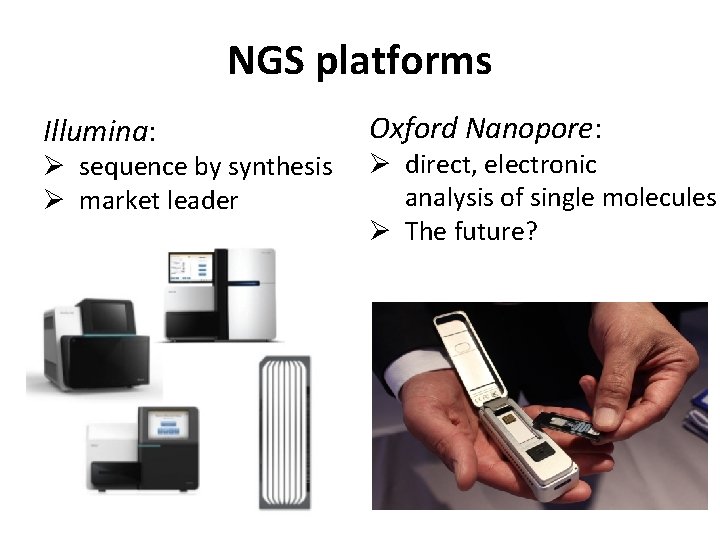
NGS platforms Illumina: Ø sequence by synthesis Ø market leader Oxford Nanopore: Ø direct, electronic analysis of single molecules Ø The future?
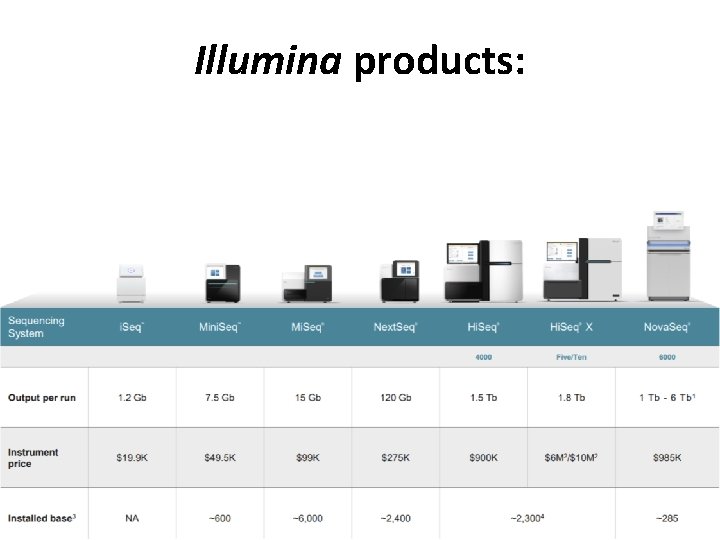
Illumina products:
Illumina procedure: Three basic steps: 1. Amplify 2. Sequence 3. Analyze
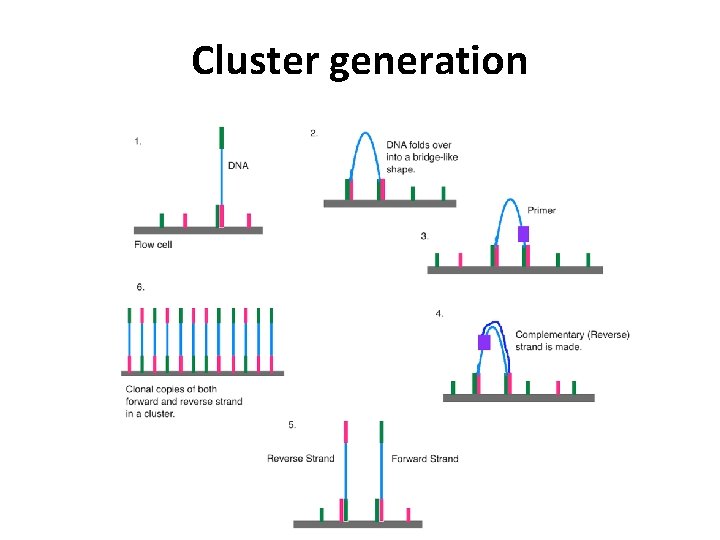
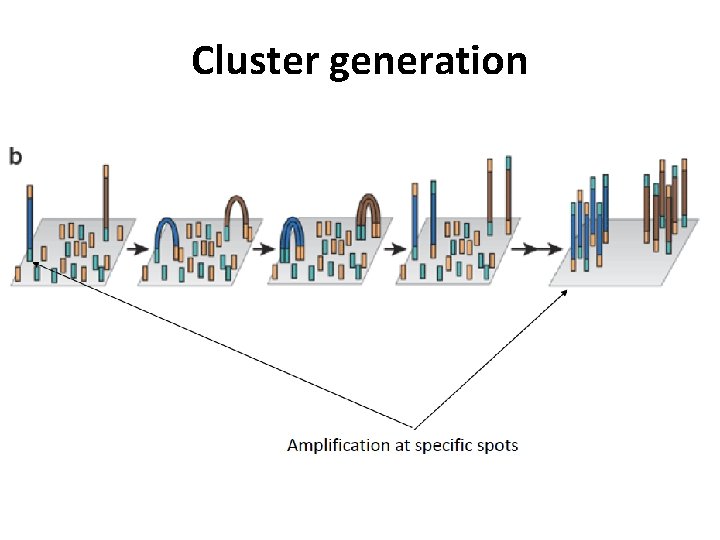
Illumina amplification: 1. The process begins with purified DNA (c. DNA when analyzing RNA). 2. The DNA gets chopped up into smaller pieces and given adapters, indices, and other kinds of molecular modifications that act as reference points during amplification, sequencing, and analysis. 3. The modified DNA is loaded onto a specialized chip (“ ”) where amplification and sequencing will take place. 4. Along the bottom of the chip are hundreds of thousands of oligonucleotides (short, synthetic pieces of DNA). 5. They are anchored to the chip and able to grab DNA fragments that have complementary sequences. Once the fragments have attached, a phase called cluster generation begins. This step makes about a thousand copies of each fragment of DNA.
Cluster generation
Cluster generation
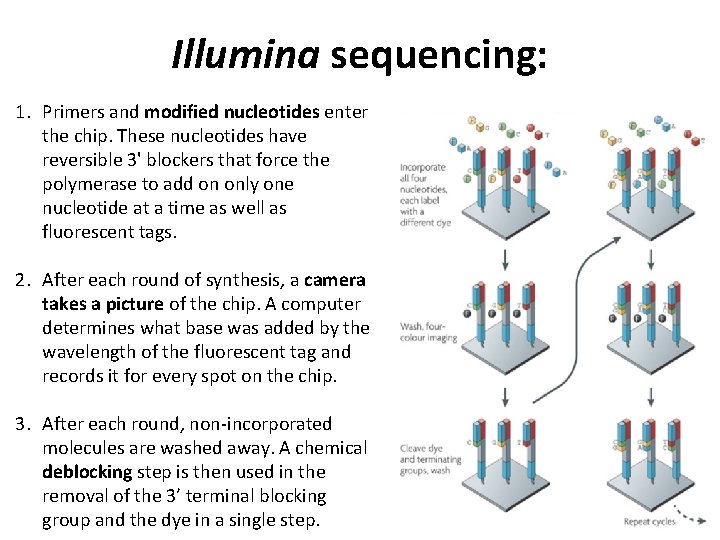
Illumina sequencing: 1. Primers and modified nucleotides enter the chip. These nucleotides have reversible 3' blockers that force the polymerase to add on only one nucleotide at a time as well as fluorescent tags. 2. After each round of synthesis, a camera takes a picture of the chip. A computer determines what base was added by the wavelength of the fluorescent tag and records it for every spot on the chip. 3. After each round, non-incorporated molecules are washed away. A chemical deblocking step is then used in the removal of the 3’ terminal blocking group and the dye in a single step.
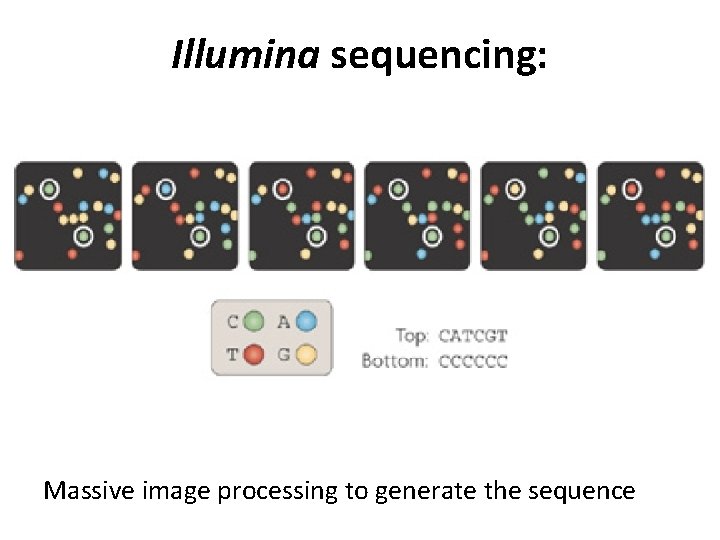
Illumina sequencing: Massive image processing to generate the sequence
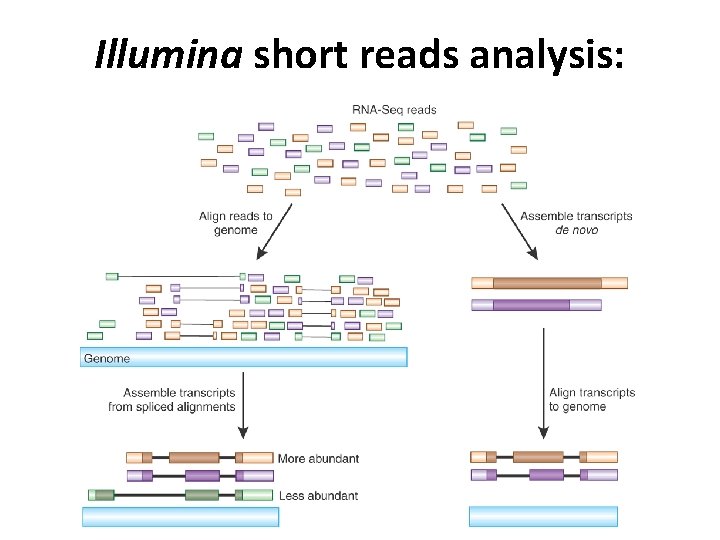
Illumina short reads analysis:
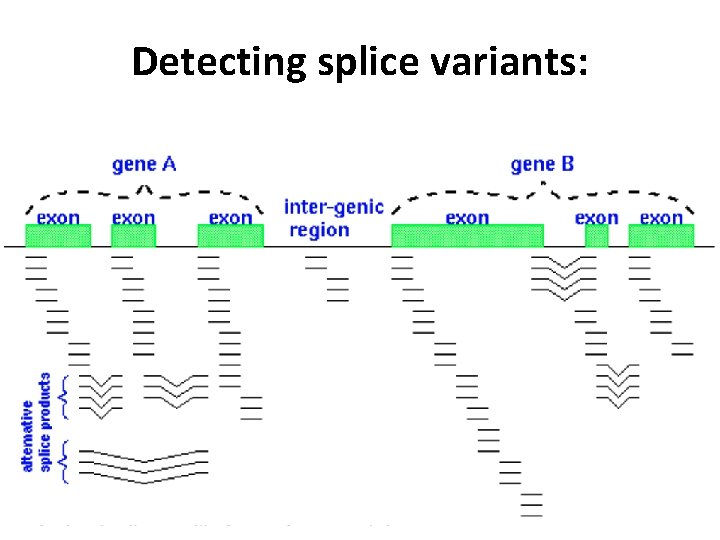
Detecting splice variants:
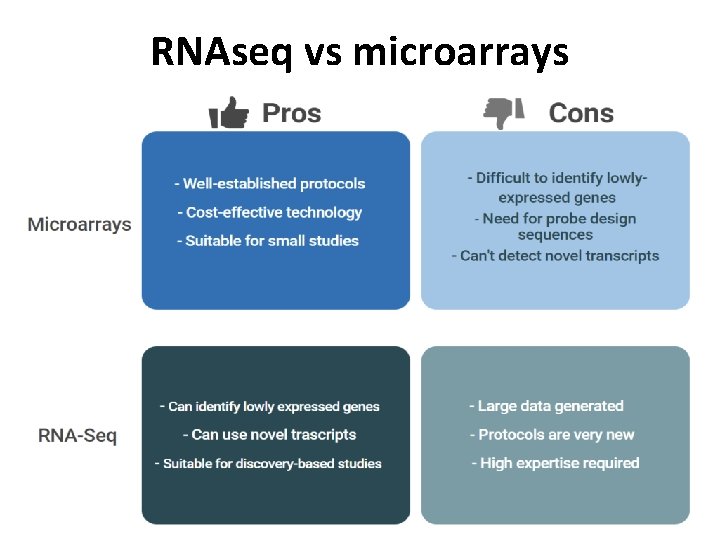
RNAseq vs microarrays
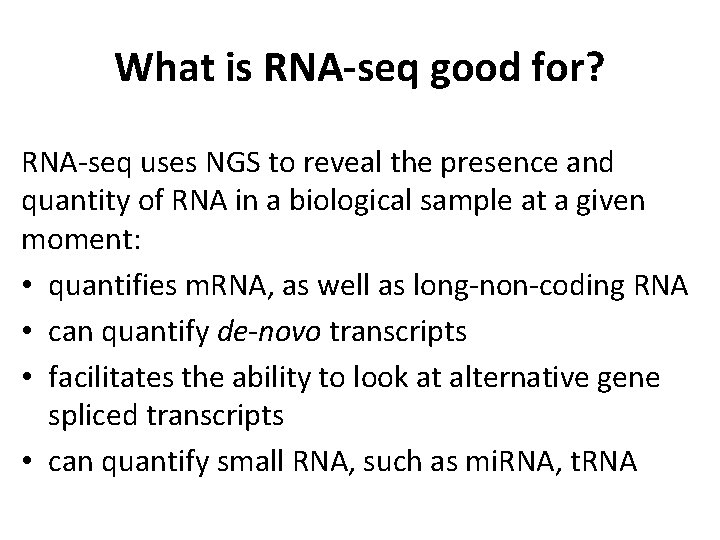
What is RNA-seq good for? RNA-seq uses NGS to reveal the presence and quantity of RNA in a biological sample at a given moment: • quantifies m. RNA, as well as long-non-coding RNA • can quantify de-novo transcripts • facilitates the ability to look at alternative gene spliced transcripts • can quantify small RNA, such as mi. RNA, t. RNA

Applications
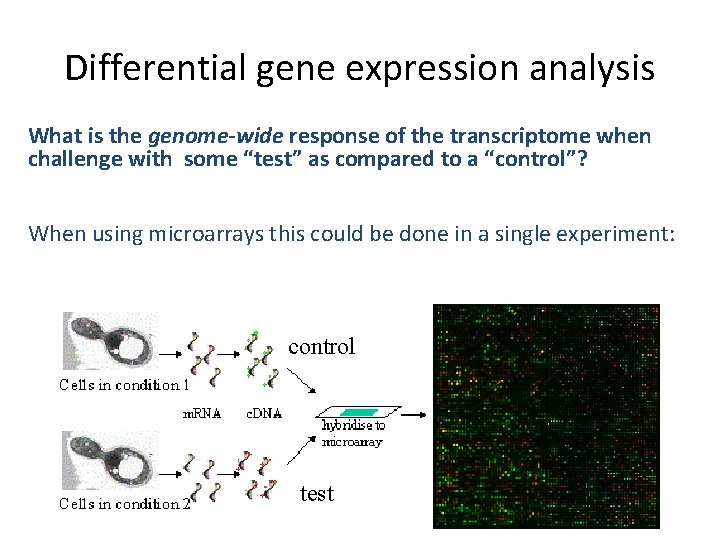
Differential gene expression analysis What is the genome-wide response of the transcriptome when challenge with some “test” as compared to a “control”? When using microarrays this could be done in a single experiment: control test
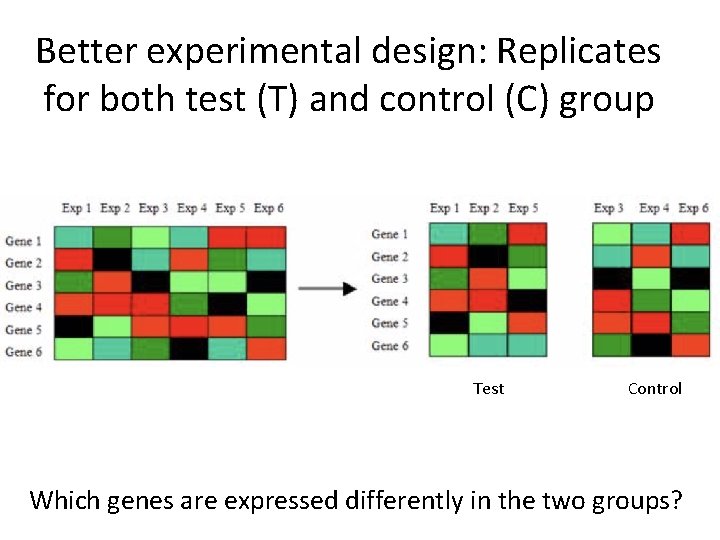
Better experimental design: Replicates for both test (T) and control (C) group Test Control Which genes are expressed differently in the two groups?
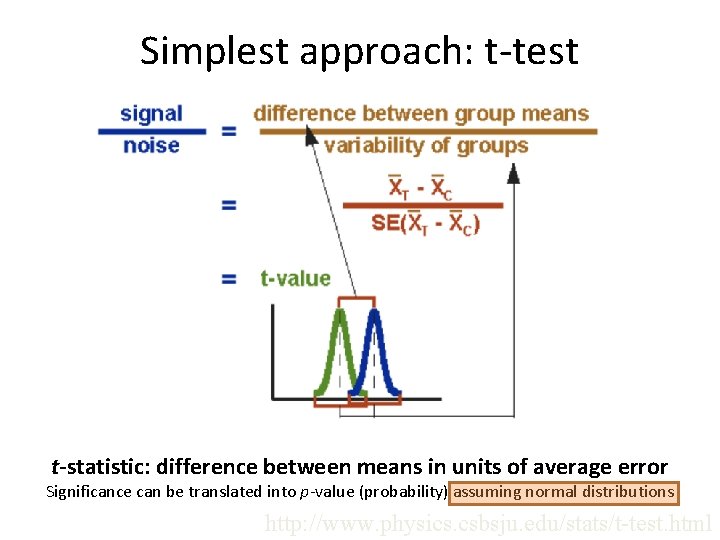
Simplest approach: t-test t-statistic: difference between means in units of average error Significance can be translated into p-value (probability) assuming normal distributions http: //www. physics. csbsju. edu/stats/t-test. html
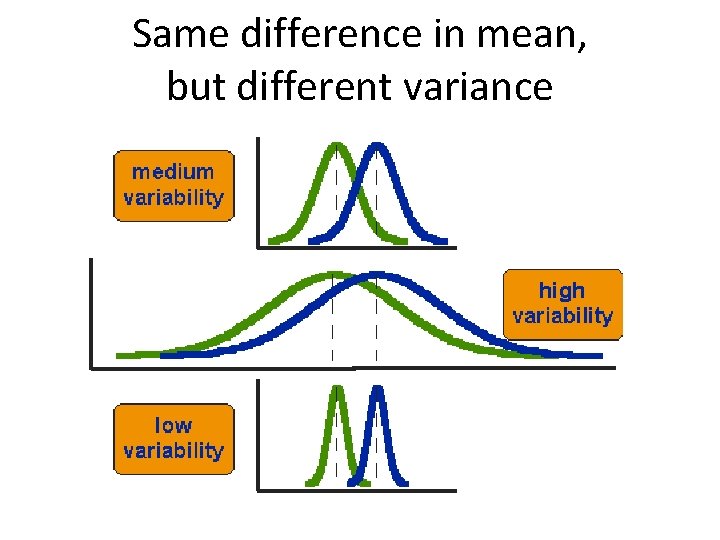
Same difference in mean, but different variance
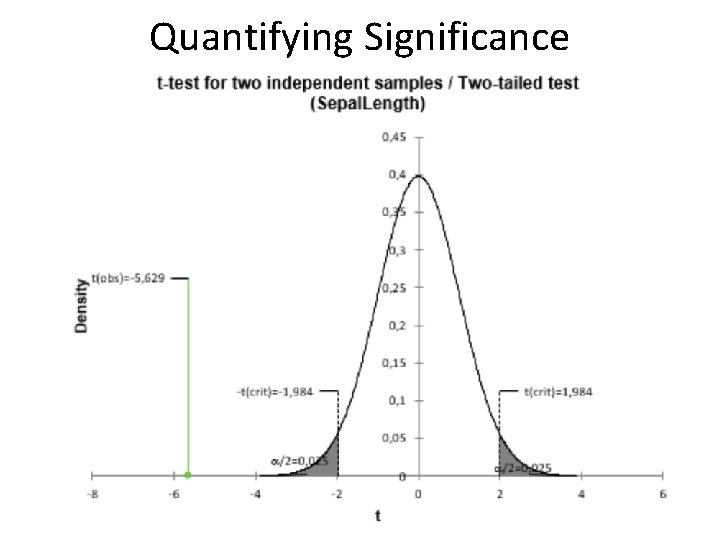
Quantifying Significance
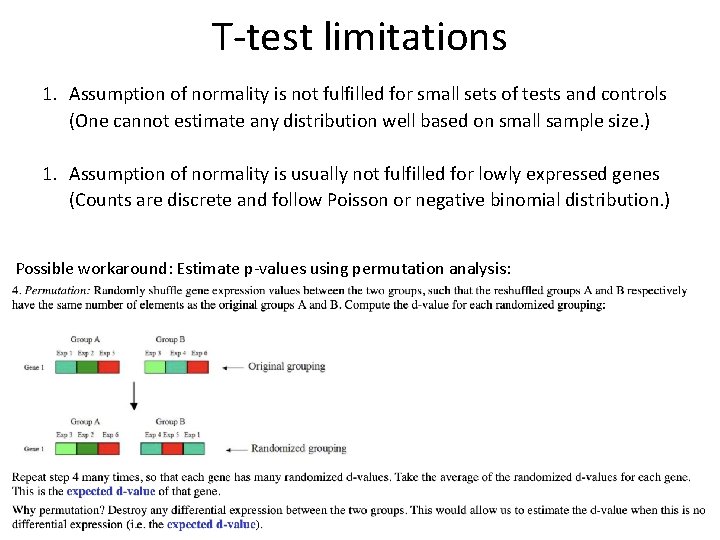
T-test limitations 1. Assumption of normality is not fulfilled for small sets of tests and controls (One cannot estimate any distribution well based on small sample size. ) 1. Assumption of normality is usually not fulfilled for lowly expressed genes (Counts are discrete and follow Poisson or negative binomial distribution. ) Possible workaround: Estimate p-values using permutation analysis:
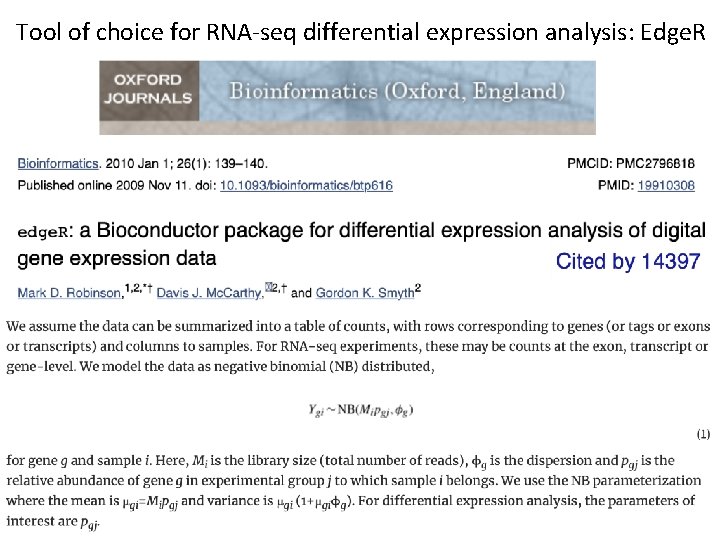
Tool of choice for RNA-seq differential expression analysis: Edge. R
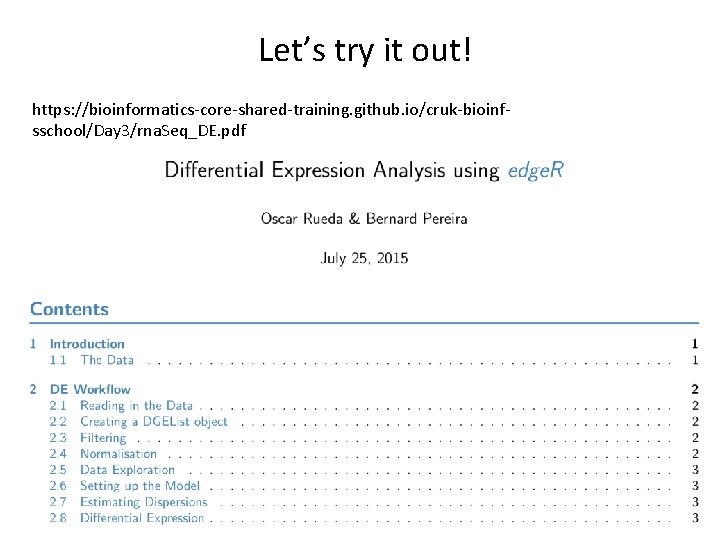
Let’s try it out! https: //bioinformatics-core-shared-training. github. io/cruk-bioinfsschool/Day 3/rna. Seq_DE. pdf
- Slides: 36