Genetic Mapping Linked Genes The chromosome Several genes


2 e")


- Slides: 17
Genetic Mapping Linked Genes
The chromosome • Several genes or alleles are found on each chromosome at a particular locus (position) Locus
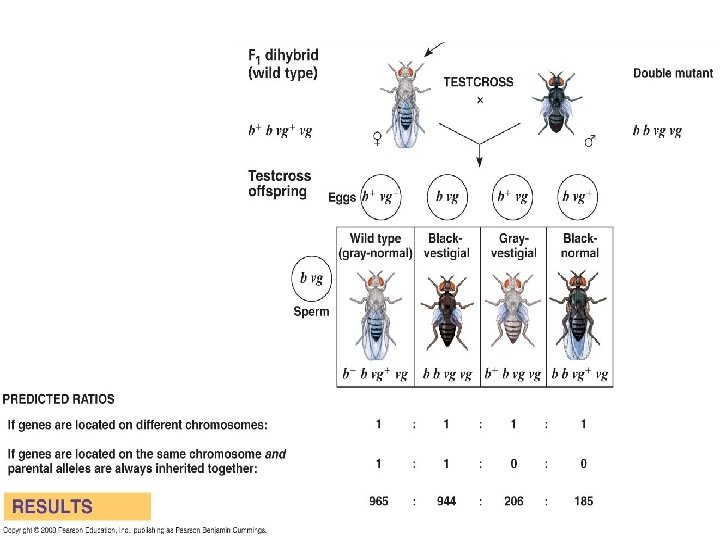
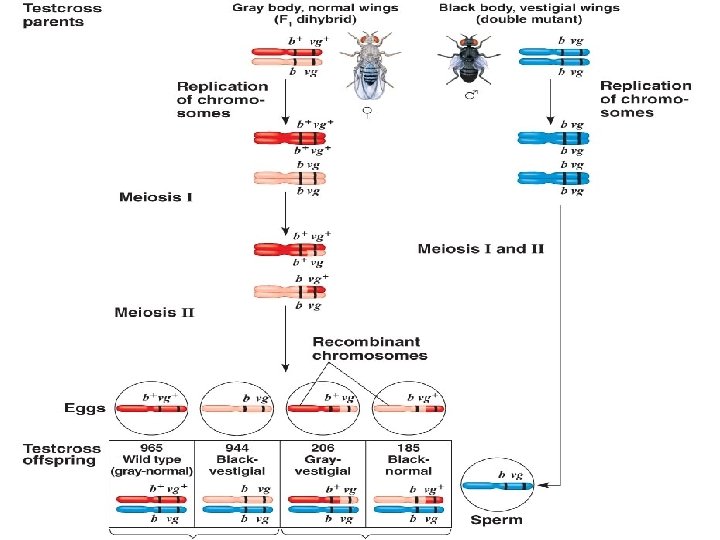
Recombinants • Recombinants- offspring that exhibit genotypes different from either parent
Mendelian Inheritance • Genes that follow Mendel’s inheritance patterns are not on the same chromosome y y Y y r r R r
Genotype ratios come out as expected
Linked Genes • Linked genes- genes that are on the same chromosome and are generally inherited together (don’t follow Mendel’s laws)
Recombinant Frequency • When a lower percentage of recombinants show up than was expected, we know that genes are linked. (or a higher percentage of parental types)
Linkage Map • An order of gene loci along a chromosome based on recombinant frequencies (the further apart the chromosomes are, the higher the probability of them crossing over)
Testing Recombinant Frequencies • A Chi Square test can be done to see if there is a statistical difference in what you expect and what you observe. N=Normal wings n=wingless flies Nn x Nn Expected ? Observed 522 winged 202 wingless
1 st Make a null hypothesis • A null hypothesis says that there is no difference between what you expect and what you observe Is there a difference ?
2 nd Run the numbers • X 2= Σ(o-e)2 e
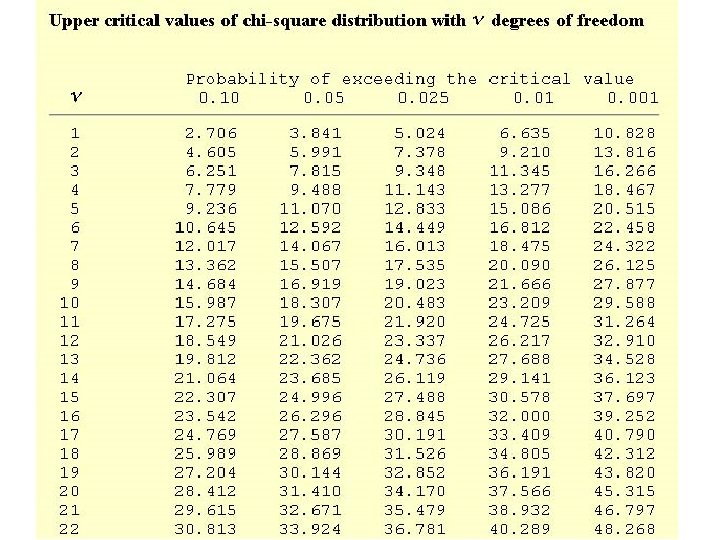
3 rd Get you values • X 2= calculated chi square value • df=degrees of freedom- the number of categories (n) minus 1 • Confidence interval- how sure you can be in the outcome (we usually use 95%)
4 look up your values • Look up you values in the table. If your chi square value is less than the value on the table than except the null hypothesis.
Analyze • An accepted null means what you expected is what you observed • A rejected null means what you expected is significantly different that what you observed.