Genetic architecture of behaviour Genetic architecture of behaviour

Genetic architecture of behaviour

Genetic architecture of behaviour • • How many QTL? What is the average effect size of a QTL? How do the QTL act? What is the molecular basis of QTL action?

OFA App. - John & Gene
.")
OFA/OFD bar graph (From De. Fries, Gervais and Thomas, 1978).
 (From De. Fries, Gervais and Thomas, 1978).")
OFA line graph ) (From De. Fries, Gervais and Thomas, 1978).

Inbred Strain Cross

Intercross experiment De. Fries H 1 X De. Fries L 1 815 animals De. Fries H 2 X De. Fries L 2 821 animals TOTAL: 1, 636

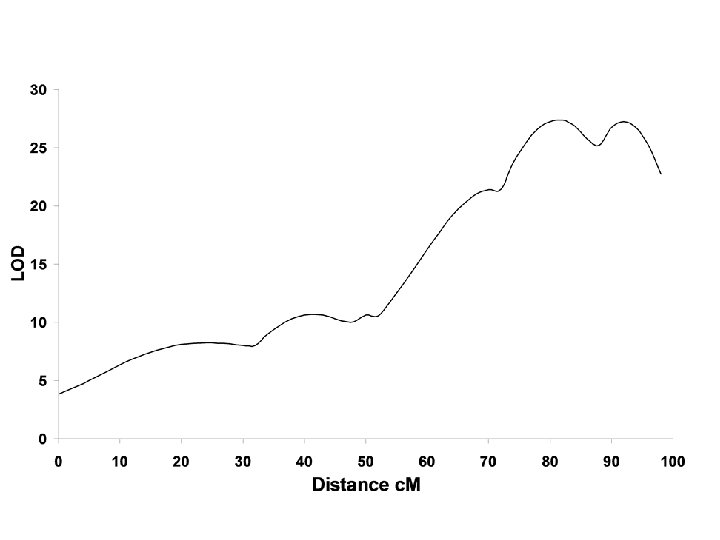
Loci that influence variation in Open Field Activity

How many QTL?

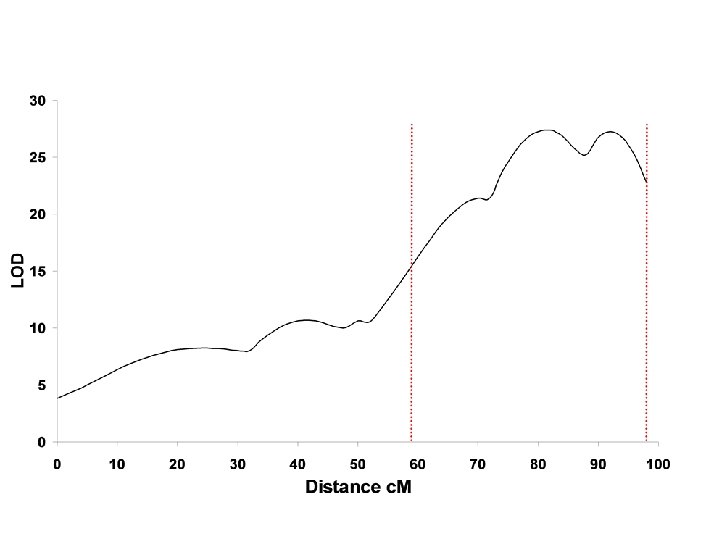
Power to detect a locus

Undetectable QTL

QTL estimator

What is the effect size of the QTL?

Average Effect Size of QTL detected in studies of rodent behaviour

Average Effect Size

Genetic action • How important are epistatic effects?

Interaction A 1 Phenotype A 2 100 B 1 B 2 100

Interaction A 1 B 1 A 2 B 2 Interaction Phenotype 100 + 100 = 300

Epistasis: definition F-All: Y = b 0 + b 1 NA 1 + b 2 NB 1 + b 3(NA 1)(NB 1) F-Part: Y = b 0 + b 1 NA 1 + b 2 NB 1 NA 1 is the "gene dosage" for the A 1 allele in each genotype etc F-Int 2, Fulldf 2 = ((F-All. Fss – F-Part. Fss)/F-All. Rss)(F-Alldf 1 -F-Partdf 1)/F-Aldf 2))

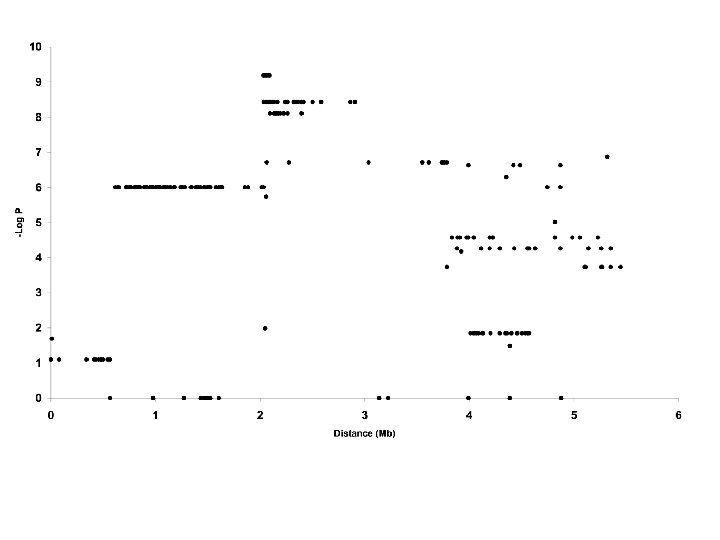
Circadian Rhythm Interaction QTL

Interaction analysis • All pairs of markers tested for interaction on 23 phenotypes • total of 86, 043 analyses

Interaction analysis • All pairs of markers tested for interaction on 23 phenotypes • total of 86, 043 analyses • 4, 048 results gave a -Log. P of > 6. 7 (significance level for the likelihood under the full regression model (F-all))

Interaction analysis • All pairs of markers tested for interaction on 23 phenotypes • total of 86, 043 analyses • 4, 048 results gave a -Log. P of > 6. 7 (significance level for the likelihood under the full regression model (F-all)) • 0. 05 threshold is –Log. P 4. 9
")
Interaction terms less than P-value 0. 001 (Log. P > 3)

Lung Cancer Susceptibility

Genetic architecture • Up to 12 QTL • Effect sizes < 10% • No evidence for interaction

What is the molecular basis of the QTL?

QTL mapping of arthritis susceptibility in rats

Positional cloning of the QTL

Reasons for success • Large effect size: ~25% of phenotypic variance • Recognizable mutation

Increasing Generations F 0 F 1 F 2 F 3 F 4

Two Strains

Eight Strains

Genetically Heterogeneous Mice A/J AKR Balb C 3 H C 57 DBA IS HS Random Breeding HS generations >50 RIII

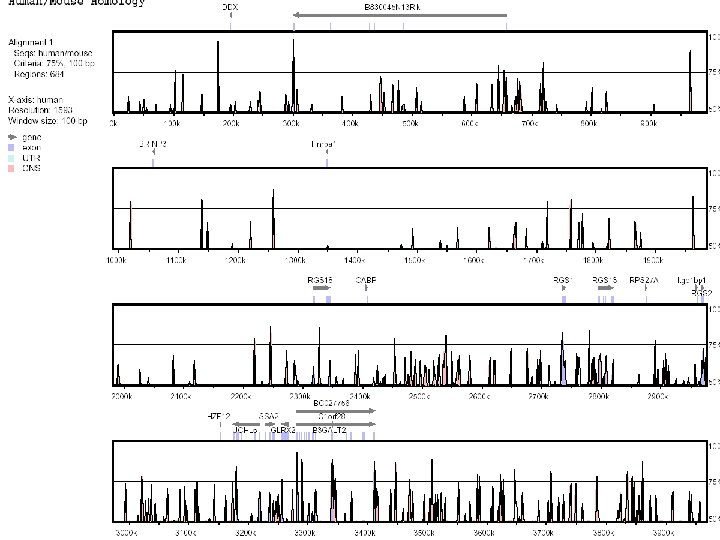
High Resolution

Physical Map 141 143 Cfh 145 B 3 galt Uch 15 Rgs 18 2 Ssa 22 Rgs 13 Rgs 1 Glrx 2 147 149

Coding sequence variants

Coding sequence variants • None

Relation between Sequence Variants and Genetic Effect

Strain Sequences Must Be Consistent with QTL Action QTL A C 57 BALB AKR

Relation between Sequence Variants and Genetic Effect Marker 1 No effect observable QTL Marker 2 Observable effect

Strain pattern of sequence differences

Sequence variation

Strain Distribution

B 3 galt 2 Uch 15 Ssa 2 Rgs 18 Rgs 13 Rgs 1

Genes Rgs 2 Rgs 13 Rgs 18

Regulators of G Protein signalling

RGS 2 Knock-out shows enhanced fear response

Strains s t 1 Markers m-1 m m+1 M
- Slides: 54