Genetic and Phenetic Dynamics of Steelhead Recolonization Above

Genetic and Phenetic Dynamics of Steelhead Recolonization Above Dams: Green River Study Gary Winans CB Division Jon Baker, Frank Orth Assoc. (Formerly, CB Div. )

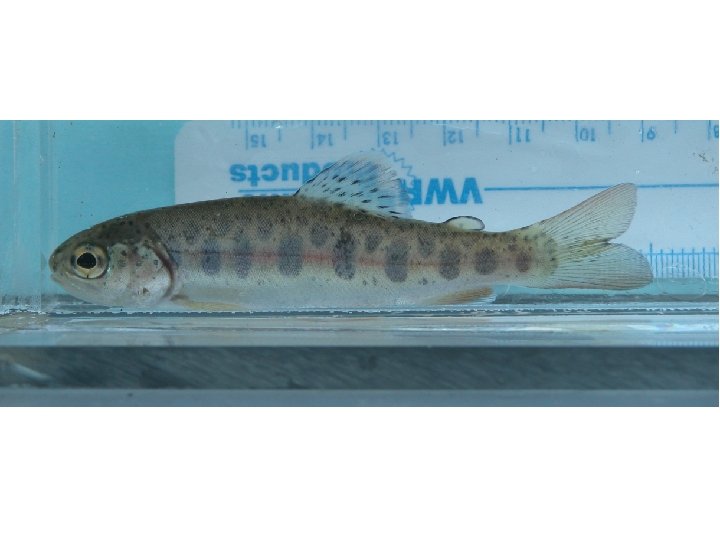
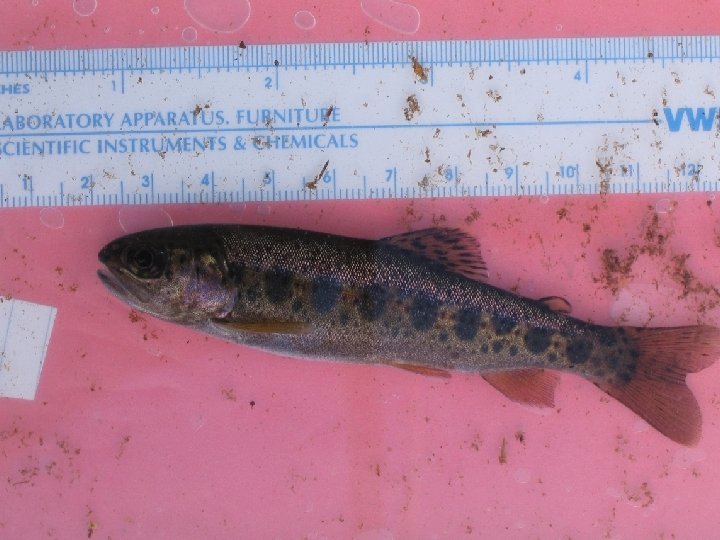
We are interested in Resident fish and the potential “hybridization” of Resident trout and Anadromous Steelhead

Our Research Interests: Character evolution in isolated populations • Non-smolting lifestyle (PSL, behavioral, & metabolic) • Body and fin designs • Body coloration • Evolutionarily-neutral genetic markers

During their 90 years of isolation, REZ fish will be different…due to • natural selection (non-smolting physiology, non-downstream behavior, growth, time of spawning, etc. ) • random genetic changes • outplanting

NOAA is interested in mykiss populations sequestered behind dams • O. mykiss is endangered under the ESA • When dams are removed, what will be the role of Resident trout? • Who will produce naturally occurring recruits?

Our Research Interests: Character evolution in isolated populations • Non-smolting lifestyle (PSL, behavioral, & metabolic) • Body and fin designs • Body coloration • Evolutionarily-neutral genetic markers

N Green River RBT HH Dam RBT residual wild Rm 68 hatchery RBT Rm 84 RBT

Green River. Genetic data Cedar R. Wilds = 50 HH Dam Residents=81 Wild=77 Rm 84 Rm 68 Hatchery = 50 + 50 Calif. Trout = 50 + 50 N

Green River. Genetic data Cedar R. Wilds = 50 “Nearest Neighbor” HH Dam Residents=81 Wild=77 Rm 84 Rm 68 Hatchery = 50 + 50 Calif. Trout = 50 + 50 “Hatchery Outplants” N

m. SAT Loci • • Ocl 1 Ogo 4 Omy 7 INRA Onem 14 Ots 100 Ots 4 Oke 4 • • • Oki 23 Omy 1011 Omy 77 Ssa 289 Ssa 407 Ssa 408

Microsatellite markers—simple sequence repeats - Allele designations typically related to fragment size “ 102” CA CA CA “ 100” CA CA CA “ 96” CA CA “ 94” CA CA

Mean No. of Alleles per Locus Diversity at 13 m. SAT loci 13 12 11 10 1=Resident 2=Native 3=Hatchery 9 8 0. 65 0. 70 0. 75 0. 80 Mean Heterozygosity 0. 85

Mean No. of Alleles per Locus 15 10 5 0 0. 50 1=Resident 2=Native 3=Hatchery 4=Cal. Trout 0. 63 0. 73 0. 90

Cal Trout 1 Cal Trout 2 Cedar River Hatch 2 Hatch 1 Resident 1 Native 2 Resident 2 Nei’s D 0. 1 Resident 3

Green River. Morphology data Cedar R. Wilds “Nearest Neighbor” HH Dam Residents=20 Wild=20 Rm 84 Rm 68 Hatchery = 20 + 20 N Calif. Trout “Hatchery outplants”
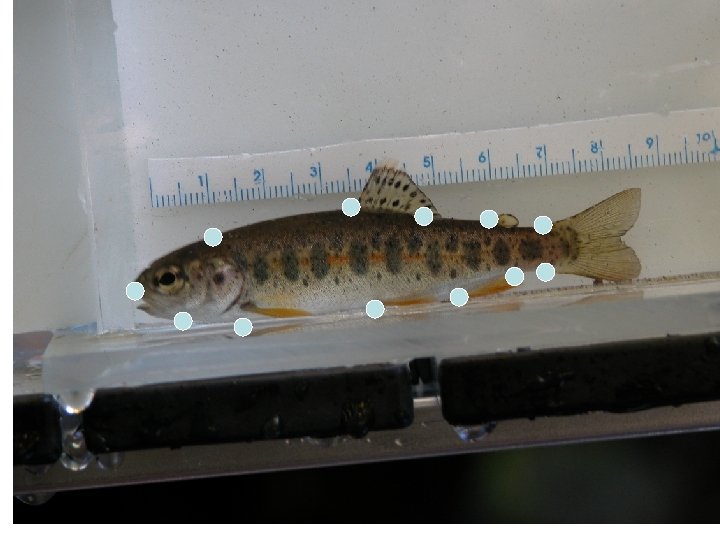
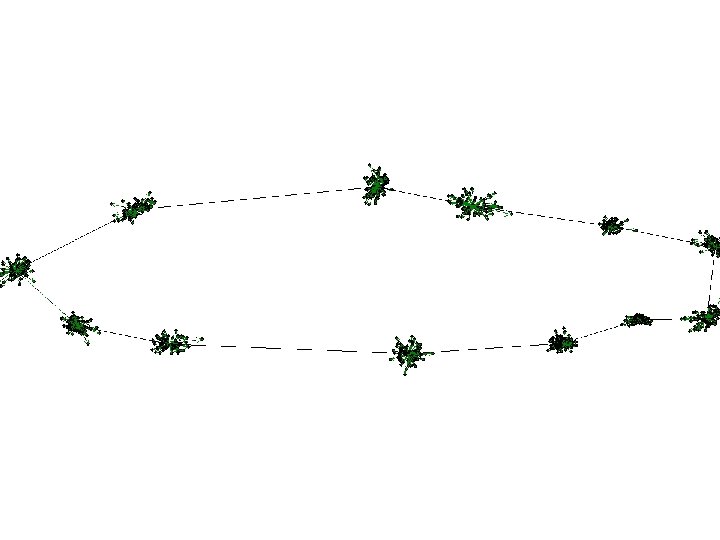

Thin Plate Spline/Relative Warps • Each fish is represented by a set of landmarks • Each fish is compared to a consensus outline; a similarity value generated • A similarity matrix is assesed by a PCA • Producing the relative warps (RWs)
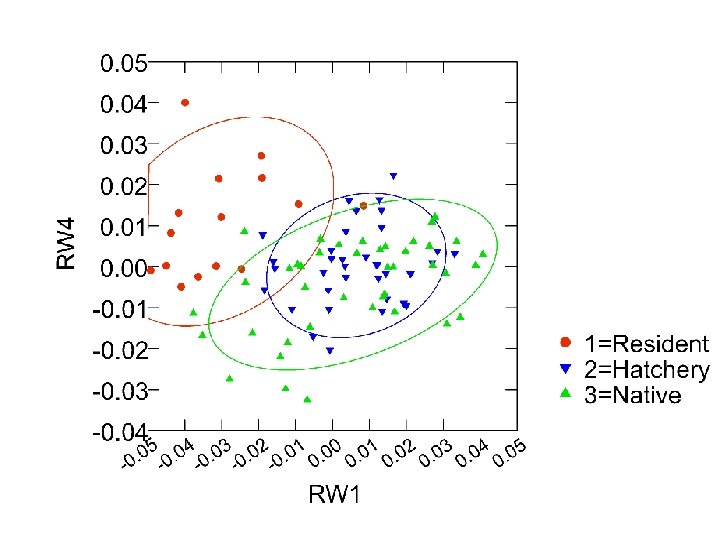

RW Analysis of Body Shape 0. 05 0. 04 0. 03 RW 4 0. 02 0. 01 0. 00 -0. 01 -0. 02 1=Above 2=Below -0. 03 -0. 04 . 05 0. 04 0. 03 0. 02 0. 01 0. 00 0. 01 0. 02 0. 03 0. 04 0. 05 0 - RW 1

Shape differences: resident vs. consensus Resident Neg RW 1; elongate nose, deeper head; deeper trunk; v. shortened CP

Head LL Dorsal Split Mid LL Dorsal Split Tail Dorsal Split

Resident 8 Hatchery 1 0. 4 15 0. 9 7 0. 8 4 0. 2 3 2 0. 1 10 0. 6 Count 5 0. 7 0. 5 0. 4 5 0. 3 0. 2 1 Proportion per Bar 0. 3 Proportion per Bar 6 0. 1 0 0 1 2 3 4 0. 0 5 0 0 1 MID_D_PARR 3 4 Native 15 0. 7 0. 6 5 0. 2 Count 0. 3 0. 5 10 0. 4 0. 3 5 0. 2 0. 1 0 0 1 2 3 4 MID_D_PARR 0. 0 5 Proportion per Bar 0. 4 0. 6 Proportion per Bar 0. 5 10 0. 0 5 MID_D_PARR Hatchery 2 15 2

3 PCA 3 2 1 0 1=residents 2=wild 3=hatchery -1 -2 -2 -1 0 1 2 PCA 1 3 4 5

Parr Mark Analysis 3 2 PCA 3 t=4. 16, P=0. 0 1=above 2=below -1 -2 -2 -1 0 1 2 PCA 1 3 4 5

Below-Elwha Dam Above-Elwha Dam Mean=9. 15 Mean=9. 6 Mean=8. 95 Mean=9. 4 Mean=10. 5 Lateral Line Parr Above 9. 9 vs. Below 9. 1 ***

Further Analyses • • • Hardy-Weinberg Disequilibrium Bootstrap D values Rare alleles F statistics Contingency tables PCA of allele frequencies MM--ontogenetic influences MM--PCA of truss-network characters

• Resident fish above the dam are not genetically dissimilar from “Native” late-run fish below the dam • Resident fish are different from hatchery fish • Juvenile resident fish have different body shapes and parr mark patterns
 above the HH")
• Did we find a unique gene pool (a Gem) above the HH dam? • Is there evidence that there is a population of ‘residualized’ steelhead above HH dam? • Can we use these m. SATs to recognize resident x steelhead crosses?

• Is there a general pattern in genetic and phenetic variability in resident fish vs. downstream steelhead? Green River: (Internal Grant seed money) Elwha River: (NOAA Restoration $) Lewis River: Pacifi. Corp $

Elwha Dam Glines Canyon Dam

Neg RW 2
- Slides: 36