
General Statistics Stat 110 Daliah Bugis Email dabugiskau
General Statistics Stat 110
Daliah Bugis • E_mail: dabugis@kau. edu. sa • Office hours: 11 -12 Sunday - Tuesday - Thursday
Course Information: • Course name and number: General Statistics. STAT 110 • Course website address: http: //stat. kau. edu. sa/Pages-stat-110 -femalesection. aspx
Textbook: Elementary Statistics a Step by Step Approach, 9 th Edition by Allan Bluman, Mc. Graw/Hill, 2009.
COURSE SYLLABUS: • • Chapter 1: The Nature of Probability and Statistics Chapter 2: Frequency Distributions and Graphs Chapter 3: Data Description Chapter 4: Probability and Counting Rules Chapter 5: Discrete Probability Distributions Chapter 6: The Normal Distribution Chapter 10: Correlation and Regression + Chapter 13
CHAPTER 1 The Nature of Probability and Statistics
Statistics is the science of conducting studies to collect , organize, summarize , analyze and drawing conclusions from data.
Introduction üA Variable: Variable is characteristic or attribute that can assume different values. üData: are the values (measurements or observations) that the variables can assume. üRandom Variable: variables whose determined : by chance. ü Data set : Collection of data values. üDatum Or a data value Each value in the data set value
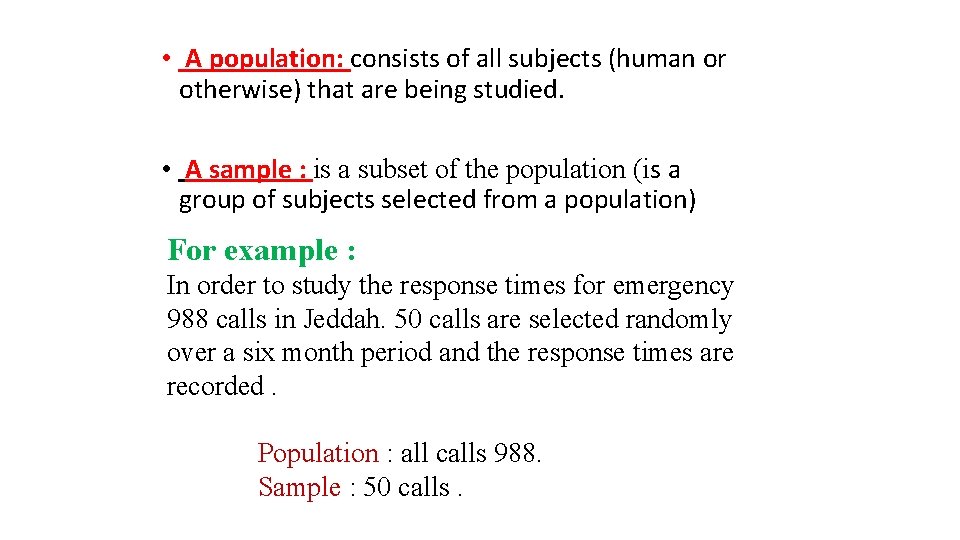
• A population: consists of all subjects (human or otherwise) that are being studied. • A sample : is a subset of the population (is a group of subjects selected from a population) For example : In order to study the response times for emergency 988 calls in Jeddah. 50 calls are selected randomly over a six month period and the response times are recorded. Population : all calls 988. Sample : 50 calls.
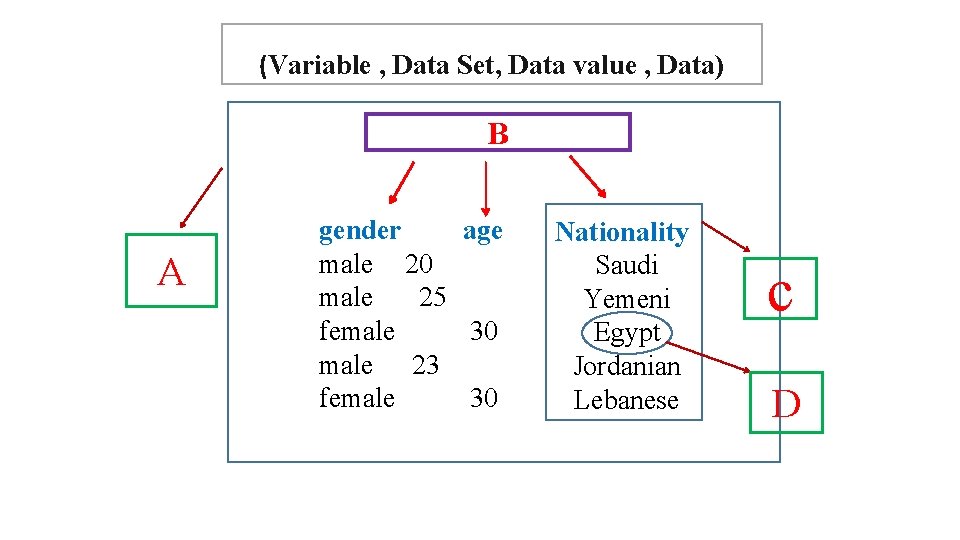
(Variable , Data Set, Data value , Data) B A gender age male 20 male 25 female 30 male 23 female 30 Nationality Saudi Yemeni Egypt Jordanian Lebanese c D
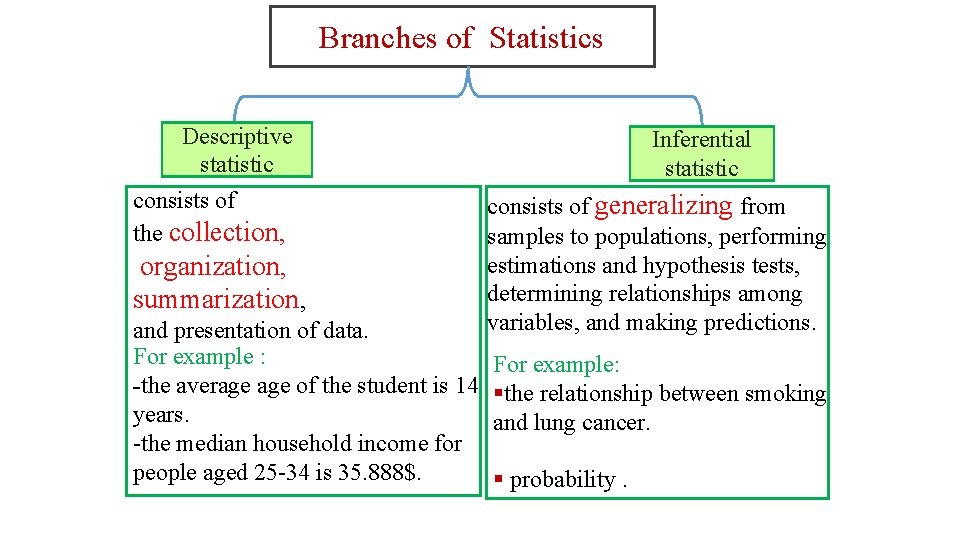
Branches of Statistics Descriptive statistic consists of the collection, organization, summarization, and presentation of data. For example : -the average of the student is 14 years. -the median household income for people aged 25 -34 is 35. 888$. Inferential statistic consists of generalizing from samples to populations, performing estimations and hypothesis tests, determining relationships among variables, and making predictions. For example: §the relationship between smoking and lung cancer. § probability.
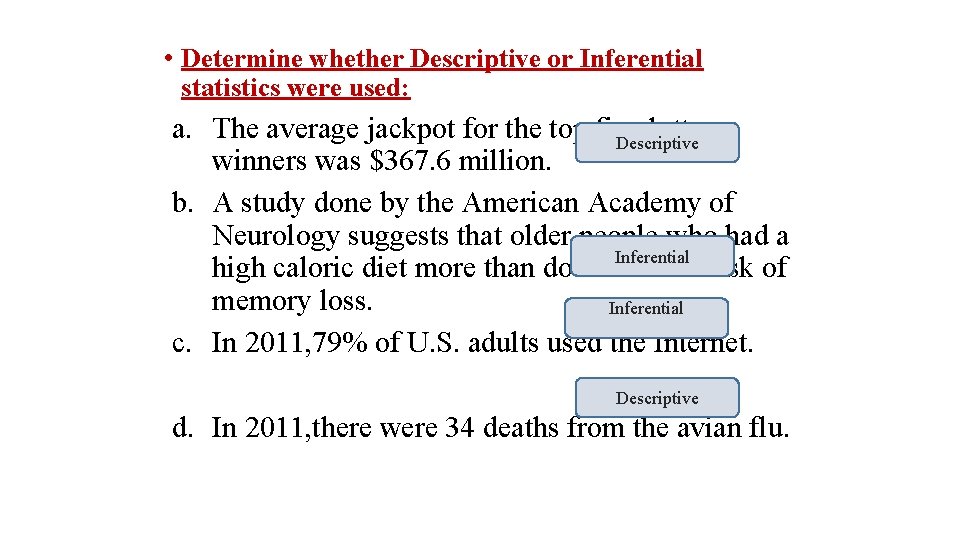
• Determine whether Descriptive or Inferential statistics were used: a. The average jackpot for the top five lottery Descriptive winners was $367. 6 million. b. A study done by the American Academy of Neurology suggests that older people who had a Inferential high caloric diet more than doubled their risk of memory loss. Inferential c. In 2011, 79% of U. S. adults used the Internet. Descriptive d. In 2011, there were 34 deaths from the avian flu.
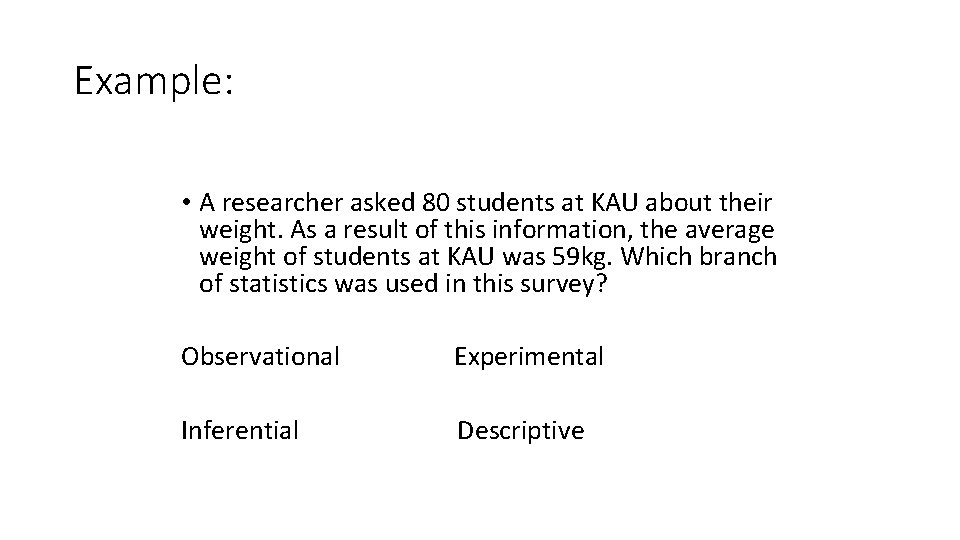
Example: • A researcher asked 80 students at KAU about their weight. As a result of this information, the average weight of students at KAU was 59 kg. Which branch of statistics was used in this survey? Observational Experimental Inferential Descriptive
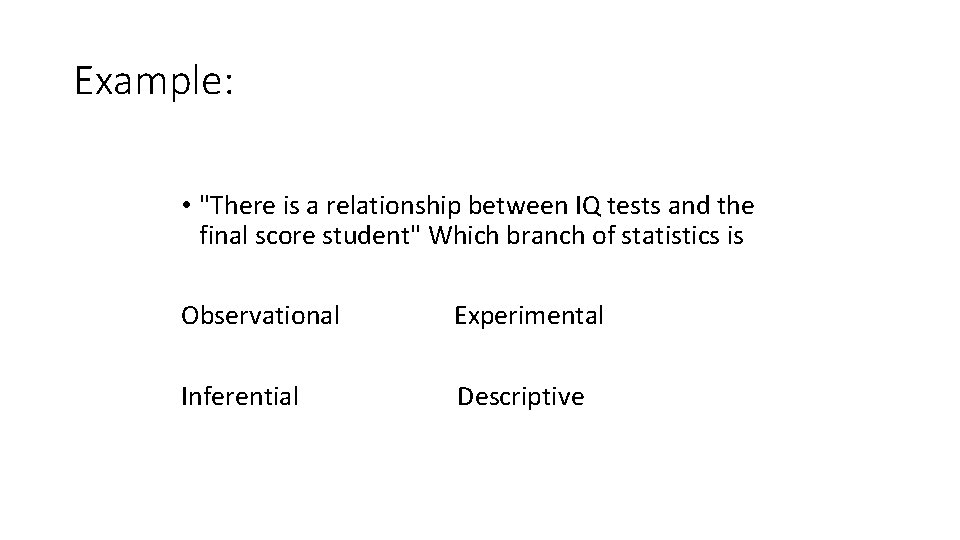
Example: • "There is a relationship between IQ tests and the final score student" Which branch of statistics is Observational Experimental Inferential Descriptive
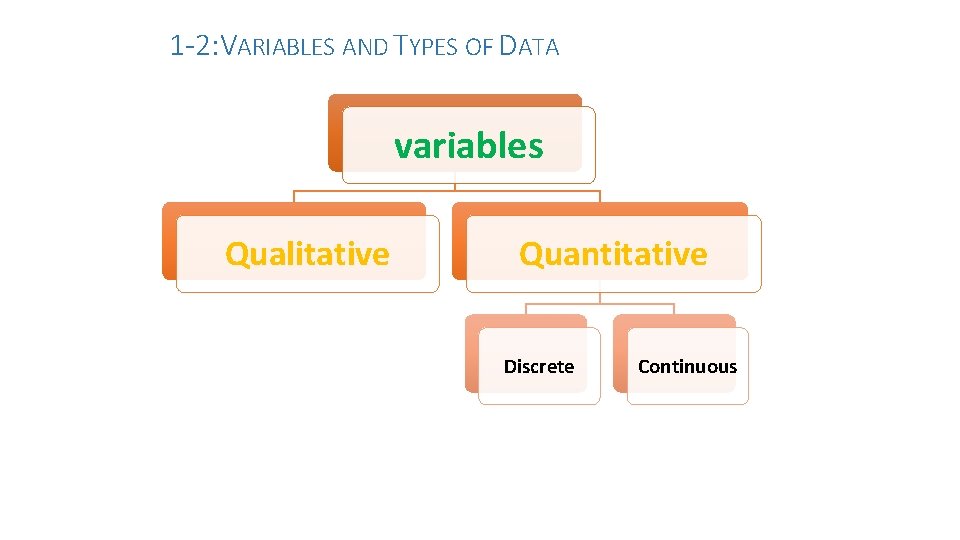
1 -2: VARIABLES AND TYPES OF DATA variables Qualitative Quantitative Discrete Continuous
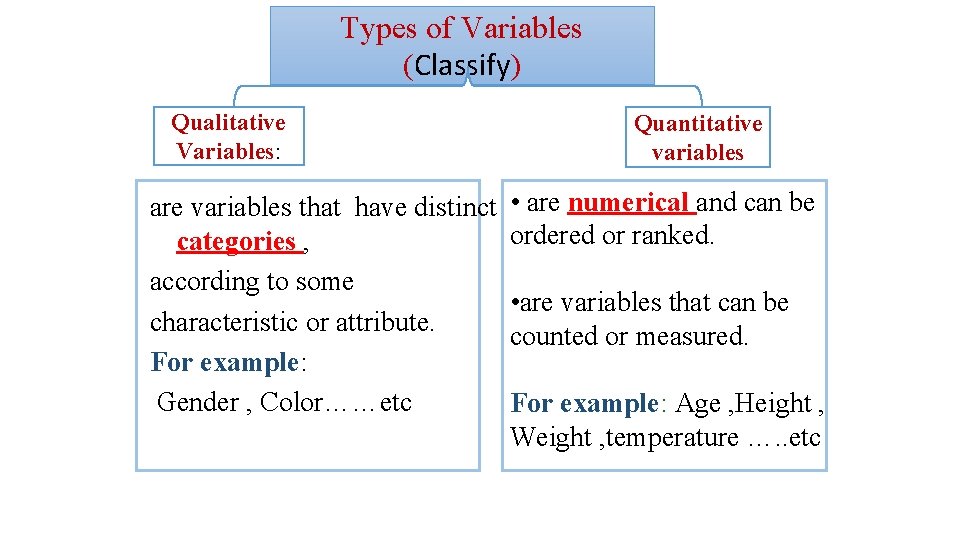
Types of Variables (Classify) Qualitative Variables: are variables that have distinct categories , according to some characteristic or attribute. For example: Gender , Color……etc Quantitative variables • are numerical and can be ordered or ranked. • are variables that can be counted or measured. For example: Age , Height , Weight , temperature …. . etc
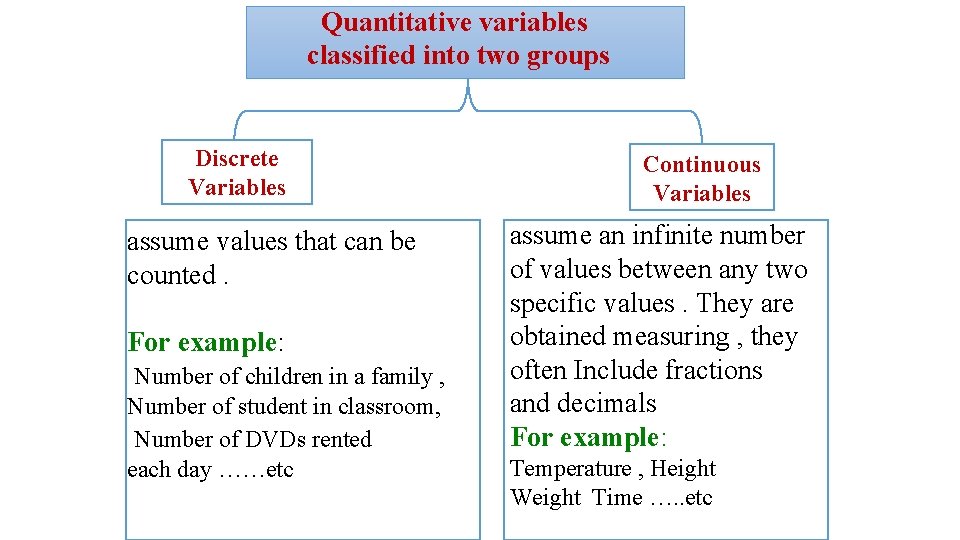
Quantitative variables classified into two groups Discrete Variables assume values that can be counted. For example: Number of children in a family , Number of student in classroom, Number of DVDs rented each day ……etc Continuous Variables assume an infinite number of values between any two specific values. They are obtained measuring , they often Include fractions and decimals For example: Temperature , Height Weight Time …. . etc
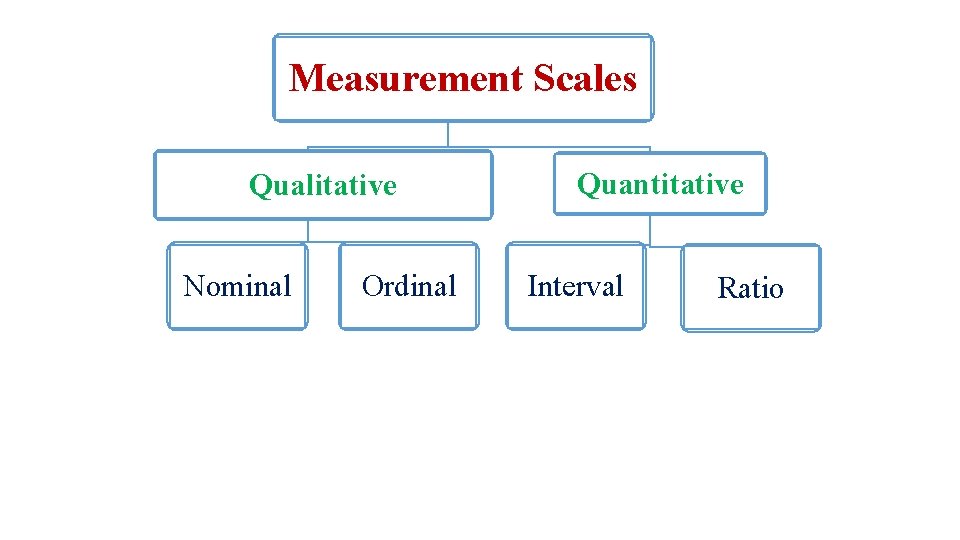
Measurement Scales Qualitative Nominal Ordinal Quantitative Interval Ratio
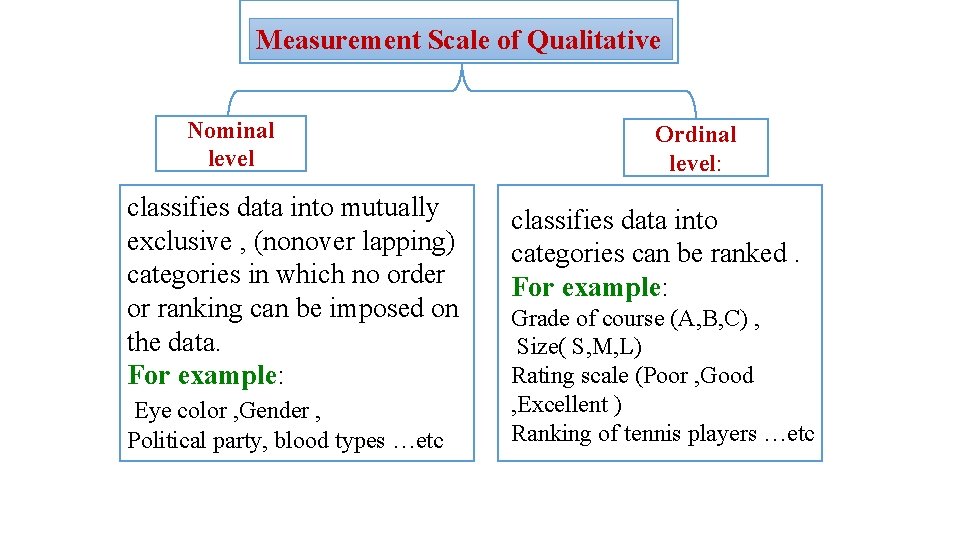
Measurement Scale of Qualitative Nominal level classifies data into mutually exclusive , (nonover lapping) categories in which no order or ranking can be imposed on the data. For example: Eye color , Gender , Political party, blood types …etc Ordinal level: classifies data into categories can be ranked. For example: Grade of course (A, B, C) , Size( S, M, L) Rating scale (Poor , Good , Excellent ) Ranking of tennis players …etc
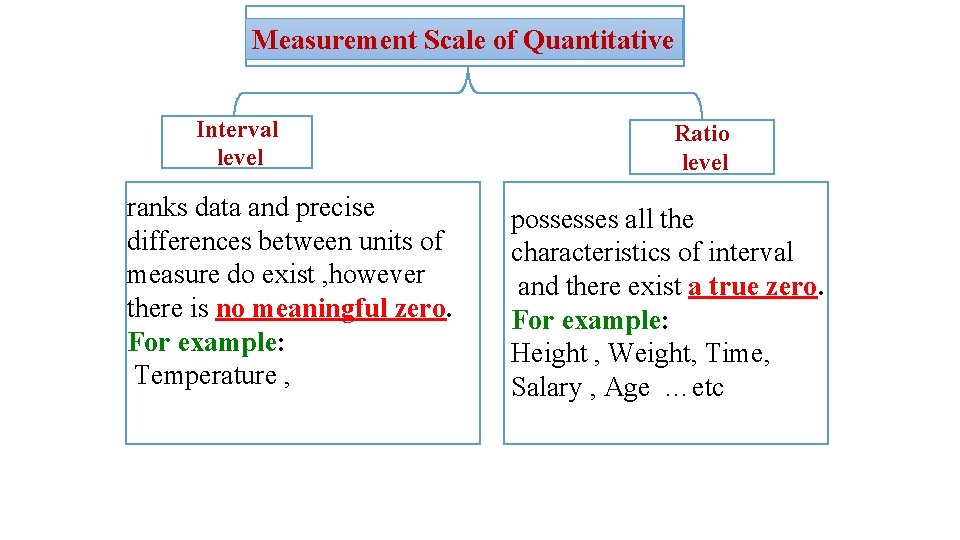
Measurement Scale of Quantitative Interval level ranks data and precise differences between units of measure do exist , however there is no meaningful zero. For example: Temperature , Ratio level possesses all the characteristics of interval and there exist a true zero. For example: Height , Weight, Time, Salary , Age …etc
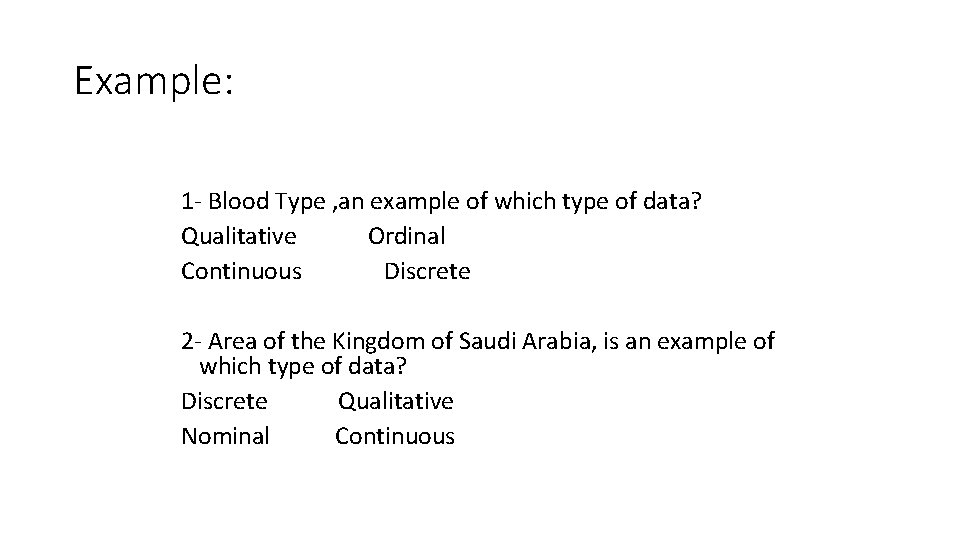
Example: 1 - Blood Type , an example of which type of data? Qualitative Ordinal Continuous Discrete 2 - Area of the Kingdom of Saudi Arabia, is an example of which type of data? Discrete Qualitative Nominal Continuous
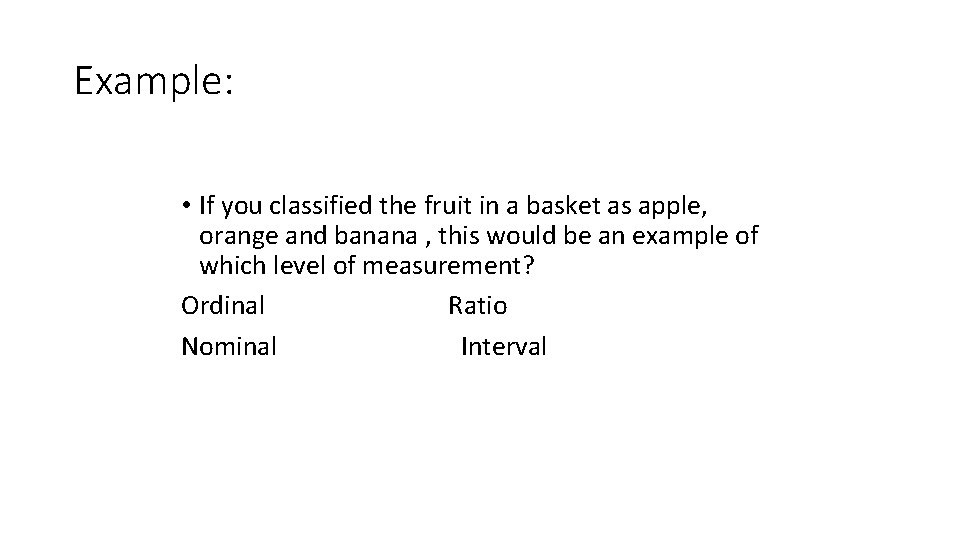
Example: • If you classified the fruit in a basket as apple, orange and banana , this would be an example of which level of measurement? Ordinal Ratio Nominal Interval
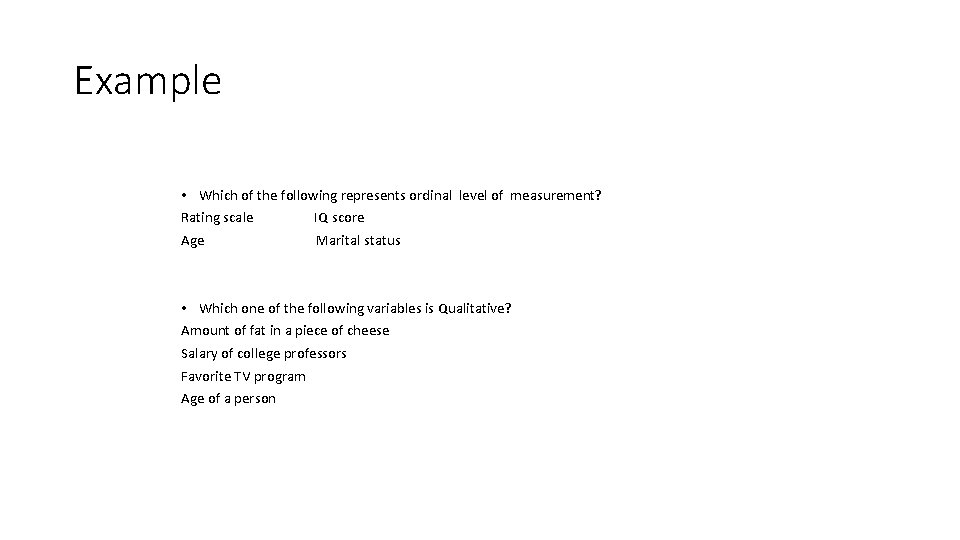
Example • Which of the following represents ordinal level of measurement? Rating scale IQ score Age Marital status • Which one of the following variables is Qualitative? Amount of fat in a piece of cheese Salary of college professors Favorite TV program Age of a person
1 -3 Data collection and sampling techniques
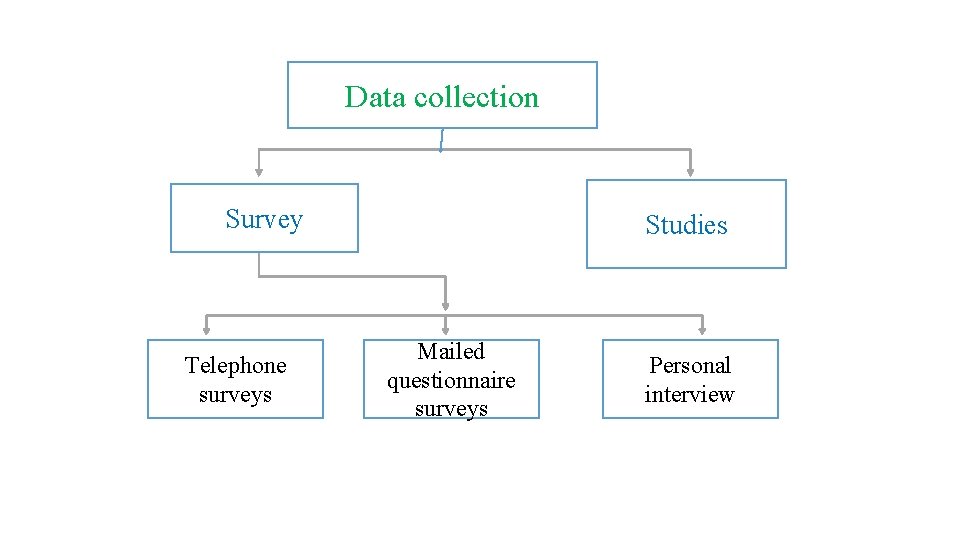
Data collection Survey Telephone surveys Studies Mailed questionnaire surveys Personal interview
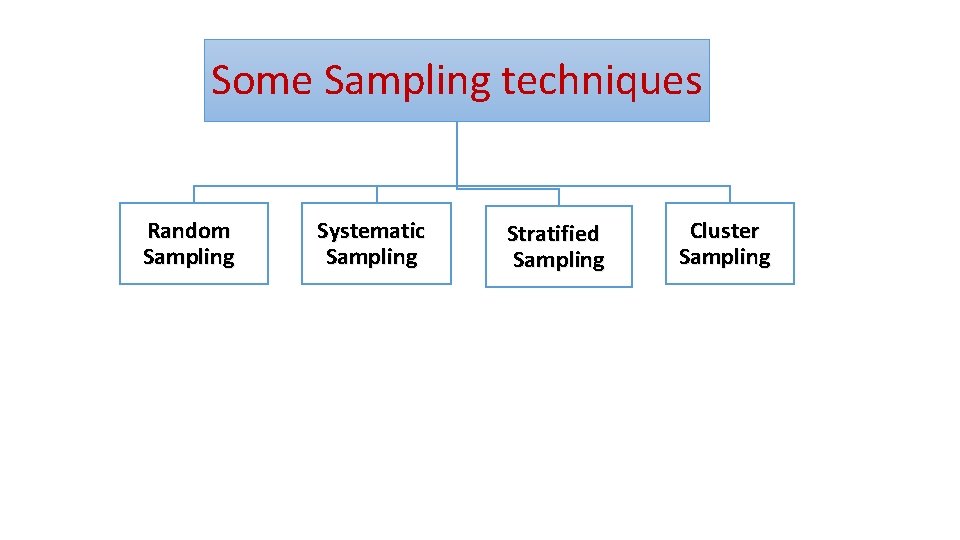
Some Sampling techniques Random Sampling Systematic Sampling Stratified Sampling Cluster Sampling
1 -Random Sampling : ØA random sample is a sample in which all members of the population have an equal chance of being selected. ØAre selected by using chance methods or random numbers.
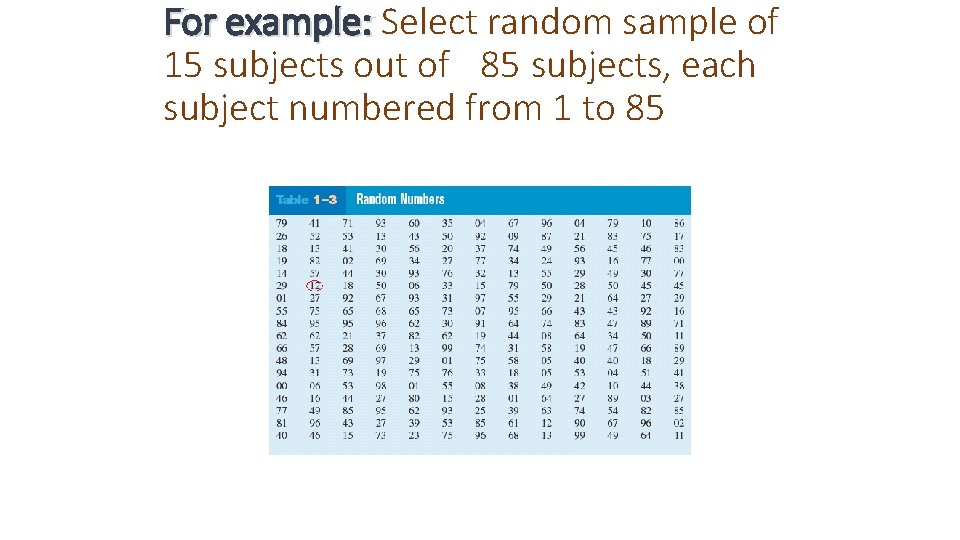
For example: Select random sample of 15 subjects out of 85 subjects, each subject numbered from 1 to 85
2 -Systematic Sampling ØAre obtained by numbering each value in the population and then selecting the kth value. Øis a sample obtained by selecting every kth member of the population where K is counting number. • K=N/n • n is the sample size, and N is the population size.
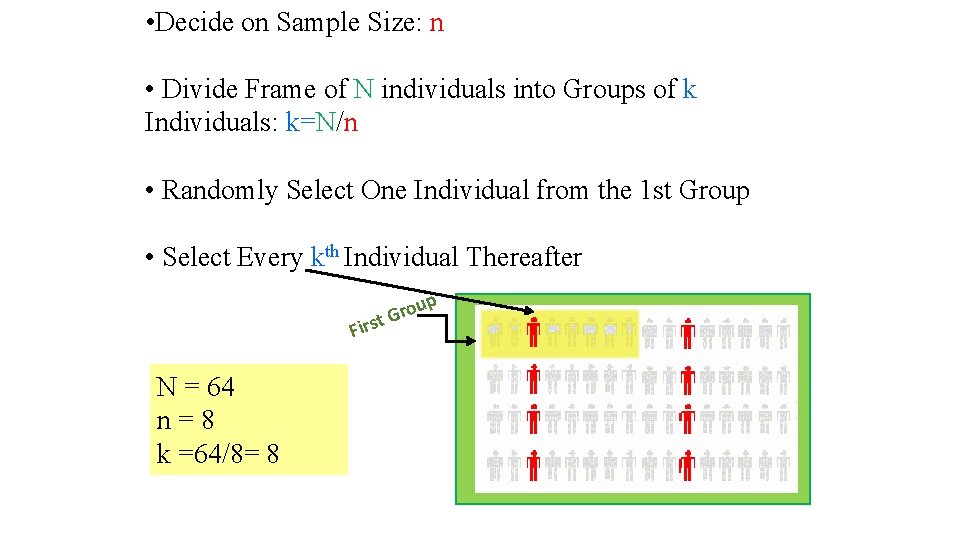
• Decide on Sample Size: n • Divide Frame of N individuals into Groups of k Individuals: k=N/n • Randomly Select One Individual from the 1 st Group • Select Every kth Individual Thereafter up o r t. G Firs N = 64 n=8 k =64/8= 8
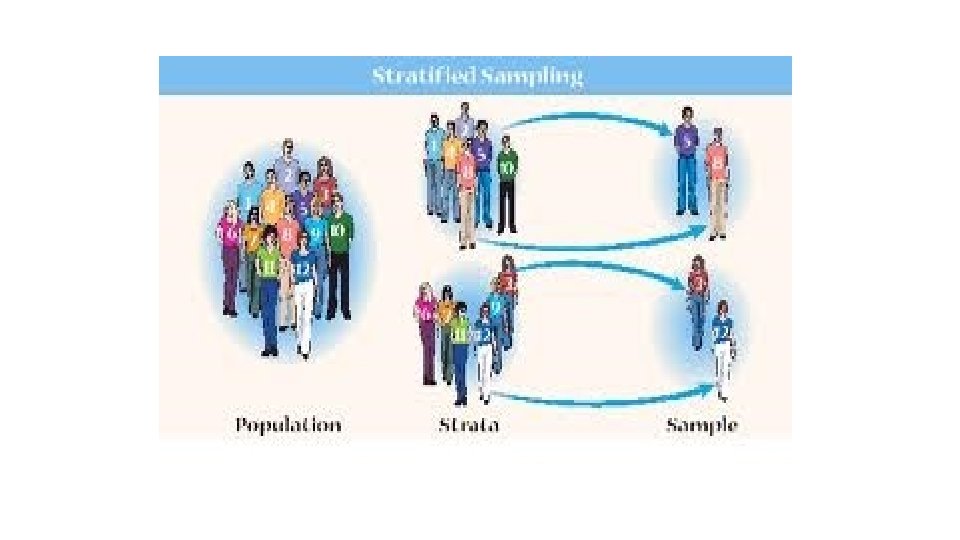
3 -Stratified samples Øis a sample obtained by dividing the population into subgroups or (strata ) according to some characteristic relevant to the study. Then subjects are selected from each subgroup. For example: A researcher select a random sample from each gender to check their blood pressure.
4 -Cluster samples Øis obtained by dividing the population into sections or clusters and then selecting one or more clusters and using all members in the cluster(s) as the members of the sample For example : In a large school district , all teachers from two building are interviewed to determine whether they believe the students have less homework to do now than in previous years.
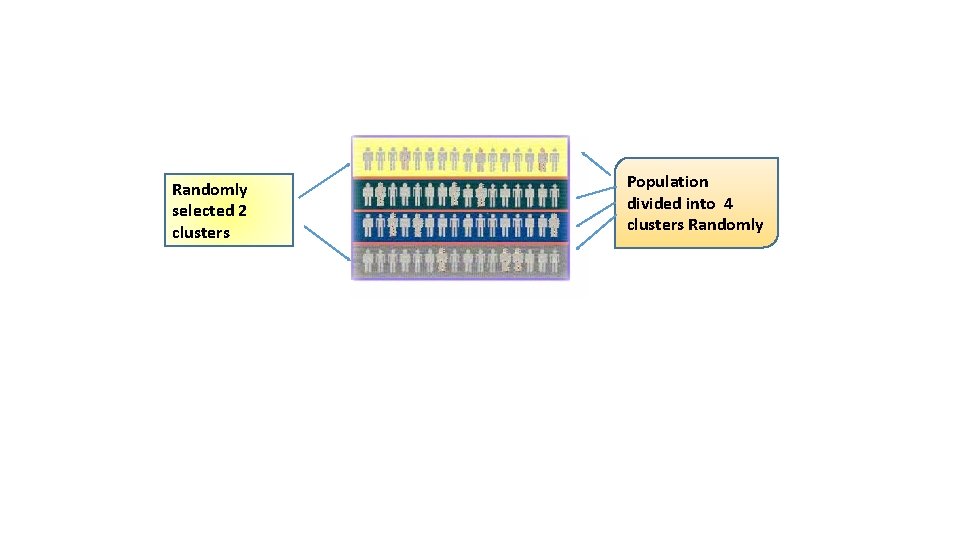
Randomly selected 2 clusters Population divided into 4 clusters Randomly
Summary of sampling techniques • Random : random number generator. • Systematic : every kth subject. • Stratified : divide population into group called “strata”. • Cluster : use intact groups. • Convenient : a researcher uses subjects that are convenient. Exp. : (a researcher in the mall…. . ).
* Exercises: 1 - A researcher wanted to do a study about doctor’s income in Jeddah. He divided hospitals into two sectors (private and public) then he took a sample from each sector.
Exercises: 2 - A researcher wanted to know doctors opinion about herbal therapy in Jeddah. For this study, he choose randomly 3 hospitals out of 20 hospitals in Jeddah, and all doctors in the 3 hospital were asked.
• What type of sampling if employees is divided into Education classes and a sample is chosen from each class to be surveyed? • Researcher select 10 devices from different labs to be tested , What type of sampling in that example ? • Every seventh customer entering a shopping mall is asked to select her or his favorite store. What type of sampling methods has been used in that example ?
1 -4 Observational and Experimental Studies
Types of studies Observational Studies Experimental Studies
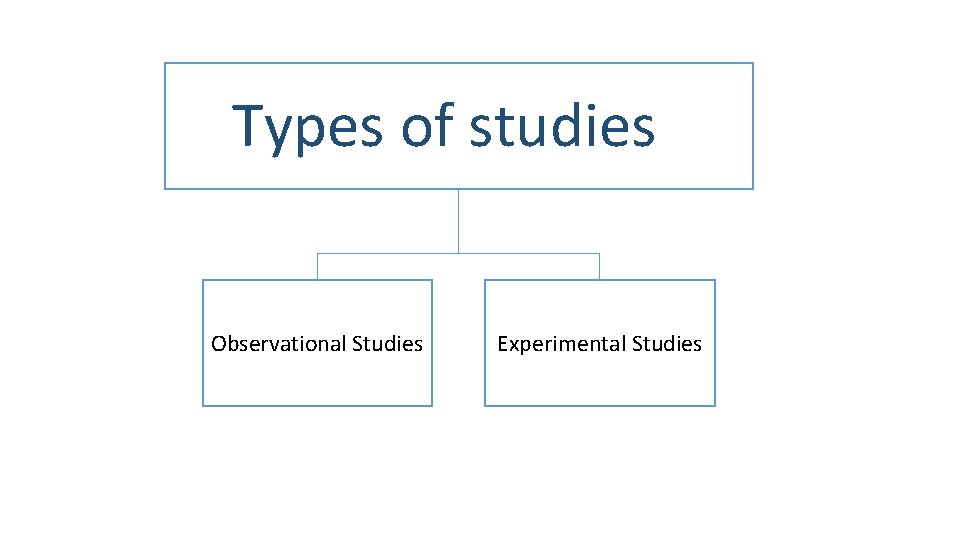
1 -4: Observational and Experimental Studies 1 - Observational Study: The researcher merely observes what is happening or what has happened in the past and tries to draw conclusions based on these observations. For example: ” if a researcher records how many students are wearing the Abaya in the Science building over a period of time “.
1 -4: Observational and Experimental Studies 2 - Experimental Studies: the researcher manipulates one of the variables and tries to determine how the manipulation influences other variables. For example: patients were randomly assigned into 2 groups. The first one was given drug A and other was given drug B to determine if the drug has an effect patient’s blood pressure.
quasi-experimental study. In a true experimental study, the subjects should be assigned to groups randomly. If this is not possible and a researcher uses intact groups, then he is performing a quasi-experimental study.
1 -4: Observational and Experimental Studies • In the sit up study , there are two group: 1 - Treatment group: was a group that received the special instruction. • 2 - Control group: didn't receive the special instruction.
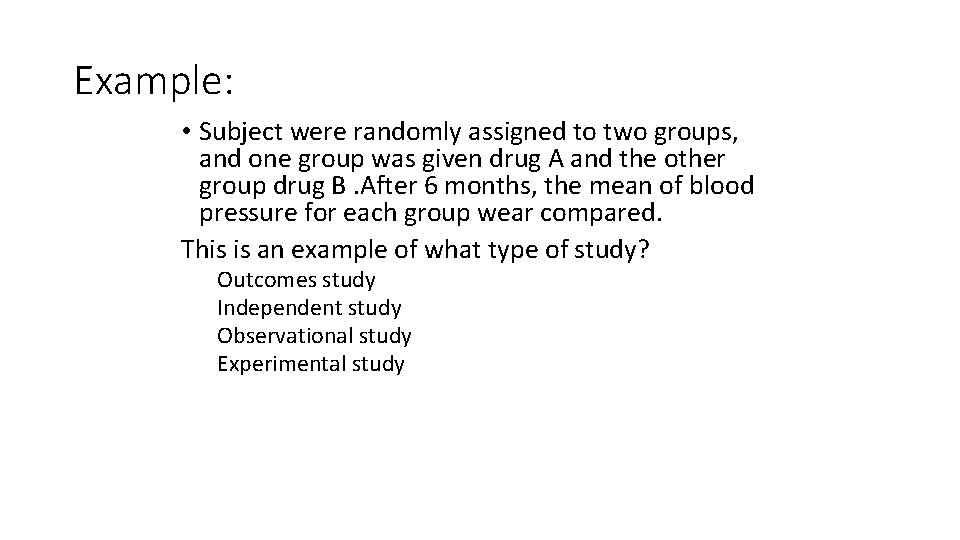
Example: • Subject were randomly assigned to two groups, and one group was given drug A and the other group drug B. After 6 months, the mean of blood pressure for each group wear compared. This is an example of what type of study? Outcomes study Independent study Observational study Experimental study
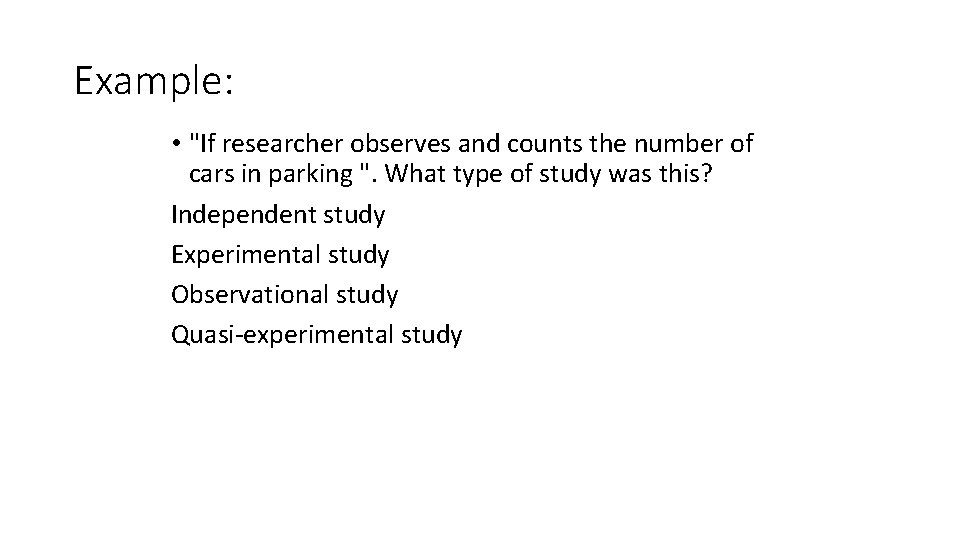
Example: • "If researcher observes and counts the number of cars in parking ". What type of study was this? Independent study Experimental study Observational study Quasi-experimental study
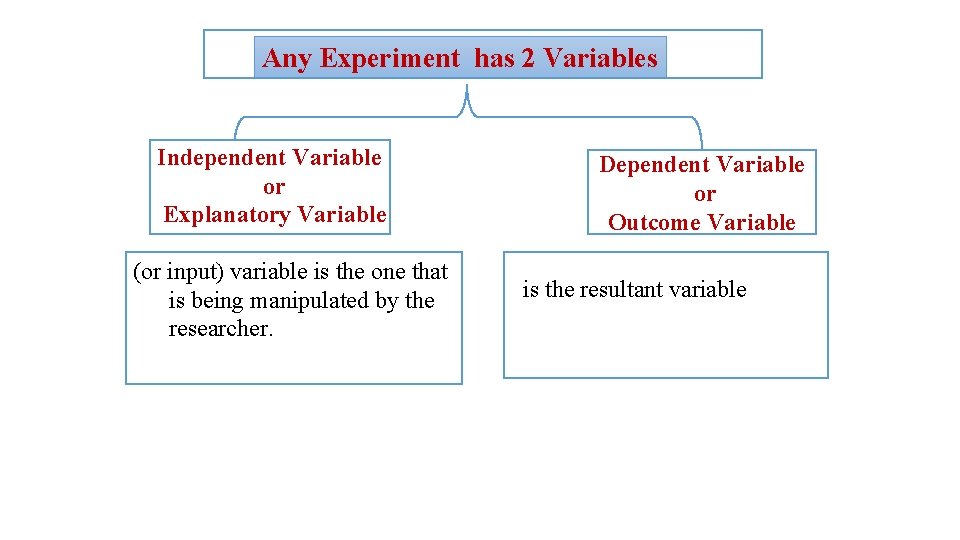
Any Experiment has 2 Variables Independent Variable or Explanatory Variable (or input) variable is the one that is being manipulated by the researcher. Dependent Variable or Outcome Variable is the resultant variable
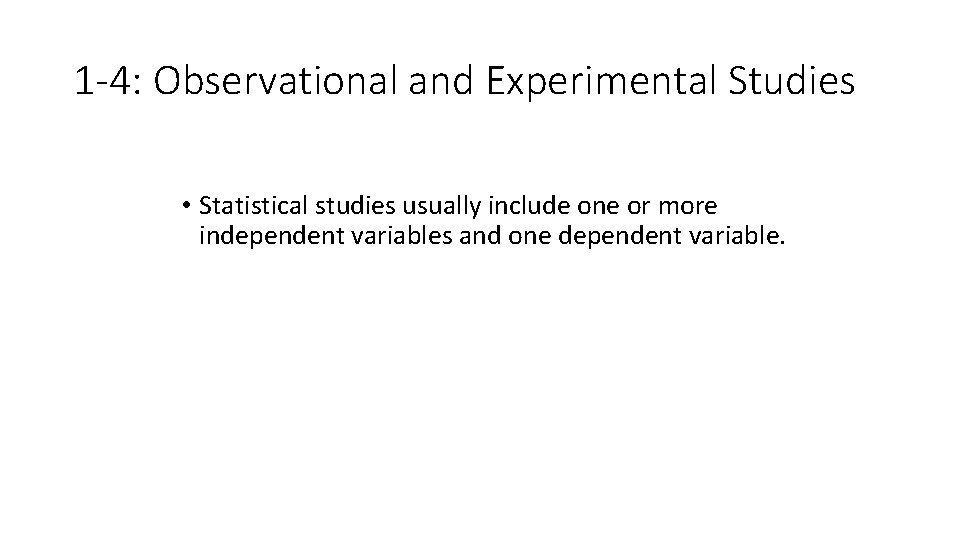
1 -4: Observational and Experimental Studies • Statistical studies usually include one or more independent variables and one dependent variable.
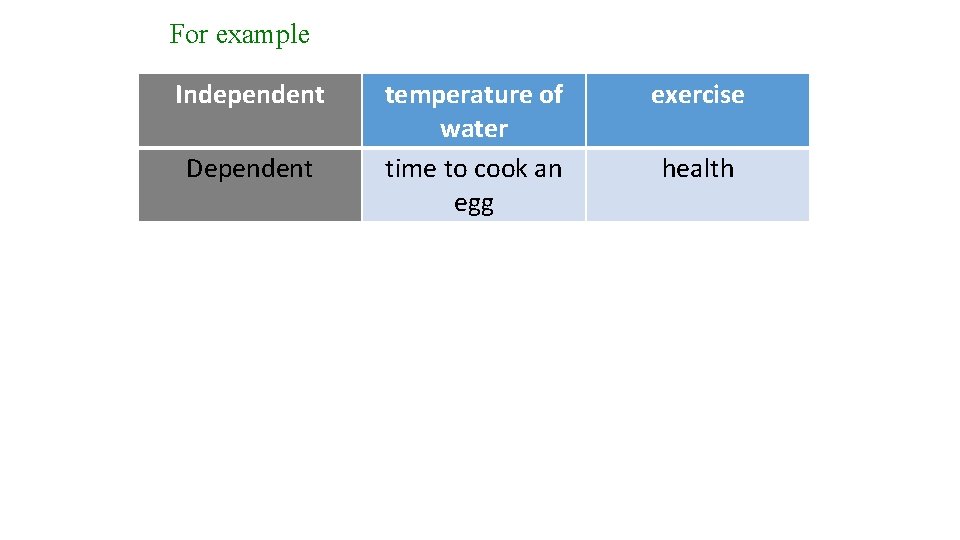
For example Independent Dependent temperature of water time to cook an egg exercise health
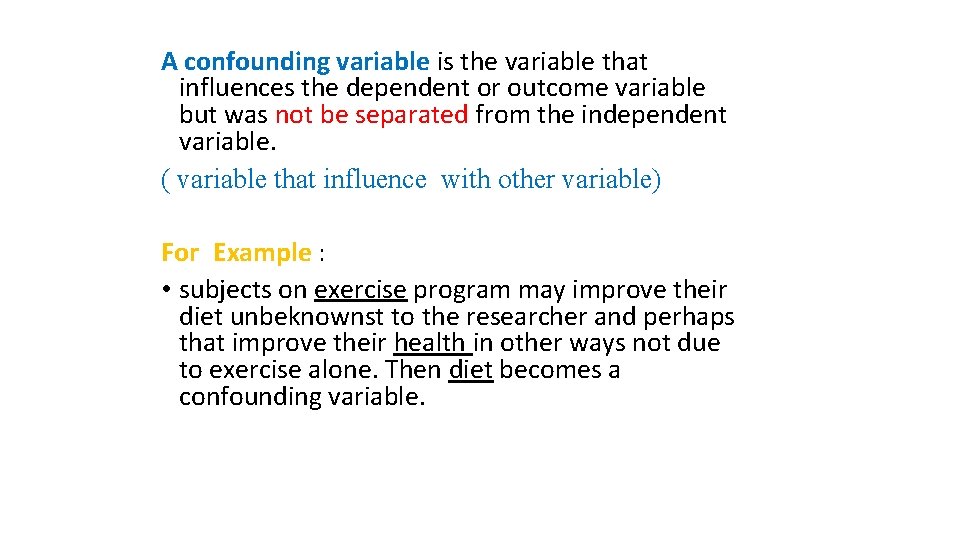
A confounding variable is the variable that influences the dependent or outcome variable but was not be separated from the independent variable. ( variable that influence with other variable) For Example : • subjects on exercise program may improve their diet unbeknownst to the researcher and perhaps that improve their health in other ways not due to exercise alone. Then diet becomes a confounding variable.
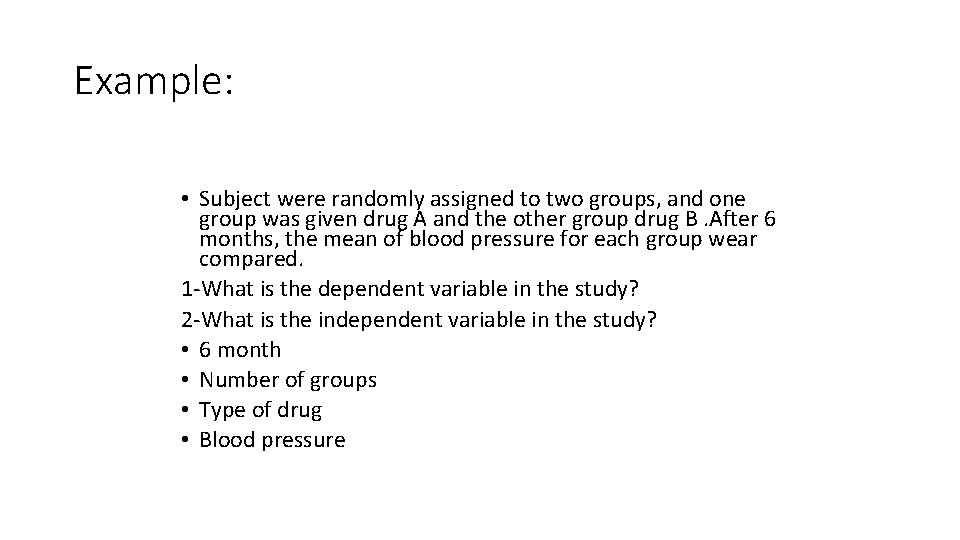
Example: • Subject were randomly assigned to two groups, and one group was given drug A and the other group drug B. After 6 months, the mean of blood pressure for each group wear compared. 1 -What is the dependent variable in the study? 2 -What is the independent variable in the study? • 6 month • Number of groups • Type of drug • Blood pressure
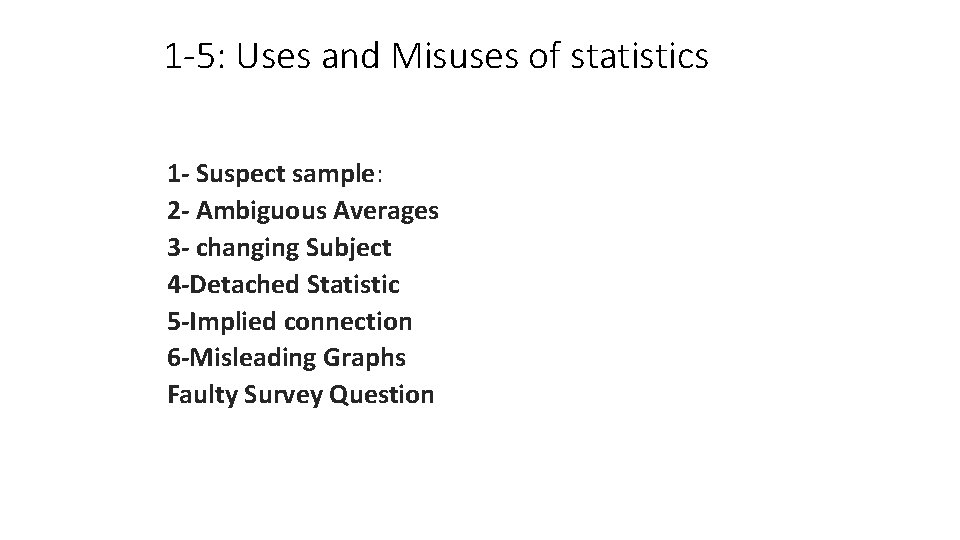
1 -5: Uses and Misuses of statistics 1 - Suspect sample: 2 - Ambiguous Averages 3 - changing Subject 4 -Detached Statistic 5 -Implied connection 6 -Misleading Graphs Faulty Survey Question
1 - Suspect sample: -small samples -convenience sample - volunteer sample For example: ” if 4 doctors were surveyed from 100 doctors”. 2 - Ambiguous Averages: measures that are loosely called averages are the mean, median, mode and midrange. People who know this can without lying , select one of them to support their position.
3 - changing Subject : can occur when different values are used to represent the same data. For example: if one political candidate say “ I will increase salaries a mere 3%” And another one say “I will increase salaries a whapping 6, 000 $” And 3% =6, 000 4 -Detached Statistic: it is the one in which no comparison is made. For example, one may say that “Our cookies has one-third fewer calories” Here, fewer than what?
5 -Implied connection : Usage of words such as may, suggest or some that imply connections but there is no guarantee For example: ” Eating fish may help to reduce your cholesterol”. “studies suggest that using our machine will reduce your weight” “ Taking calcium will lower blood pressure in some people”
6 -Misleading Graphs: if graphs are drawn inappropriately, they can misrepresent the data and lead to false conclusions. 7 - Faulty Survey Question : should be sure that the questions are properly written since the way questions are phrased can influence the way people answer them. For example: What is your opinion about WHO Organization?
- Slides: 56