GENEENVIRONMENT INTERACTIONS GeneEnvironment Interactions Complex diseases result from


 G+E+ 25")


 NAT 2")
")


-by exposure (E) test International Journal")


 • Focus on population-based research")


.")


- Slides: 54
GENE-ENVIRONMENT INTERACTIONS
Gene-Environment Interactions • Complex diseases result from an interplay of genetic and environmental factors • Why study Gene-environment Interactions (Gx. E)? • Studies of Gx. E may help identify and characterize genetic and environmental effects. • Studies of Gx. E may improve our understanding of biological mechanisms. • Studies of Gx. E may identify sub-groups for targeted interventions or screening. • Term “Gx. E” is often used for both biological and statistical interactions. As with other studies of interactions the two concepts are often conflated.
What is Meant by Interaction? • Biological Interaction • The interdependent operation of two or more biological causes to produce, prevent or control an effect • Interdependency among the biologic mechanisms of actions for two or more exposures through common pathways, protein complexes or biological products. • Statistical Interaction • The observed joint effects of two factors differs from that expected on the basis of their independent effects • Deviation from additive or multiplicative joint effects • Effect Modification (or Effect Measure Modification) • Differences in the effect measure for one factor at different levels of another factor • Example: OR differs for males vs. females; AR differs for premenopausal and post-menopausal women, etc.
Biological Interaction Example: PKU • Phenylketonuria • Interaction between TERATOGENIC! diet and genetic factor • Can modify diet to address outcomes. http: //medical-dictionary. thefreedictionary. com/phenylketonuria; Scriver CR (2007) Hum Mutat
Statistical Gx. E Interaction • This lecture will focus on methods for statistical interaction/effect modification. • Keep in mind these interactions often do not have straightforward biologic interpretation, although some argue for links. • Non additive effects may imply non-independence of biologic mechanism of actions • Weinberg (1986), Vander. Weele (2008 -) • Multiplicative model may correspond to independent effects on multiple steps of a multi-step carcinogenic model • Siemiatycki and Thomas (1981)
Effect Measure Modification
Venous Thrombosis • Generally manifests as thrombosis of deep leg veins or pulmonary embolism • Incidence in women age 20 -49 yrs is ~ 2 /10, 000 persons/yr • Case fatality rate is ~ 1% to 2% • Association between oral contraceptive pill (OCP) and VT: Incidence of VT is ~12 to 34 / 10, 000 in OCP users
Factor V Leiden Mutations • R 506 Q mutation – amino acid substitution • Geographic variation in mutation prevalence • Frequency of the mutation in populations of European descent is~2% to 10% • Rare in African and Asians • Relative risk of VT among carriers • 3 - to 7 -fold higher than non-carriers • Is there a gene-environment interaction?
OCP, Factor V Leiden Mutations and Venous Thrombosis Strata Cases Controls G+E+ 25 2 G+E- 10 4 G-E+ 84 63 G-E- 36 100 Total 155 169 OR (95% CI) OR for G in E+ (25*63)/(2*84) 9. 4 (2. 1 -41. 1) OR for G in E(10*100)/(4*36) 6. 9 (1. 8 -31. 8) Lancet 1994; 344: 1453
Alternative way of looking at ORs Strata Cases Controls OR (95% CI) G+E+ 25 2 34. 7 (7. 8, 310. 0) G+E- 10 4 6. 9 (1. 8, 31. 8) G-E+ 84 63 3. 7 (1. 2, 6. 3) G-E- 36 100 Total 155 169 Reference Lancet 1994; 344: 1453
Interactions are Scale Dependent E=0 E=1 G=0 G=1 1. 0 RRE RRGE Multiplicative model No Interaction: RRGE= RRG× RRE Relative-risk associated with E is the same by levels of G and reverse Interaction Relative Risk =RRGE/(RRG× RRE) Additive model No Interaction: RRGE= RRG+ RRE-1 Risk-difference associated with E is the same by levels of G and reverse Relative Excess Risk due to Interaction (RERI) =RRGE- RRG- RRE+1
Expectations Using Different Scales Measurement Scale and Interaction Effect Cohort Study Case-control study* No Interaction RRGE=RRGx. RRE ORGE=ORGx. ORE Synergistic Interaction RRGE>RRGx. RRE ORGE>ORGx. ORE Antagonistic Interaction RRGE<RRGx. RRE ORGE<ORGx. ORE No Interaction RRGE=RRG+RRE-1 ORGE=ORG+ORE-1 Synergistic Interaction RRGE>RRG+RRE-1 ORGE>ORG+ORE-1 Antagonistic Interaction RRGE<RRG+RRE-1 ORGE<ORG+ORE-1 Multiplicative Scale Additive Scale * Formulas for the ORs are approximations based on the approximation of the OR to the RR Adapted from “Genetic Epidemiology: Methods and Applications”. Austin 2013.
OCP, Factor V Leiden Example E=0 E=1 G=0 G=1 1. 0 RRE=3. 7 RRG=6. 9 RRGE=34. 7 Multiplicative model Interaction Relative Risk: RRGE/RRG× RRE 34. 7 / 6. 9 x 3. 7 = 1. 4 Additive model Relative Excess Risk due to Interaction (RERI): RRGE- RRG- RRE+1 34. 7 – (6. 9 + 3. 7 - 1) = 25. 1
NAT 2, smoking and bladder Cancer (Garcia-Closas et al. , Lancet, 2005) NAT 2 rapid/intermediate NAT 2 slow Never-smoker 1. 0 0. 9 (0. 6 -1. 3) Ever-smoker 2. 9 (2. 0 -4. 2) 4. 6 (3. 2 -6. 6) No effect of NAT 2 in the absence of smoking
Kraft and Hunter (2010)
Multiplicative vs. Additive Interactions • Multiplicative • widely used in practice • partly due to popularity of logistic regression models • do not necessarily have mechanistic interpretation • large sample size is needed to ensure sufficient power • has been the focus of recent methodologic developments • case-only, empirical-Bayes, two-stage etc. • Additive model • much less widely used (although • has direct relevance for evaluation of targeted intervention and links with mechanistic interaction under the sufficient component framework • Power is often higher than tests for multiplicative interaction
Aside: Interaction in a Regression Setting G 1 if carrier 0 if non-carrier E 1 if exposed 0 if unexposed Risk of disease p. GE = b 0 + bg G + be E + bge GE Log odds of disease p. GE log 1 -p = 0 + g G + e E + ge GE GE Test for “additive interaction: ” H 0 is bge=0 Test for “(multiplicative) interaction: ” H 0 is ge=0 (Interaction OR e^ ge=1)
IN CLASS EXERCISE
Gene-Environment-Wide Interaction Study • “GEWIS” • Motivated by discovery • Builds on the genome- wide association study model • Gene (G) x environmental factor (E) on a SNP-by-SNP basis across the genome Schunkert et al. . Eur Heart J. 2010; 31: 918 -925.
Gene-Environment-Wide Interaction Study • “GEWIS” • Motivated by discovery • Builds on the genome- wide association study model • Gene (G) x environmental factor (E) on a SNP-by-SNP basis across the genome Schunkert H et al. Eur Heart J 2010; eurheartj. ehq 038 Schunkert et al. . Eur Heart J. 2010; 31: 918 -925.
Some of the Challenges in “GEWIS” • Power for discovery: • False-negative findings • Individual studies with low sample sizes • Multiple comparisons (multiple G, E and models) • Characterizing and modeling non-genetic risk factors: • Time dependency • Measurement error • Multi-faceted • Interpretation of significant findings: • Biological plausibility in an agnostic approach • Heterogeneity and replication • Translation to clinical or public health relevance Thomas D. Nat Rev Genet. 2010; 11: 259 -72; Dempfle A. et al. , Eur J Hum Genet 2008; 16: 1164 -1172.
Goals • Identify methods with high power • Reduce number of false positives
Approaches for GEWIS • Multifactor dimension reduction, and other machine learning techniques • Pathway/hierarchical models • Family based tests • Additive models • Logistic regression-based tests for multiplicative interactions
Methods for Gx. E • See full table in Hutter et al. Genet Epidemiol. 2013 Nov; 37(7): 643 -57. doi: 10. 1002/gepi. 21756.
Logistic Regression Based Methods for Multiplicative Gx. E Method Key Details Case-control Robust model; Does not assume G-E independence; low power for discovery. Case-only Gains in power and efficiency under G-E independence. Data-adaptive estimators (e. g. Increased power versus case-control and Empirical Bayes and improved control of type 1 error versus case-only. Bayesian Model Averaging) Two-step procedures Screening step and testing step. Maintains type 1 error and provides power gain under many settings. Joint-test of genetic main effect and Gx. E (2 degree of freedom tests) Tests null hypothesis that genetic marker is not associated with disease in any stratum defined by exposure. Modified from Mukherjee et al. Am J. of Epidemiology. 2012; 175(3): 177 -190.
Case-only Design • Case-only approach tests the association between the genotype and exposure in the cases only. • Has higher statistical power than standard case-control method with same number of cases. • Relies on assumption that genetic and environmental factors are independent in the source population. • Increased false-positive rate if assumption is violated.
2 x 2 x 2 Representation of Unmatched Case-Control Study Examined by Standard Test for Gx. E Interaction OR(Gx. E) = OR(G-E|D=1)/OR(G-E|D=0). Assuming OR(G-E|D-0)=1 greatly reduces the variability in OR(Gx. E). The case-only estimate of OR(Gx. E) is ag/ce. Piegorsch (1994)
Extensions of Case-only method. • The gain in power comes from the assumption of G-E independence, not the fact that only cases are used. • Can build assumption into the analysis of case-control data. • allow for estimation of main effects • Allow for estimates/tests of interaction effects other than multiplicative odds model. • See Han et al. AJE 2012. • “Hedge” methods weighted towards case-only method if data supports independence assumption, towards case-control method if assumption appears to be violated. • Emperical Bayes, model averaging methods • Mukherjee et al 2012; Li and Conti 2009 • Use of case-only design and/or G-E independence assumption in new methods for large-scale Gx. E analysis
Two-Step Methods Step 1: Screening Step Prioritize SNPs for testing: • Correlation between G and E in full sample of cases and controls • Marginal association between G and outcome (D) • Hybrid approaches Step 2: Testing Step Test for interaction in prioritized SNPs with appropriate significance levels. Hybrid approach proposed by Murcray et al 2011. Murcray CE, et al. Am J Epidemiol 2009; 169: 219 -226. Murcray CE, et al. Genet Epidemiol 2011; 35: 201 -210. Kooperberg C and Leblanc M. Genet Epidemiol. 2008; 32: 255 -63.
Modules Framework for Gx. E Methods Module A: Screening • No Screening • Marginal (G-D association) • Correlation (G-E) • Hybrid approaches Module B: Multiple Comparisons • Bonferroni testing • Permutations • Weighted hypothesis testing Module C: Testing • • Case-control Case-only Empirical Bayesian Model Averaging Modified from Hsu et al. Genetic Epidemiology 2012; in press.
Power Considerations • Rule of thumb is that tests of interactions need sample sizes 4 times larger than tests of main effects. • All methods require large sample sizes (on the order of 10, 000 cases) for reasonable effect sizes. • The most powerful method depends on assumptions on underlying interaction. • Hybrid and cocktail methods tend to be relatively powerful over a wider variety of types of interactions. G, E neg. correlated G, E independent G, E pos. correlated Mukherjee B et al. Am. J. Epidemiol. 2012; 175: 177 -190
Practical Considerations • Choosing optimal alpha/weights • Case: control ratio • Linkage disequilibrium between top SNPs • Computational needs Emperical power for two-step methods for diffferent alpha thresholds as a function of the ratio of cases to controls(no/n 1). N 1=2, 000; Rge=1. 8; Pr(E)=0. 5. Thomas D, et al. Am. J. Epidemiol. 2012; 175: : 203 -7.
Software for analysis Software Good for URL PLINK GWAS, data handling, GE test, joint test http: //pngu. mgh. harvard. edu/~purcell/p link/ Prob. ABEL GWAS, computes robust variance-covariance matrix http: //www. genabel. org/packages/Prob ABEL Gx. Escan R script incorporating multiple GWAS Gx. E tests http: //biostats. usc. edu/software Multassoc Test a group of SNPs taking interaction with other G, E into account http: //dceg. cancer. gov/tools/analysis/ multassoc R Flexible, write your own scripts http: //www. r-project. org/ METAL Meta-analysis http: //www. sph. umich. edu/csg/abecasi s/metal/
Extending beyond single SNP models genetic risk score (GRS)-by exposure (E) test International Journal of Epidemiology, 2017, 1– 11; doi: 10. 1093/ije/dyw 318
International Journal of Epidemiology, 2017, 1– 11; doi: 10. 1093/ije/dyw 318
Extending beyond single SNP models • Tomorrow we will discuss approaches for rare variant discovery • Additional methods are being developed to consider Gx. E in the context of rare variants (gene or set based approaches)
EPIDEMIOLOGY OF GXE
Different Motivations for Studying Gx. E DISCOVERY CHARACTERIZATION • Identify novel loci • Describe interaction • Focus on variants that • Focus on putative and would not be found in marginal search alone established variants • Priority given to power • Hypothesis generating descriptive model • Provides etiologic insight
Genetic Epidemiology with a Capital “E” Thomas DC (2000) • Focus on population-based research • Joint effects of genes and the environment • Incorporation of underlying biology Khoury MJ (2011) • Large scale harmonized cohorts and consortia • Multilevel factors (includes Gx. E and more) across the lifestyle • Incorporation of underlying biology • Integrating, evaluating and translating knowledge Slide by Muin Khoury
Sources of Bias in Epidemiology • Selection Bias • Arises from issues in case/control ascertainment • Information Bias • Arises from measurement error or misclassification in assessing factors of interest. • Confounding • Arises when there is an extraneous disease risk factor that is also associated with exposure and not in the causal pathway. Manolio et al. Nat Rev Genet. 2006. 7: 812 -820.
Sources of Bias in G and Gx. E Method Key Considerations Selection Bias • • Issues of poor control selection and incomplete case ascertainment. Need to consider non-respondants, people who refuse or are unable to provide DNA/data Information Bias • • • Errors in questionnaire, specimen handling Highlights importance of lab QC Can impact type I and type II error for Gx. E Confounding • • • Population stratification for G “Traditional” factors for E Under certain conditions “confounders” can bias the interaction term (see, for example, Tchetgen Tchtgen and Vander. Weele 2012). • Concerns of all three of these factors increase when examining Gx. E in existing genetic studies that used “convenient controls”. • Presence of these biases may contribute to disparate findings in literature and issues in replication. Modified from Garcia-Closas et al. in Human Genome Epidemiology. 2004.
Challenges to Investigations of GXE “Data harmonization, population heterogeneity, and imprecise measurements of exposures across studies” Khoury et Al, 2012 “Establishing the existence of and interpreting GXE interactions is difficult for many reasons, including, but not limited to, the selection of theoretical and statistical models and the ability to measure accurately both the G and E components. ” Boffetta et Al, 2012
The Fiddler Crab Analogy* • Issues of imbalance in how we look at G and E • Complications with how we look at E: • Distribution of E • Measurement error • Multi-faceted * Credited to Chris Wild (CEBP, 2005. 14: 1847 -1850) via Duncan Thomas
Measurement Error • Environmental factors are often complex, multifaceted and difficult to measure. • Measurement error can lead to both type I and type II error for Gx. E. • Statistical methods to correct misclassification exist, but are infrequently used for Gx. E. • Measurement error has strong impact on power to detect Gx. E. • Additional issues arise when considering Gx. E across multiple studies
Using Traditional “Environmental Data” in Consortium Settings • Large sample-sizes needed to detect Gx. E: often need to combine data across studies. • Data harmonization is the process of combining information on key data elements from individual studies in a manner that renders them inferentially equivalent.
Harmonization Resources for Phenotype Data • Identify and document a set of core variables • Assess the potential to share each variable between studies • Define appropriate data processing algorithms • Process and synthesize real data. • Develop a recommended minimal set of high priority measures • Toolkit provides standard measures related to complex diseases, phenotypic traits and environmental exposures Fortier I et al. Int. J. Epidemiol. 2011; 40: 1314 -1328 Hamilton CM et al. Am J Epidemiol. 2011; 174: 253 -60.
Some variables are more “harmonizable” than others (Data. SHa. PER approach across 53 studies). Fortier I et al. Int. J. Epidemiol. 2011; 40: 1314 -1328
Trade-offs in Data Harmonization • Cost of collecting rich phenotype information can put restrictions of sample size for detailed measures • Genetic and environmental heterogeneity are likely present in large samples from multiple studies • Combining across studies may require identifying the “least common denominator” • Harmonization can induce misclassification and heterogeneity. Power to detect Gx. E when exposure is measured perfectly or via a good proxy (77% specificity and 99% sensitivity). Interaction OR=1. 35, type 1 error=5 x 10 -8. Bennett SN, et al. Genet Epidemiol. 2011; 35: 159 -173.
Heterogeneity • “If explanations can be found for heterogeneity, there is an opportunity for insights about the complexity of the disease, but spurious inconsistency due to methodological or dataquality differences will just add confusion” - Thomas 2010
Beyond Data Harmonization • We may be missing key environmental factors • Measuring the environment often does not have the same “economy of scale” • The multifactoral and dynamic nature of exposure/risk can complicate the study of environmental factors Rappaport SM and Smith MT. Science 2010; 330: 460 -461.
Summary • Gene-environment wide interaction studies are used for discovery and characterization. • Remember distinction between biological and statistical interaction. • Important to consider scale (additive vs. multiplicative) • Large sample sizes are needed for Gx. E studies, particularly for GEWIS. • Data harmonization allows core variables to be combined across studies. • We need to give the “E” similar, if not more, attention than we give the “G” for Gx. E analysis.
IN CLASS EXERCISE
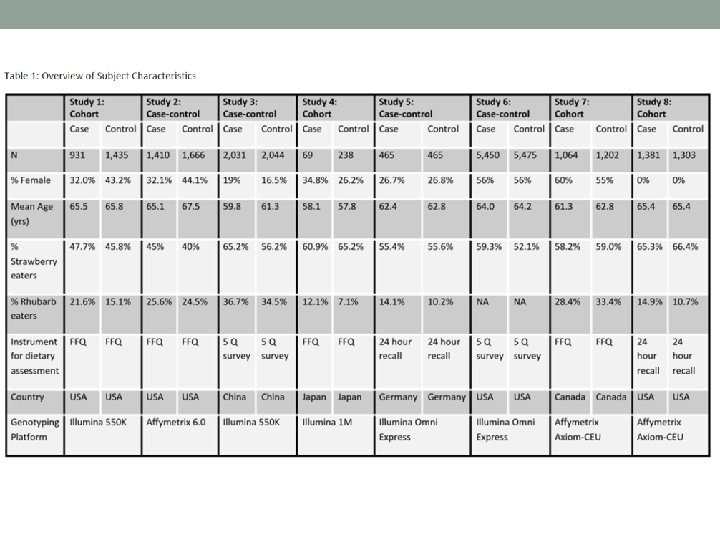
In Class Exercise: • You continue to work with collaborators on the FAKE study. They decide to follow-up on their candidate gene study with a genome-wide association study (GWAS). They were only able to afford genome-wide genotyping on a subset of the subjects, so they decide to reach out to their collaborators in the Meta. Analysis of Diet and Environment for Understanding Phenotypes (MADE-UP) consortia. The next page has “table 1” for the 8 studies in this consortia. Brainstorm with your group about the following: • What are potential issues/challenges that you might encounter in analyzing this data? • What are solutions might you use for some of these challenges? • What additional information would be most helpful for you to have?