Gene Regulation Aug 2015 Stuart M Brown NYUMC

Gene Regulation Aug. 2015 Stuart M. Brown NYUMC Center for Health Informatics & Bioinformatics

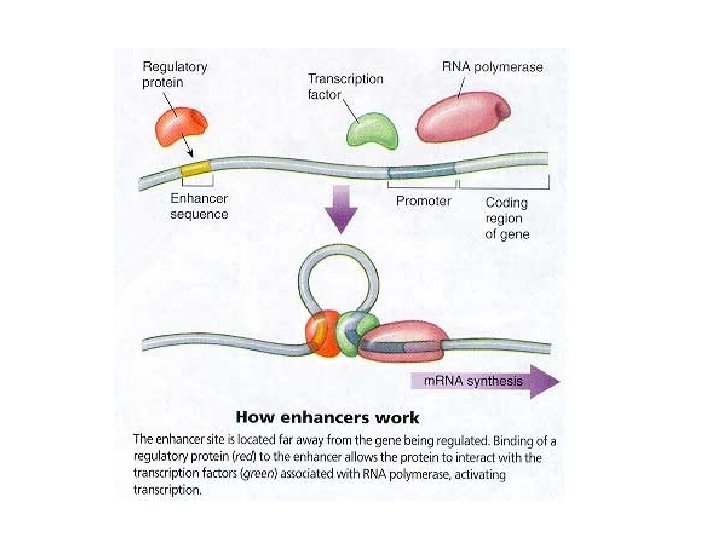
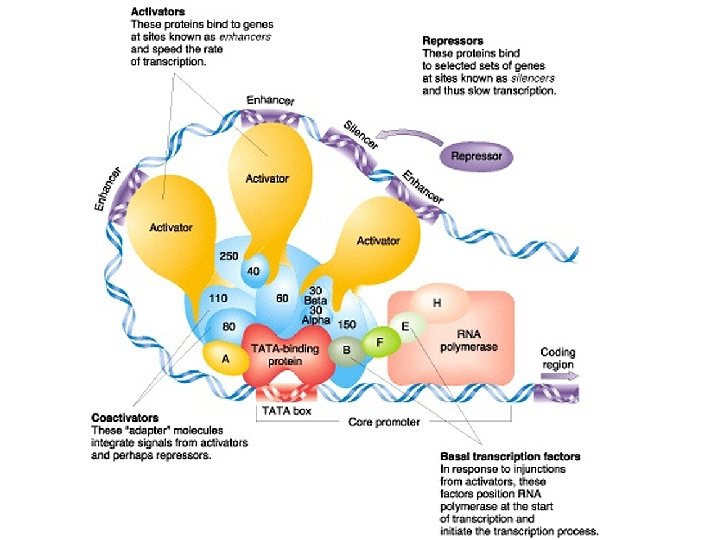
Gene Structure Genes are transcribed by RNA Polymerase II, which recognizes a promoter sequence.

We know something about the sequences of promoters
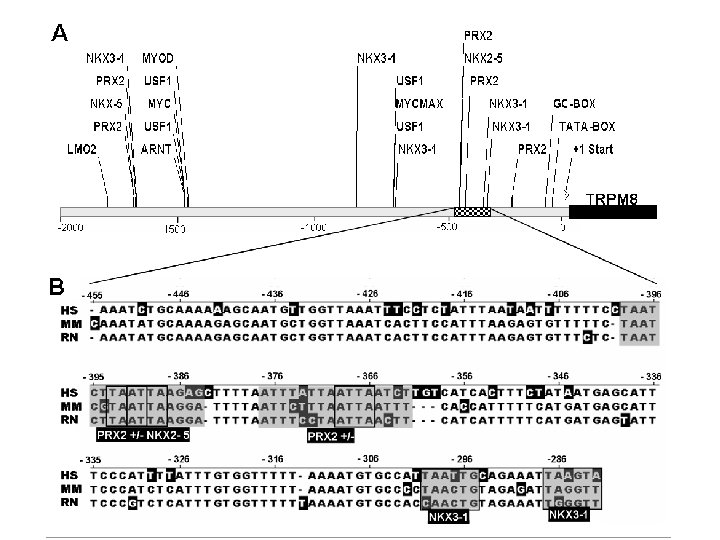

Computational Models of TF Binding Sites , Nature Reviews Genetics 5 276 -287 (April 2004) | doi: 10. 1038/nrg 1315 Applied bioinformatics for the identification of regulatory elements Wyeth W. Wasserman & Albin Sandelin. Nature Reviews Genetics 5, 276 -287 (April 2004) | doi: 10. 1038/nrg 1315

Databases of TF binding sites
 by C. David")
Epigenetics, Cold Spring Harbor Laboratory Press; 2 edition (February 28, 2015) by C. David Allis, Marie-Laure Caparros, Thomas Jenuwein, Danny Reinberg

DNA methylation controls chromatin packing • http: //learn. genetics. utah. edu/content/epigenetics/control

Modified histone proteins Epigenetics. Copyright 2007 Cold Spring Harbor Laboratory Press.

Open vs. Closed Chromatin

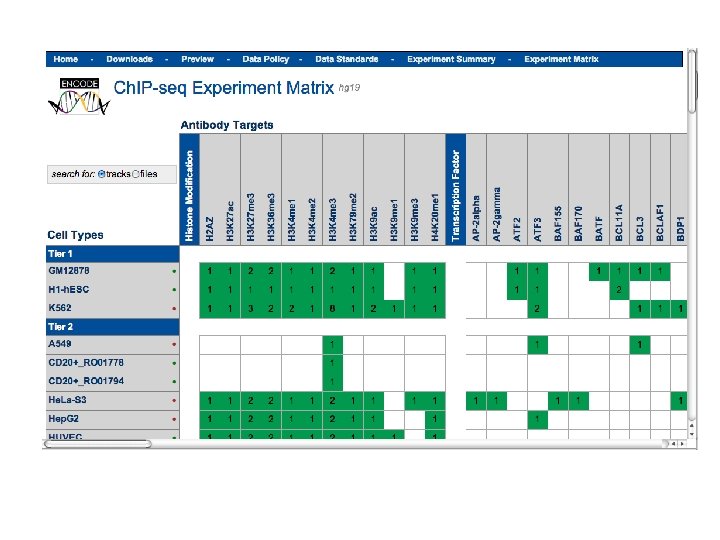
ENCODE Project: Identify DNA functional elements

ENCODE = TF + Epi + Expression • ENCODE is a huge collection of experimental data • Many cell lines (mostly human, mostly cancer) • Many TF factors, assayed by Ch. IP-seq • Many Histone marks, assayed by Ch. IP-seq • DNA methylation • DNAse sensitivity (several assays) • Chromatin 3 D structure, assayed by 5 C & Hi-C • Gene expression, assayed by RNA-seq

Ch. IP-seq Immunoprecipitate High-throughput sequencing Map sequence tags to genome Release DNA
 Jothi, et al. Genome-wide identification of in vivo")
Ch. IP-seq for TF (SISSRS software) Jothi, et al. Genome-wide identification of in vivo protein–DNA binding sites from Ch. IP-Seq data. NAR (2008), 36: 5221 -31

BED format • Processed ENCODE data is mostly available in BED format • • Raw data is also available, usually as FASTQ (very big!) Genome Browsers use a BED format that defines a genomic interval as positions on a reference genome. An interval can be a anything with a location: gene, exon, binding site, region of low complexity, etc. BED files can also specify color, width, some other formatting. chromosome start end chr 1 chr 2 chr 3 213941196 213942363 213943530 158364697 158365864 127477031 127478198 127479365 213942363 213943530 213944697 158365864 158367031 127478198 127479365 127480532 track name="Item. RGBDemo" description="Item RGB demonstration" item. Rgb="On" chr 7 127471196 127472363 Pos 1 0 + 127471196 127472363 255, 0, 0 chr 7 127472363 127473530 Pos 2 0 + 127472363 127473530 255, 0, 0 chr 7 127473530 127474697 Pos 3 0 + 127473530 127474697 255, 0, 0 chr 7 127474697 127475864 Pos 4 0 + 127474697 127475864 255, 0, 0 chr 7 127475864 127477031 Neg 1 0 - 127475864 127477031 0, 0, 255 chr 7 127477031 127478198 Neg 2 0 - 127477031 127478198 0, 0, 255 chr 7 127478198 127479365 Neg 3 0 - 127478198 127479365 0, 0, 255 chr 7 127479365 127480532 Pos 5 0 + 127479365 127480532 255, 0, 0

Robert Kuhn, University of California Santa Cruz Human Genome Meeting, April 29, 2014 Geneva, Switzerland
 Peaks format This format is used to provide")
ENCODE narrow. Peak: Narrow (or Point-Source) Peaks format This format is used to provide called peaks of signal enrichment based on pooled, normalized (interpreted) data. It is a BED 6+4 format. 1. chrom - Name of the chromosome (or contig, scaffold, etc. ). 2. chrom. Start - The starting position of the feature in the chromosome or scaffold. The first base in a chromosome is numbered 0. 3. chrom. End - The ending position of the feature in the chromosome or scaffold. The chrom. End base is not included in the display of the feature. For example, the first 100 bases of a chromosome are defined as chrom. Start=0, chrom. End=100, and span the bases numbered 0 -99. 4. name - Name given to a region (preferably unique). Use '. ' if no name is assigned. 5. score - Indicates how dark the peak will be displayed in the browser (0 -1000). If all scores were '0' when the data were submitted to the DCC, the DCC assigned scores 1 -1000 based on signal value. Ideally the average signal. Value per base spread is between 100 -1000. 6. strand - +/- to denote strand or orientation (whenever applicable). Use '. ' if no orientation is assigned. 7. signal. Value - Measurement of overall (usually, average) enrichment for the region. 8. p. Value - Measurement of statistical significance (-log 10). Use -1 if no p. Value is assigned. 9. q. Value - Measurement of statistical significance using false discovery rate (-log 10). Use -1 if no q. Value is assigned. 10. peak - Point-source called for this peak; 0 -based offset from chrom. Start. Use -1 if no point-source called. Here is an example of narrow. Peak format: track type=narrow. Peak visibility=3 db=hg 19 name="n. Pk" description="ENCODE narrow. Peak Example" browser position chr 1: 9356000 -9365000 chr 1 9356548 9356648. 0. 182 5. 0945 -1 50 chr 1 9358722 9358822. 0. 91 4. 6052 -1 40 chr 1 9361082 9361182. 0. 182 9. 2103 -1 75

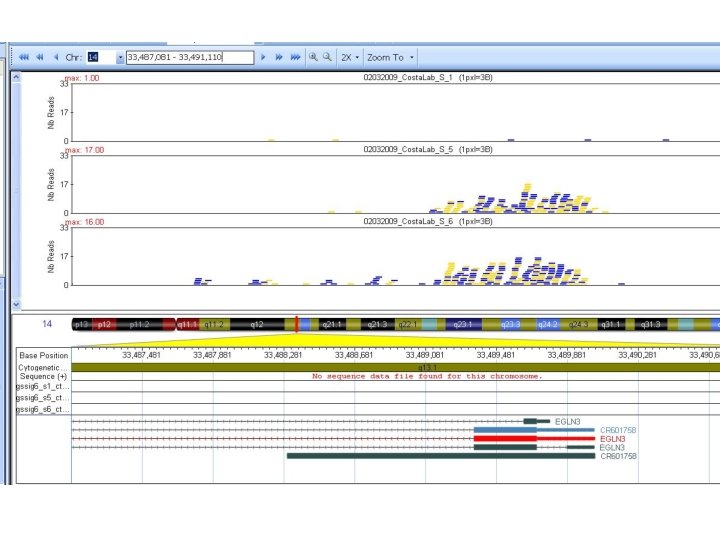
ENCODE data in the UCSC Genome Browser
 to regulation of gene expression")
Gene Regulation Challenges • Relate TF binding sites (TFBS) to regulation of gene expression (find TF targets): – Known consensus TFBS near promoter of gene – Ch. IP data shows binding of TF near gene – Gene expression – correlation of TB binding with gene expr. – correlation of TF expr. with gene expr. – knockout or overexpression of TF changes gene expr. – Known pathway with known regulators (ontology) – 3 D folding data shows interaction of enhancer with gene promoter

Additional data • Epigenetic marks consistent with TF binding • DNAse sensitivity • Unmethylated DNA • Histone marks associated with TF binding • Cooperative binding between TFs (multiple nearby or overlapping TFBS) • Evolutionary conservation of TFBS

Problems • All TF related data has issues • Computational predictions of TFBS have a high false positive rate – the pattern is present, but not bound by the TF. • Any set of experimental data is collected on one cell type under one set of growth conditions. • ENCODE may not have done your favorite cell type with your favorite TF. • Ch. IP data has false positives (non-specific binding or enrichment), and false negatives (TF not bound at a site in the DNA of this sample). • Correlation between level of TF protein and expression of target gene may be mediated by other factors, not direct binding to a TFBS associated with that gene. (correlation does not equal causation) • TFBS (especially enhancer sites) may not regulate the closest gene (need 3 D looping data)

• • BEDTools bedtools: a powerful toolset for genome arithmetic¶ Collectively, the bedtools utilities are a swiss-army knife of tools for a wide-range of genomics analysis tasks. The most widely-used tools enable genome arithmetic: that is, set theory on the genome. For example, bedtools allows one to intersect, merge, count, complement, and shuffle genomic intervals from multiple files in widely-used genomic file formats such as BAM, BED, GFF/GTF, VCF. While each individual tool is designed to do a relatively simple task (e. g. , intersect two interval files), quite sophisticated analyses can be conducted by combining multiple bedtools operations on the UNIX command line. $ bedtools intersect -a exp 1. bed -b exp 2. bed -f 0. 50 -r > both. bed
 • A unique feature of Galaxy is the large number")
Galaxy Interval Overlap (Join) • A unique feature of Galaxy is the large number of tools for performing operations on genomic intervals. These include intersect, subtract, complement, merge, concatenate, cluster, coverage, base coverage, and join. Some operations are analogous to relational database queries, such as join and coverage. Using Galaxy to Perform Large-Scale Interactive Data Analyses Hillman-Jackson J, Clements D, Blankenberg D, Taylor J, Nekrutenko A; Galaxy Team. Using Galaxy to perform large-scale interactive data analyses. Curr Protoc Bioinformatics. 2012 Jun; Chapter 10: Unit 10. 5 http: //onlinelibrary. wiley. com/doi/10. 1002/0471250953. bi 1005 s 38/full

Cell-type Specific Enhancers • Enhancers are DNA sites, somewhat distant from gene TSS, where multiple TFs bind. • Enhancers are often cell-type specific. So even though a site has a TF binding sequence, it is only used in some types of cells. • This cell-type specificity may be due to interaction between TFs, or due to epigenetic changes at the site (DNA is inacessible).

Your Challenge • Pick a TF in ENCODE data • Study interactions with at least 2 other data sets: • Known gene promoter/TSS regions (promoter vs enhancer) • Binding sites for other TFs • DNAse sensitive sites • Histone marks • evolutionary conservation of sites • Determine if interactions are cell-type specific • I’m interested in Estogen Receptor (ESR 1).
- Slides: 29