
Gender Family Some Biological Differences Similarities Both are

Gender & Family

Some Biological Differences & Similarities Both are “social” ◦ Boys in larger groups Girls ◦ Greater verbal ability Boys ◦ Greater visual-spatial ability ◦ More aggressive

Sex & Gender Sex = biological fact Gender = cultural & social-psychological fact ◦ Culture & Society assign gender-specific psychological & personality traits We learn to be male & female in distinctive ways (socialization)

Stereotyping Men: active, intelligent, rational Women: passive, nurturing, emotional “Culture Lag” ◦ William Ogburn
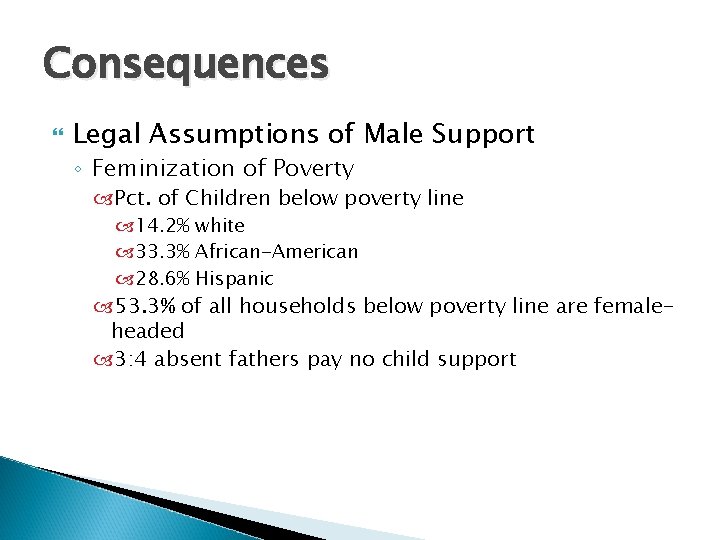
Consequences Legal Assumptions of Male Support ◦ Feminization of Poverty Pct. of Children below poverty line 14. 2% white 33. 3% African-American 28. 6% Hispanic 53. 3% of all households below poverty line are femaleheaded 3: 4 absent fathers pay no child support
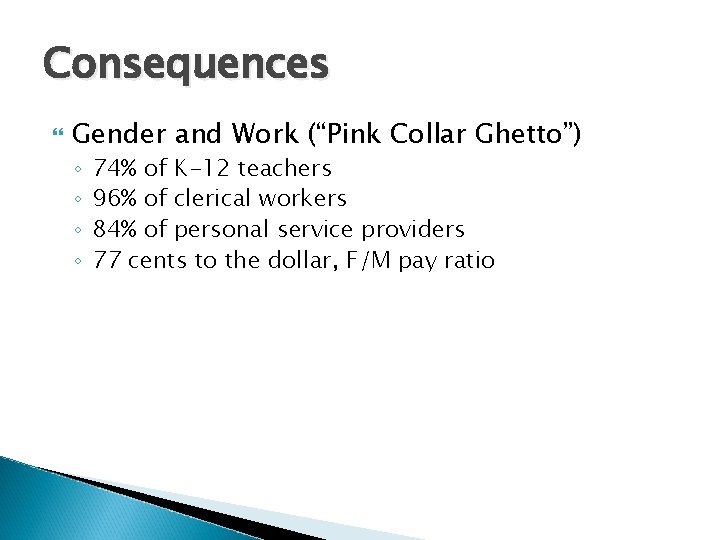
Consequences Gender and Work (“Pink Collar Ghetto”) ◦ ◦ 74% of K-12 teachers 96% of clerical workers 84% of personal service providers 77 cents to the dollar, F/M pay ratio
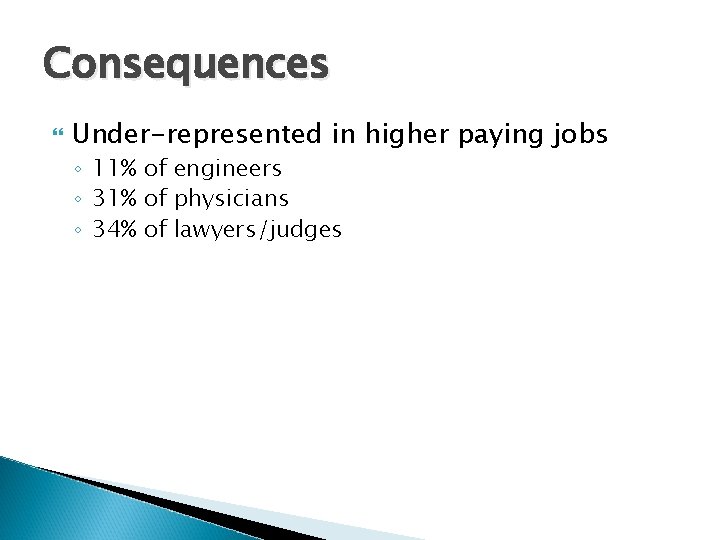
Consequences Under-represented in higher paying jobs ◦ 11% of engineers ◦ 31% of physicians ◦ 34% of lawyers/judges
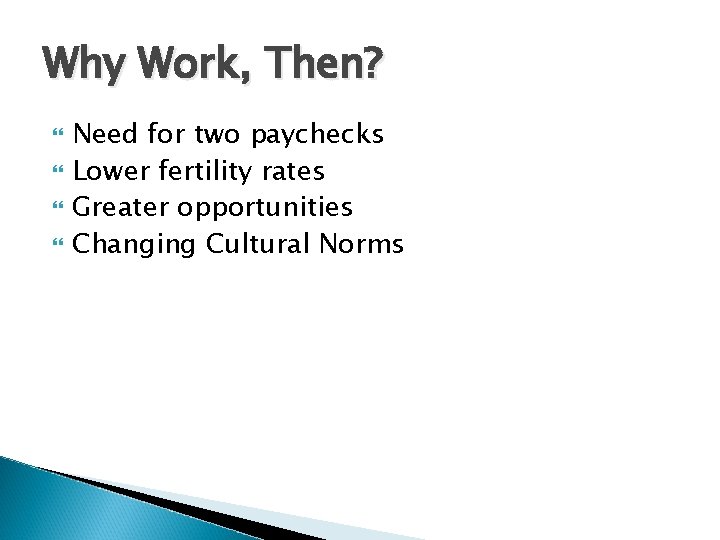
Why Work, Then? Need for two paychecks Lower fertility rates Greater opportunities Changing Cultural Norms

Gender Roles in Transition The “New Woman” ◦ Aspirations Career & Motherhood ◦ “Superwomen” Role strain Poor Fit Between Family & Professional Lives ◦ Loss of seniority
Gender Roles in Transition ◦ No flex time ◦ Maternity and paternity leave ◦ Private, for-profit day care Cost Quality
Gender Roles in Transition Men ◦ Breadwinner “trap” Over-identification with economic position ◦ Emotional under-development
Two Views on Gender & Family Conflict Theory ◦ Division of Sexual Labor Sexual exploitation ◦ Family: “superstructure” Reproduce Legitimate ◦ “Half-selves” Men: control emotions (work)

Two Views on Gender & Family Women: Career aspirations interfere with “primary” purpose Functionalists ◦ Gender roles are efficient Make the most of economic opportunities ◦ As the economy has changed, gender roles have adapted
Impact of Modernity on Family “That institution in society that arranges for: ◦ Regulation of sexual relations Who may have sex with whom? ◦ Child-Rearing Who takes care of the children? ◦ Household Composition” Who lives with whom?
Family (cont’d) Regulation of sexual relations ◦ Incest ◦ Unites previously non-united families Network of social ties Child-Rearing ◦ “Legitimacy” ◦ Lineality: “the path along which a person’s blood & property lines are traced”
Family (cont’d) ◦ Establishes & clarifies a person’s social identity ◦ Grounded in and linked to the social world
Family (cont’d) Household Composition (“Forms” of Family) Shaped by norms guiding mate selection ◦ Monogamy Polygamy (more than one wife) Polyandry (more than one husband)
Family (cont’d) ◦ Exogamy Rules for marrying outside a certain group ◦ Endogamy Rules for marrying inside a certain group ◦ Homogamy Tendency for people from similar backgrounds to mate Love But in cultural, societal, historical context
Family (cont’d) Changes in household composition ◦ Smaller Single parent households Declining fertility ◦ Female Labor Force Participation 60 -70% of moms with school-aged kids Necessity Opportunity (smaller families) Happier marriages, if wife wants to work
Family (cont’d) Changes in household composition ◦ Child care Cost Quality Socialization 60 -65% of pre-schoolers in school Start earlier, stay longer TV: pre-schoolers, 33 hrs. per week
Family (cont’d) New Status of the Child ◦ Fewer kids Expensive ◦ Smaller families, working parents ◦ More attention & resources
Family & Divorce ◦ Rate = No. of divorces/100 married persons
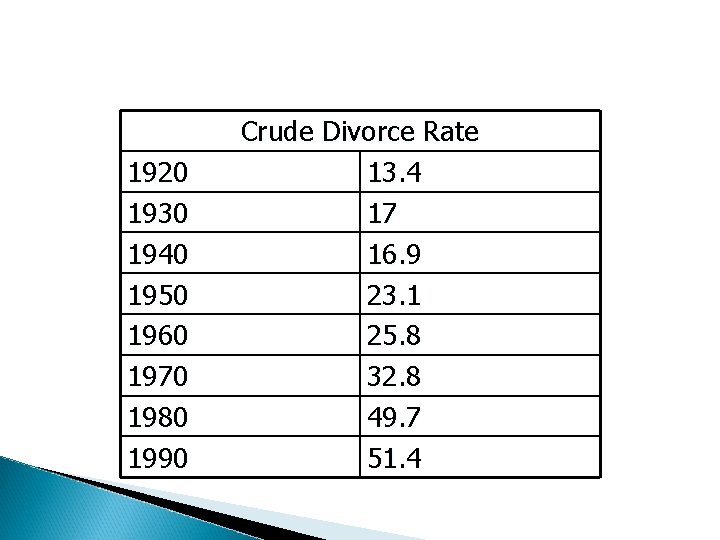
1920 1930 1940 1950 1960 1970 1980 1990 Crude Divorce Rate 13. 4 17 16. 9 23. 1 25. 8 32. 8 49. 7 51. 4
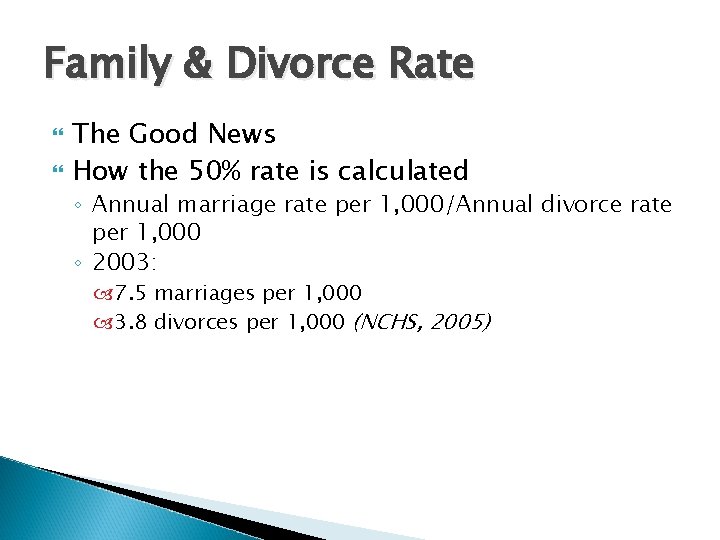
Family & Divorce Rate The Good News How the 50% rate is calculated ◦ Annual marriage rate per 1, 000/Annual divorce rate per 1, 000 ◦ 2003: 7. 5 marriages per 1, 000 3. 8 divorces per 1, 000 (NCHS, 2005)
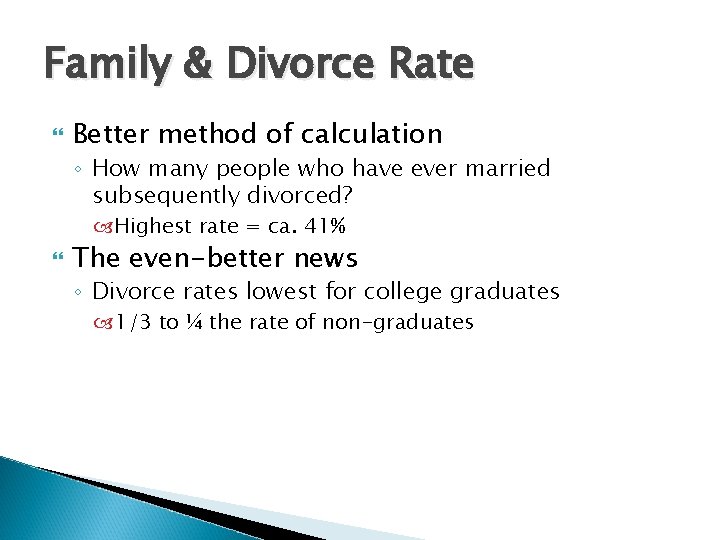
Family & Divorce Rate Better method of calculation ◦ How many people who have ever married subsequently divorced? Highest rate = ca. 41% The even-better news ◦ Divorce rates lowest for college graduates 1/3 to ¼ the rate of non-graduates
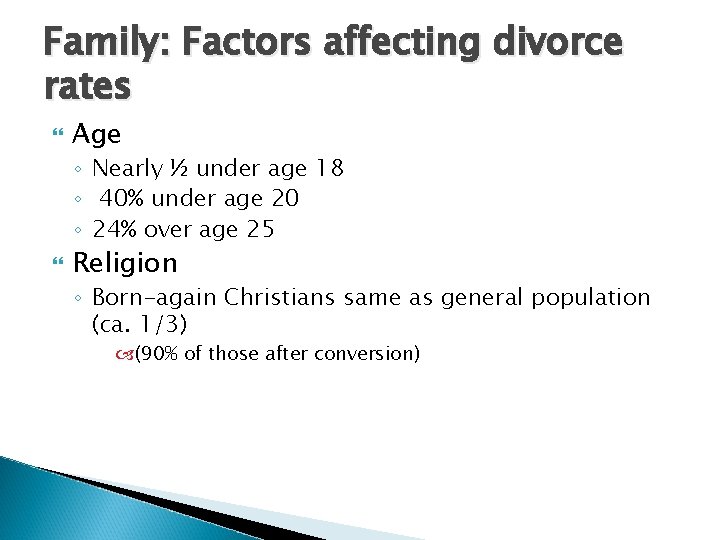
Family: Factors affecting divorce rates Age ◦ Nearly ½ under age 18 ◦ 40% under age 20 ◦ 24% over age 25 Religion ◦ Born-again Christians same as general population (ca. 1/3) (90% of those after conversion)
Family: Factors Affecting Divorce Rate Catholics: lowest divorce rate Baptists: highest divorce rate More likely to divorce than atheists or agnostics Cited in a posting from Smart Marriages Listserv on Jan. 25, 2002 Alabama: ¼ of population are Southern Baptists, majority of pop. are Evangelicals 4 th highest divorce rate in US (NV, TN, AR) (Barna Research Poll, 2001)
Family: Factors Affecting Divorce Rate ◦ Region Highest rates South & Midwest “Red” states higher than “blue” states from Smart Marriages Listserv , Jan. 4, 2005 ◦ Cohabitation Couples cohabiting before marriage 40 -85% higher risk of divorce than couples not cohabiting before marriage

Family: Factors Affecting Divorce Rate Factors decreasing risk of divorce
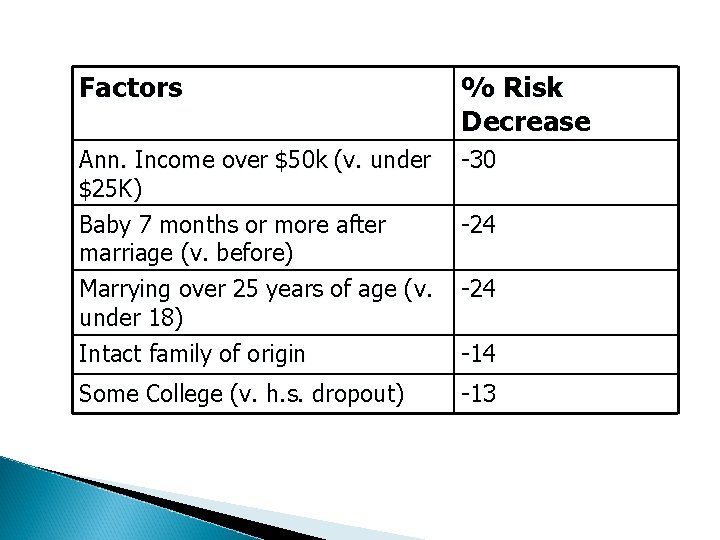
Factors % Risk Decrease Ann. Income over $50 k (v. under $25 K) Baby 7 months or more after marriage (v. before) Marrying over 25 years of age (v. under 18) Intact family of origin -30 Some College (v. h. s. dropout) -13 -24 -14
Family & Divorce: Why? Why increase in divorce? ◦ Emotional satisfaction > economic security ◦ Reduction in necessity and benefits of marriage ◦ Increased female opportunities women in labor force reduction of stigma ‑‑ no‑fault divorce
Family & Divorce: Why? ◦ Cultural Change Baby Boom 1960 s & 1970 s
Family & Marriage: an Assessment Remarriage rate has kept up with divorce rate ◦ rejection of partners, not institution ◦ married still happier than single Women still do the bulk of the work around the home ◦ still face conflicts between individual fulfillment and family roles
Family & Marriage: an Assessment Alternative Family Forms ◦ Living together has increased > six-fold Often short term Higher divorce rate ◦ Staying single: 2000: 27. 2 million people, 26% of all households (in 1950, 9. 3%) Vs. 22% married couples & their kids 21% married couples living alone
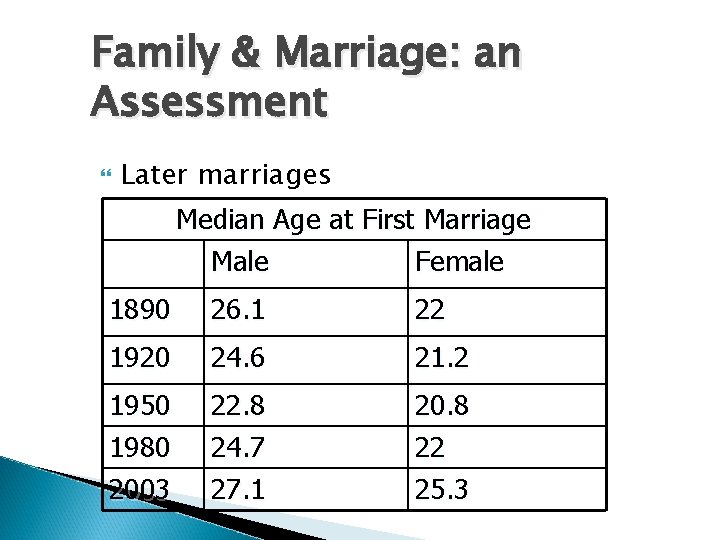
Family & Marriage: an Assessment Later marriages Median Age at First Marriage Male Female 1890 26. 1 22 1920 24. 6 21. 2 1950 1980 2003 22. 8 24. 7 27. 1 20. 8 22 25. 3
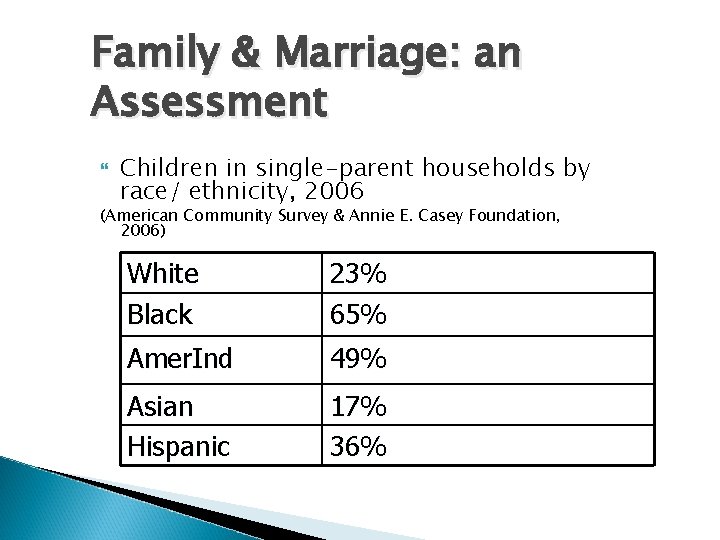
Family & Marriage: an Assessment Children in single-parent households by race/ ethnicity, 2006 (American Community Survey & Annie E. Casey Foundation, 2006) White Black 23% 65% Amer. Ind 49% Asian Hispanic 17% 36%
Family & Marriage: an Assessment Single Parent Households ◦ 2000: ca. 13. 5 million single parents had custody of 21. 7 million children under 21 years of age ◦ % of population made up by married couples with children decreased from 40% in 1970 to 24% in 2000
Family & Marriage: an Assessment Single parent households increased from 9% in 1990 to 16% of all households by 2000. Of all custodial parents, 85% were mothers
Household Composition Summarized Urbanization & Industrialization Reduced fertility Smaller families Culture Higher Divorce Rates More household forms Single
Household Composition, Lineality & Locality Single Parent Two parents, etc. Unusual Society ◦ Patterns of lineality & locality ◦ Patrilineal Trace blood & property lines along father’s side ◦ Matrilineal Trace blood & property lines along mother’s side
HHC, Lineality & Locality ◦ Matrilocal Children live with mother ◦ Patrilocal Children live with father Locality & lineality have separated ◦ Divorce $ goes with dad Kids go with mom
Family: Functional Changes & the State Matrilocal & Patrilineal Society ◦ Bureaucratization of the family ◦ To meet child rearing function of family due to household composition changes ◦ State has stepped in Welfare AFDC (until 1997) TANF (since July 1, 1997)
- Slides: 42