Gender Equality Index 2017 Conference 11 October 2017

Gender Equality Index 2017 Conference // 11 October 2017, Brussels


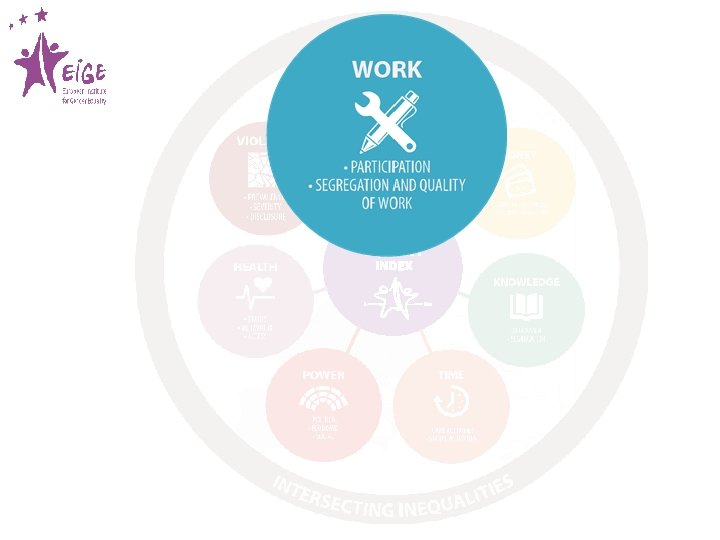
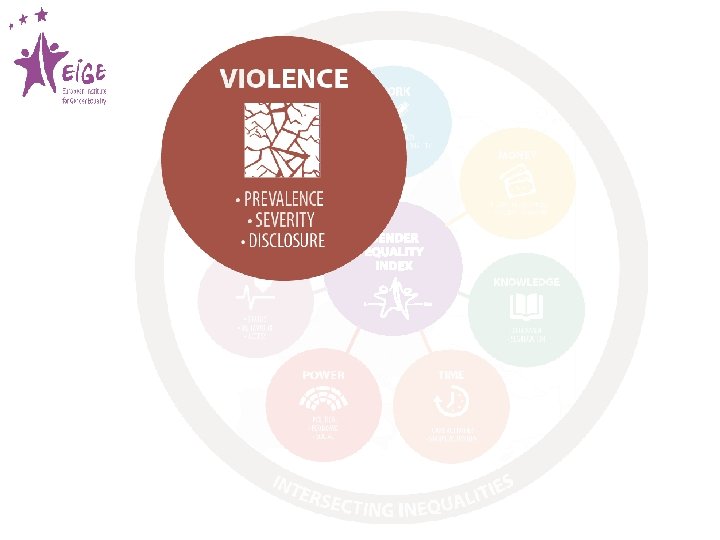
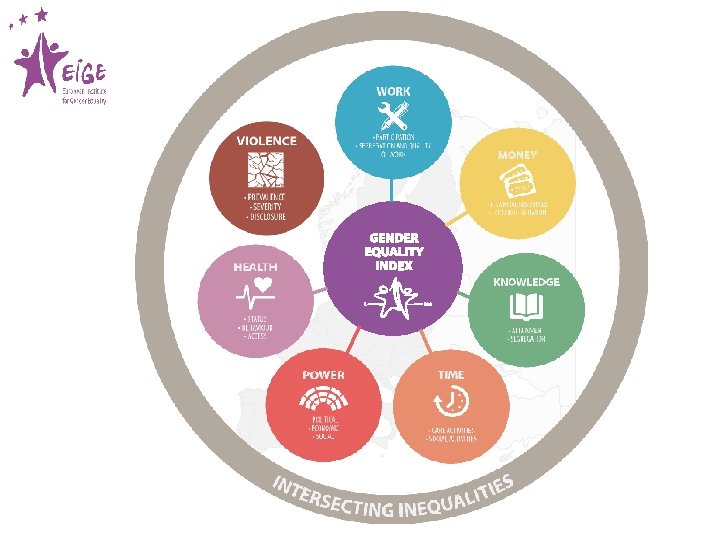
The Gender Equality Index is adapted to the context of the EU and is based on EU policy priorities

Gender gaps adjusted for levels of achievement

Full Inequality 1 Full Equality 100

Gender Equality Index 2017 100 90 80 70 60 R O F M ROO 66. 2 T N E M E V O R P IM 62. 0 50 40 30 20 10 EL HU SK RO HR CZ CY PT EE LT PL LV BG MT IT AT DE EU-28 ES SI LU IE BE UK FR NL FI DK SE 01 2015 2005
 Luxembourg (money)")
Highest scores by domain SE FI Sweden (work, time, power, and health) Luxembourg (money) E E DK IE UK LT NL BE LU Denmark (knowledge) LV FR PL DE CZ SK AT HU SI HR RO BG IT ES PT EL MT CY

Index 2005 -2015 SE FI Most improved Italy +12. 9 Cyprus +9. 1 Slovenia +7. 6 Ireland +7. 6 EE DK IE UK LT NL BE LU Least improved UK +0. 3 Czech Republic 0. 0 Slovakia -0. 1 LV FR PL DE CZ SK AT HU SI HR RO BG IT ES PT EL MT CY

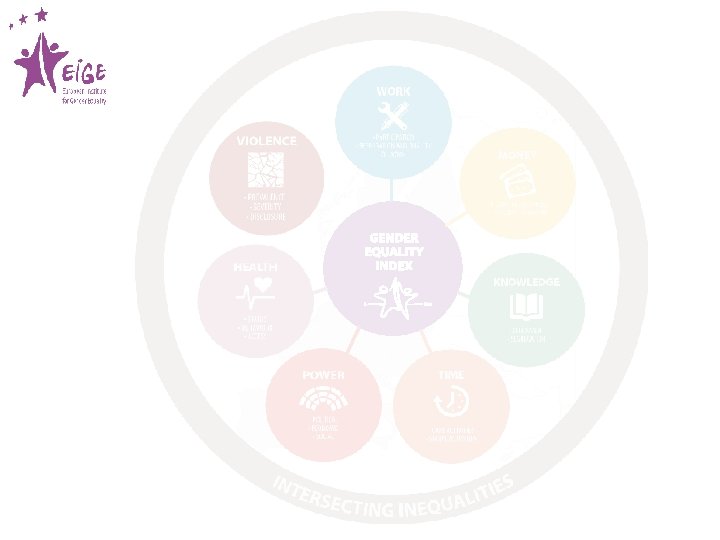
KNOWLEDGE 63. 4 MONEY 79. 6 TIME INDEX WORK 71. 5 65. 7 66. 2 POWER HEALTH 87. 4 48. 5
![Scores of the domain of power 100 90 80 70 60 [VALUE] 50 40](http://slidetodoc.com/presentation_image_h/23ebcc7b00003def70c912426705ddfd/image-20.jpg "Scores of the domain of power 100 90 80 70 60 [VALUE] 50 40")
Scores of the domain of power 100 90 80 70 60 [VALUE] 50 40 38. 9 30 20 10 HU EL CZ SK CY MT EE HR RO PT AT PL LT LV LU IT EU-28 IE NL UK DE BE BG ES SI DK FI FR SE 01 2015 2005

Domain of power SE FI Most improved Italy +29. 2 France +24. 6 Slovenia +24. 1 EE DK IE UK LT NL BE LU Least improved Finland -3. 1 Slovakia -3. 8 Czech Republic -7. 0 LV FR PL DE CZ SK AT HU SI HR RO BG IT ES PT EL MT CY

Scores of the domain of knowledge 100 90 80 70 63. 4 60 60. 8 50 40 30 20 0 1 LV HR RO DE EE BG PT SI EL LT PL HU CZ CY SK FI IT AT EU-28 MT ES FR IE NL LU BE UK SE DK 10 2015 2005

Domain of knowledge SE FI Most improved Cyprus +15. 1 Greece +8. 4 Luxembourg +7. 4 EE DK IE UK LT NL BE LU Least improved Poland -0. 7 Germany -2. 4 UK -4. 0 LV FR PL DE CZ SK AT HU SI HR RO BG IT ES PT EL MT CY

Scores of the domain of time 100 90 80 70 65. 7 60 66. 7 50 40 30 20 10 BG EL SK PT RO LT HR CY PL HU CZ IT AT ES MT DE BE EU-28 LV FR LU UK SI IE EE FI DK NL SE 1 0 2015 2005

Domain of time SE FI Most improved Latvia +6. 7 Czech Republic +6. 1 Spain +6. 0 EE DK IE UK LT NL BE LU Least improved Bulgaria -8. 2 Slovakia -9. 0 Belgium -9. 0 LV FR PL DE CZ SK AT HU SI HR RO BG IT ES PT EL MT CY

Scores of the domain of work 100 90 80 71. 5 70 70. 0 60 50 40 30 20 01 IT EL SK CZ PL RO HU BG HR CY MT DE EU-28 SI PT FR EE ES LT LV BE IE LU FI AT UK NL DK SE 10 2015 2005

Domain of work SE FI Most improved Malta +10. 2 Luxembourg +5. 9 Cyprus +4. 4 EE DK IE UK LT NL BE LU Least improved Denmark +0. 3 Slovakia +0. 2 Romania -1. 5 LV FR PL DE CZ SK AT HU SI HR RO BG IT ES PT EL MT CY

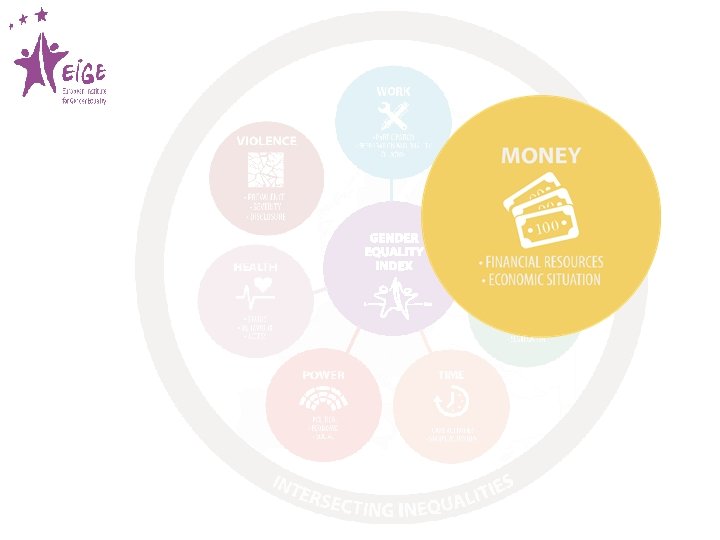
Scores of the domain of money 100 90 79. 6 80 70 73. 9 60 50 40 30 20 01 RO BG LV LT EE HR HU EL PT PL SK ES CZ IT CY EU-28 UK SI MT DE IE AT FR FI DK NL SE BE LU 10 2015 2005

Domain of money SE FI Most improved Slovakia +12. 5 Malta +12. 1 Poland +11. 9 EE DK IE UK LT NL BE LU Least improved Croatia +1. 3 Germany +0. 9 Greece -1. 2 LV FR PL DE CZ SK AT HU SI HR RO BG IT ES PT EL MT CY

Scores of the domain of health 100 87. 4 90 80 85. 9 70 60 50 40 30 20 01 RO BG LV LT EE PL EL HR PT SK HU CZ IT BE FR EU-28 SI CY LU ES DK FI NL DE IE AT MT UK SE 10 2015 2005

Domain of health SE FI Most improved Latvia +4. 6 Germany +3. 9 Bulgaria +3. 8 Least improved Luxembourg -0. 2 Portugal -0. 2 Denmark -1. 5 Greece -1. 5 EE DK IE UK LV LT NL BE LU FR PL DE CZ SK AT HU SI HR RO BG IT ES PT EL MT CY

The progress in gender equality is as slow as a snail’s pace Political pressure and legislative actions accelerate progress and improve gender balance in decisionmaking. A gendered division across study fields and occupations remains a reality for women and men in Europe. Unequal sharing of time for caring duties proves to be the most resistant to change.

Explore the Gender Equality Index: http: //eige. europa. eu/gender-statistics/genderequality-index
- Slides: 33