GENDER EQUALITY IN ESTONIA Positive aspects in Estonia

 and women")


- Slides: 21
GENDER EQUALITY IN ESTONIA
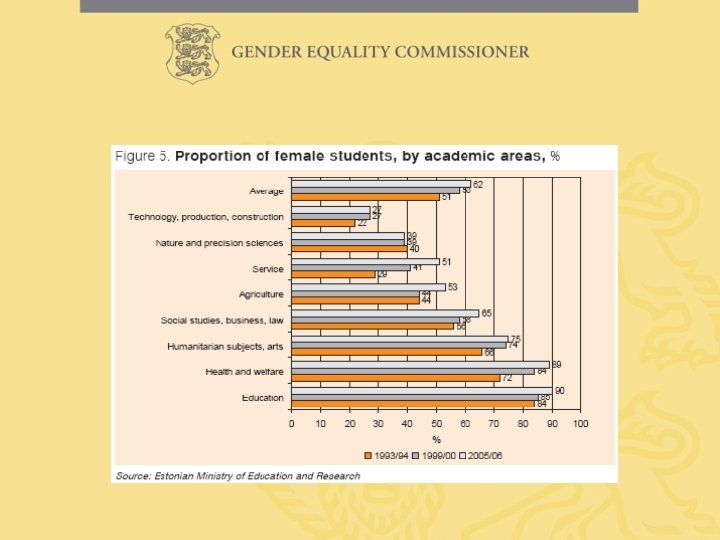
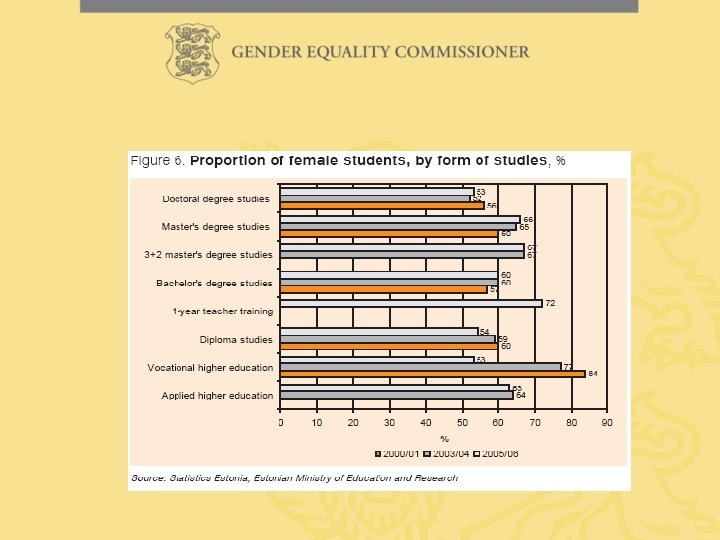
Positive aspects in Estonia • High employment rate among both men (71%) and women (65%, 6 th in EU-27)* • Gender parity on most levels of education (fe among undergraduate students 60% women, 40% men)** • Comparatively high number of women among managers (38%, 3 rd in EU-25)*** * Eurostat (2007) ** Estonian Ministry of Education and Science (2005/2006) *** Eurostat (2006)
Negative aspects in Estonia • Low political representation of women (21% in government, 24% in parliament, 30% in municipalities) • Large gender pay gap (25%, biggest in EU-27)* • Large gap of life expectancy (men 67 years, women 78 years)** * Eurostat (2007) ** Statistics Estonia (2007)
Female employment rate and gender pay gap
Political representation
Political representation
Political representation
Political representation
Time use: singles
Time use: couples without children
Time use: couples with children aged 0 -6 years
Time use: couples with children aged 7 -17 years
Youth education attainment level Percentage of the population aged 20 to 24 having completed at least upper secondary education FEMALE
Early school leavers Percentage of the population aged 18 -24 with at most lower secondary education and not in further education or training
Science and technology graduates Tertiary graduates in science and technology per 1 000 of female population aged 20 -29 years FEMALE
Gender stereotypes in school materials