
GE 177 b I Introduction II Methods in
GE 177 b I. Introduction II. Methods in Morphotectonics III. Determining the time evolution of fault slip 1 - Techniques to monitor fault slip 2 - EQs phenomenology- Case studies 3 - EQs phenomenology- Scaling Laws 4 - Slow EQs phenomenology 5 - Paleoseismology 6 - Paleogeodesy Appendix: ‘Elastic Dislocation’ modeling
III. 2 -Earthquake Phenomenology • • The 2013 Balochistan EQ The 2015, Gorkha EQ The 1992, Landers EQ The 1999, Hector Mine EQ
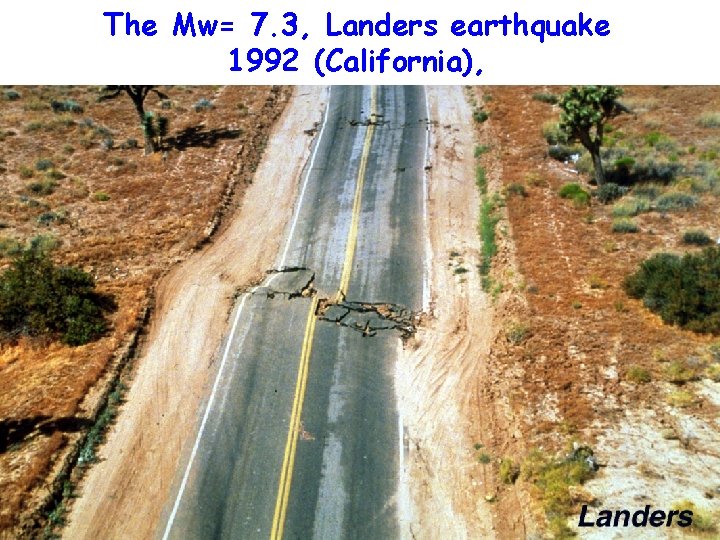
The Mw= 7. 3, Landers earthquake 1992 (California),
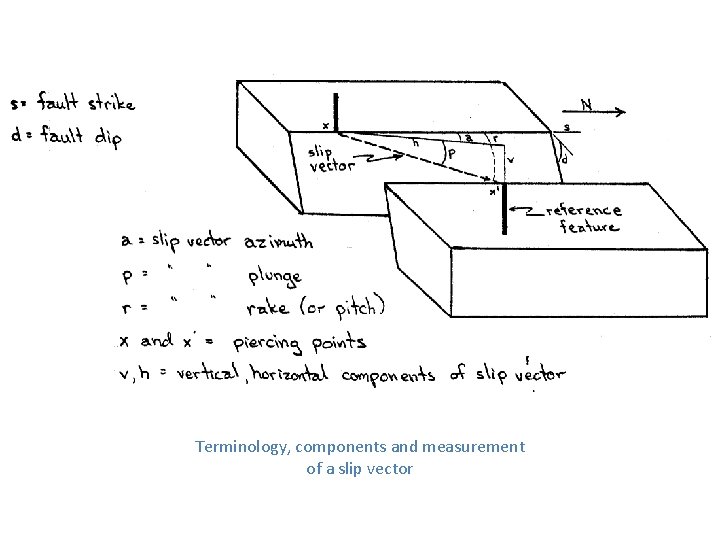
Terminology, components and measurement of a slip vector
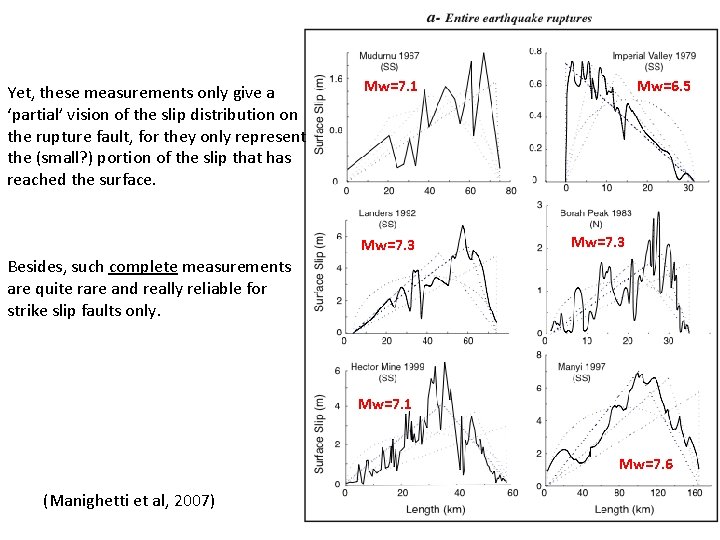
Yet, these measurements only give a ‘partial’ vision of the slip distribution on the rupture fault, for they only represent the (small? ) portion of the slip that has reached the surface. Mw=7. 1 Mw=7. 3 Mw=6. 5 Mw=7. 3 Besides, such complete measurements are quite rare and really reliable for strike slip faults only. Mw=7. 1 Mw=7. 6 (Manighetti et al, 2007)
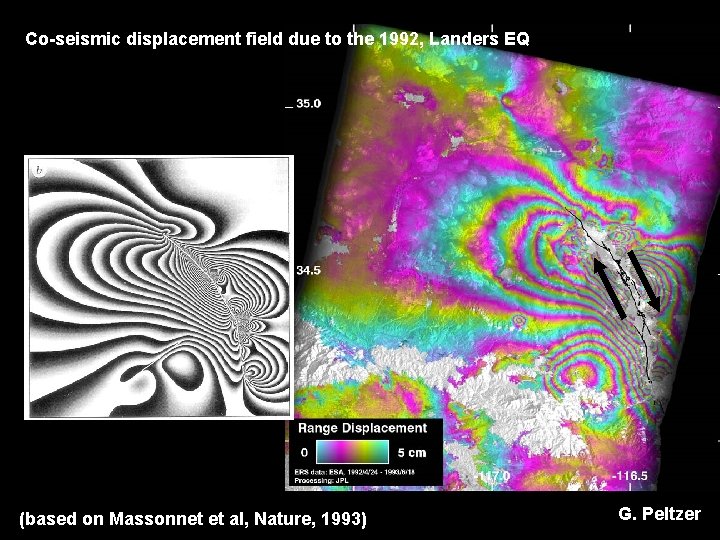
Co-seismic displacement field due to the 1992, Landers EQ (based on Massonnet et al, Nature, 1993) G. Peltzer
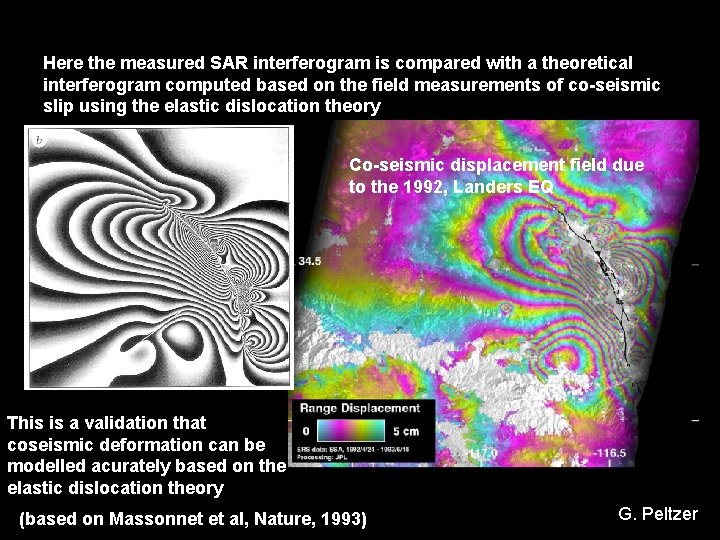
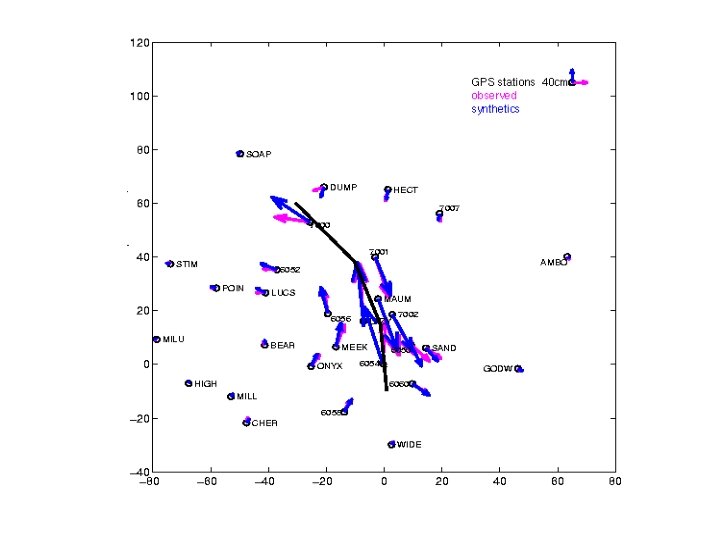
Here the measured SAR interferogram is compared with a theoretical interferogram computed based on the field measurements of co-seismic slip using the elastic dislocation theory Co-seismic displacement field due to the 1992, Landers EQ This is a validation that coseismic deformation can be modelled acurately based on the elastic dislocation theory (based on Massonnet et al, Nature, 1993) G. Peltzer
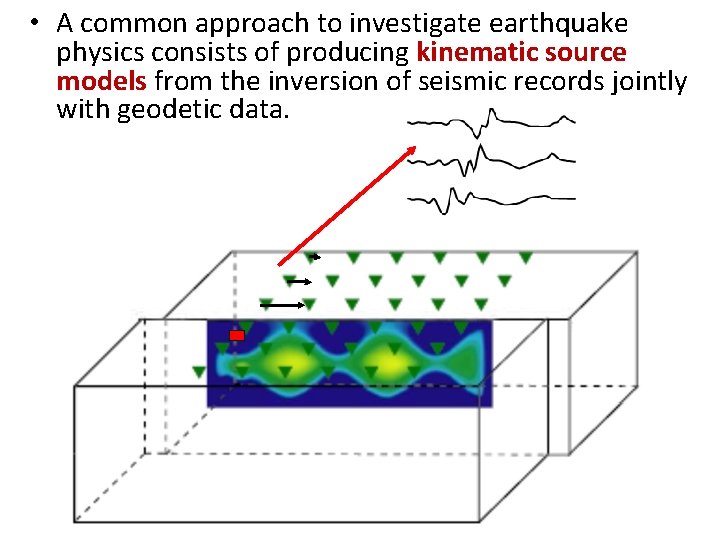
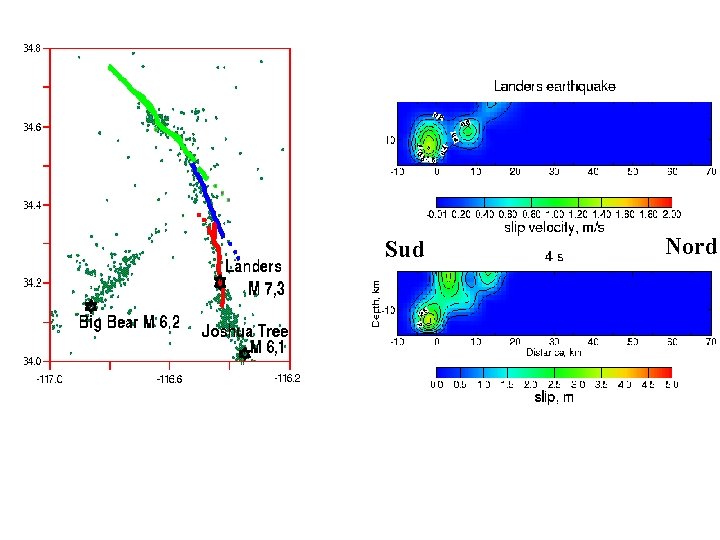
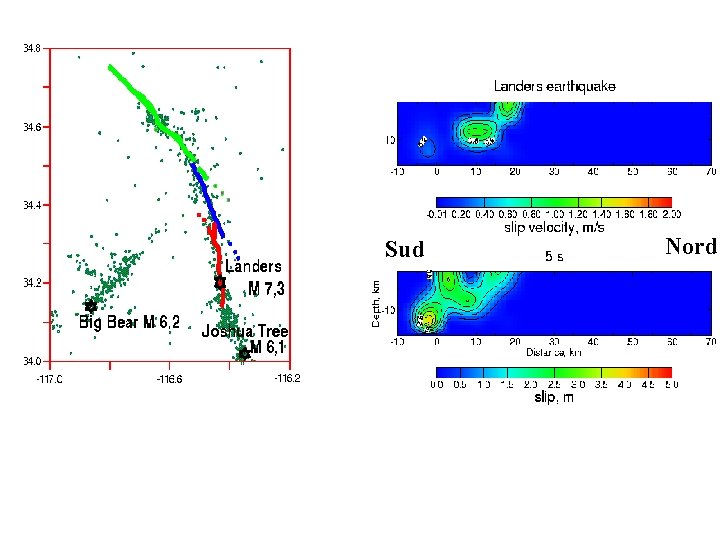
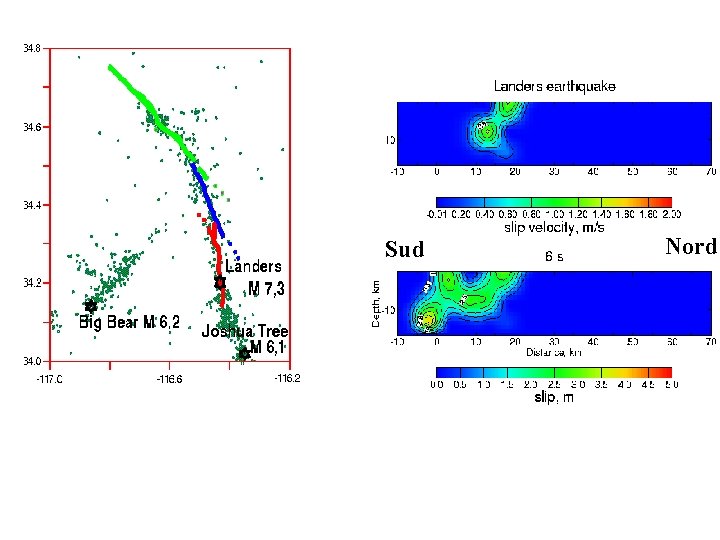
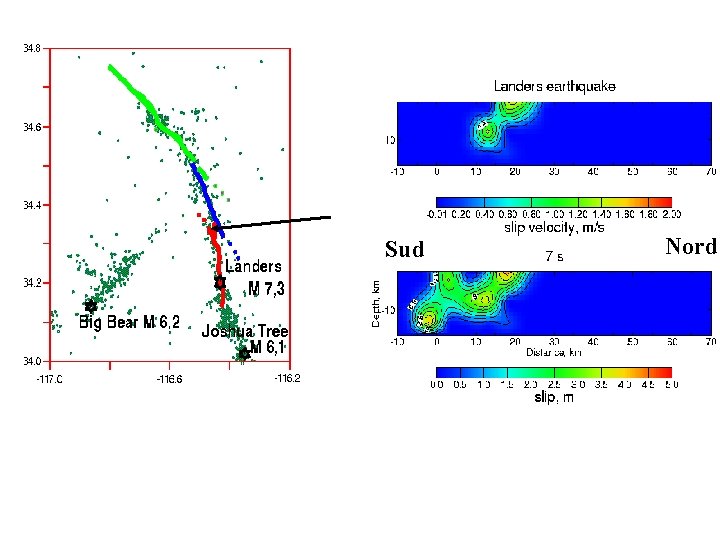
• A common approach to investigate earthquake physics consists of producing kinematic source models from the inversion of seismic records jointly with geodetic data.
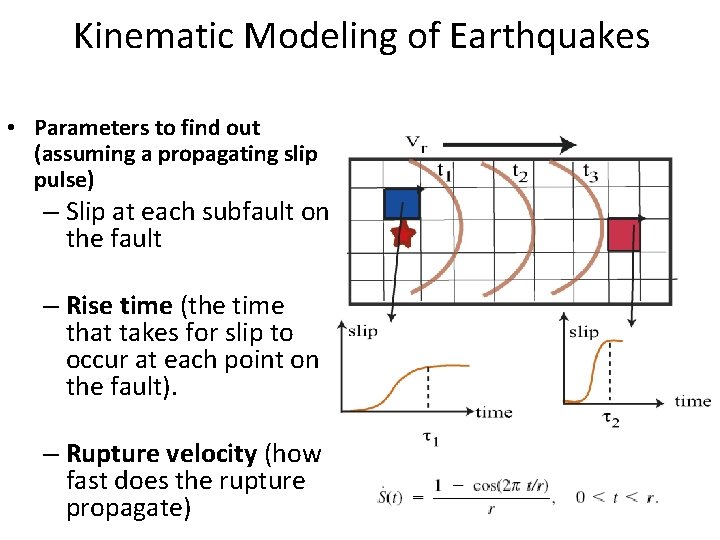
Kinematic Modeling of Earthquakes • Parameters to find out (assuming a propagating slip pulse) – Slip at each subfault on the fault – Rise time (the time that takes for slip to occur at each point on the fault). – Rupture velocity (how fast does the rupture propagate)
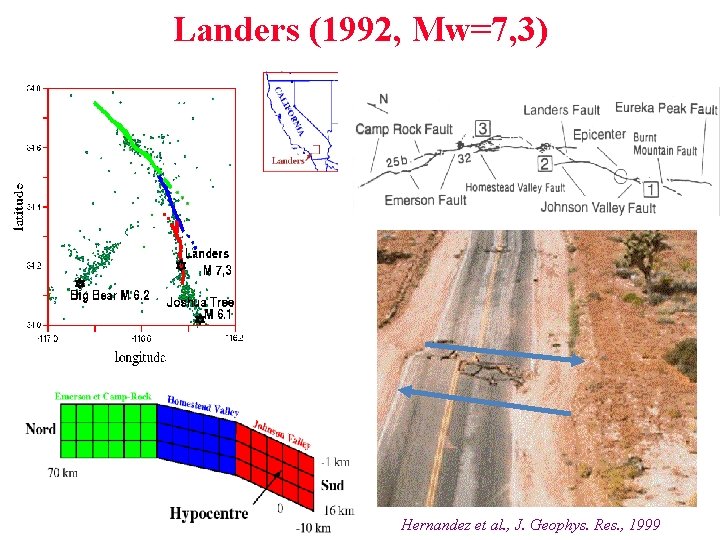
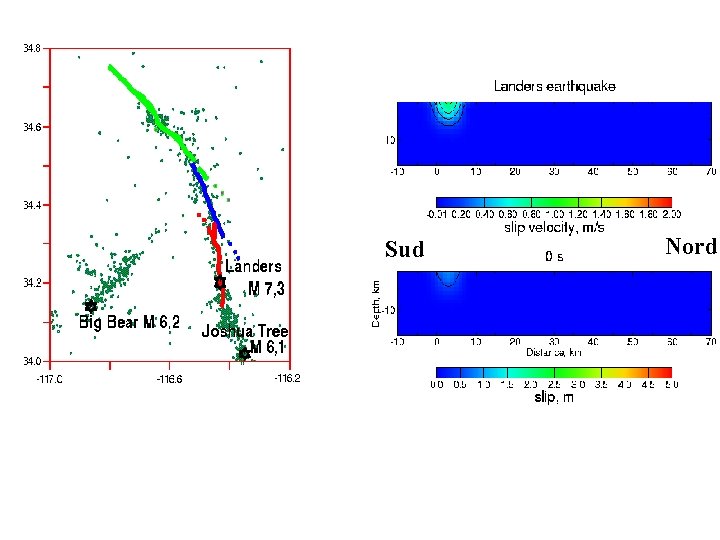
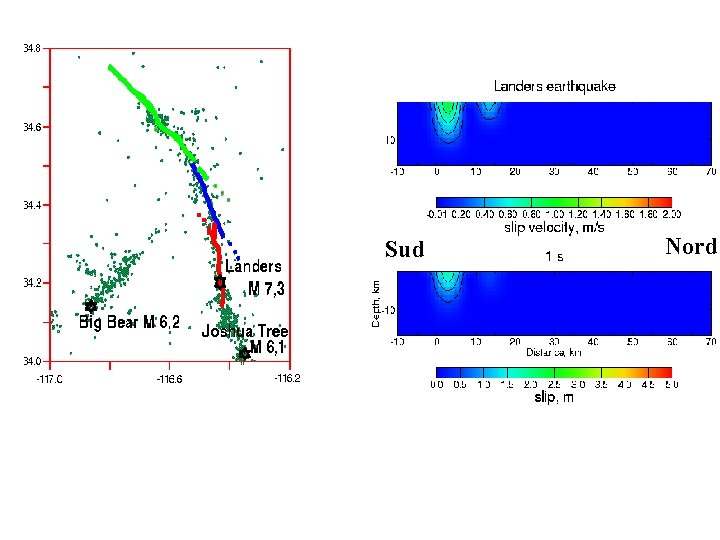
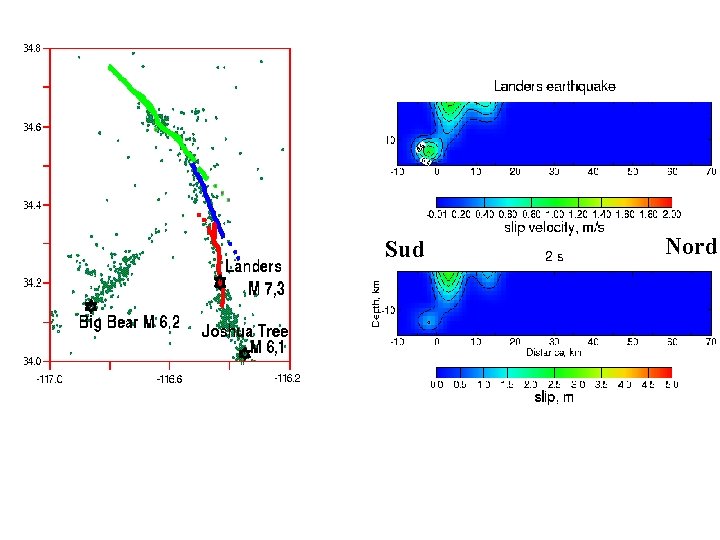
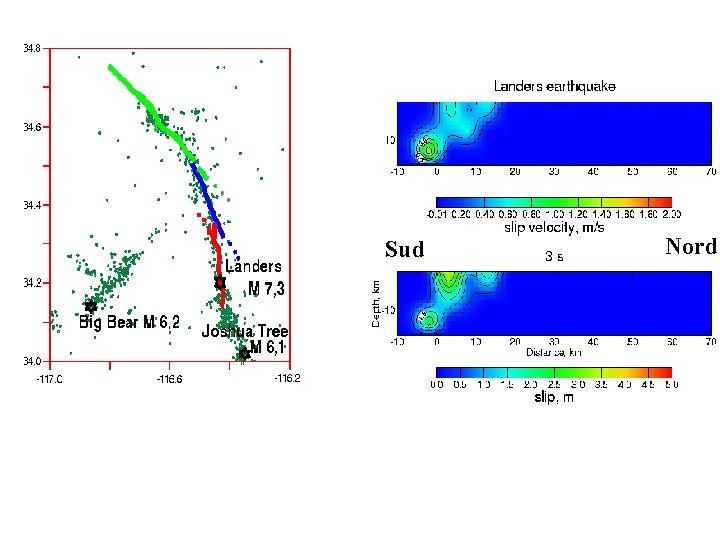
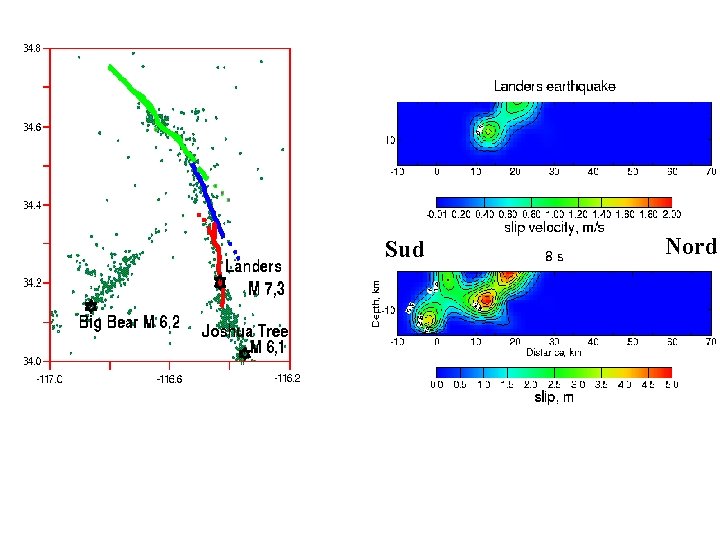
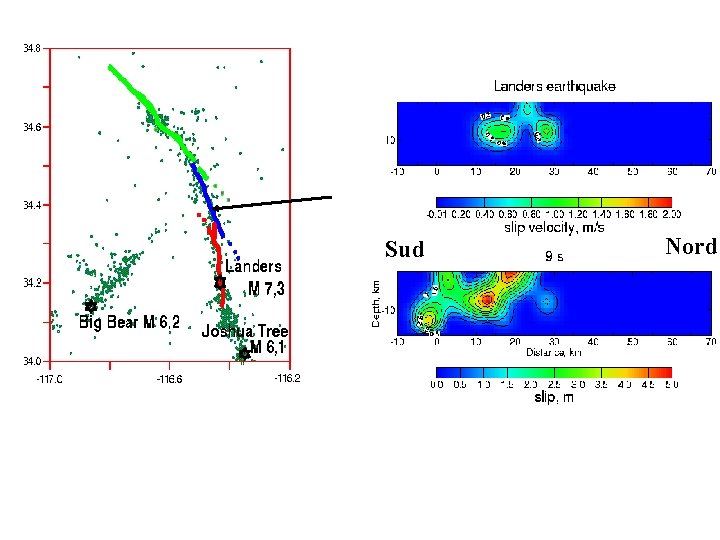
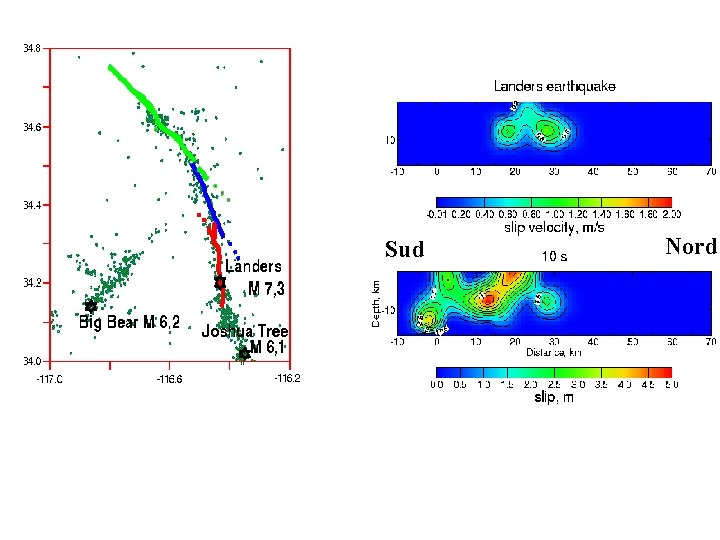
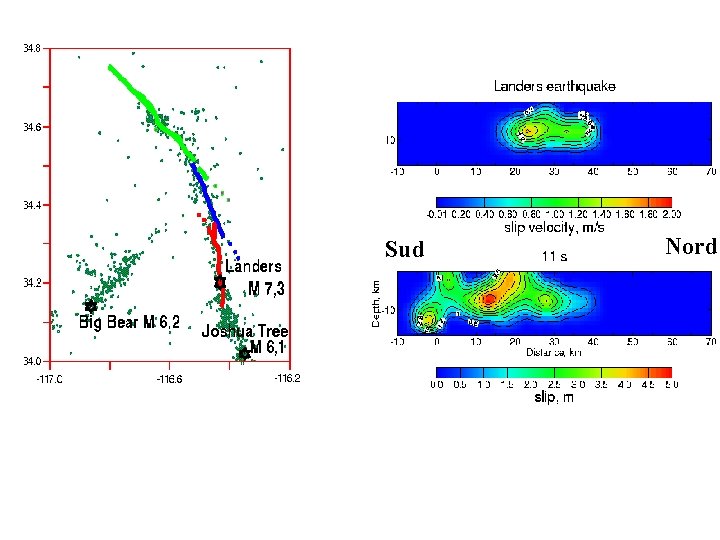
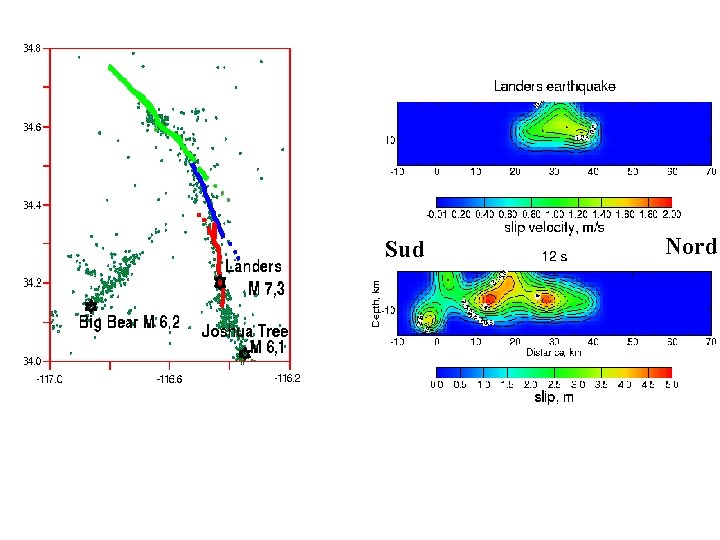
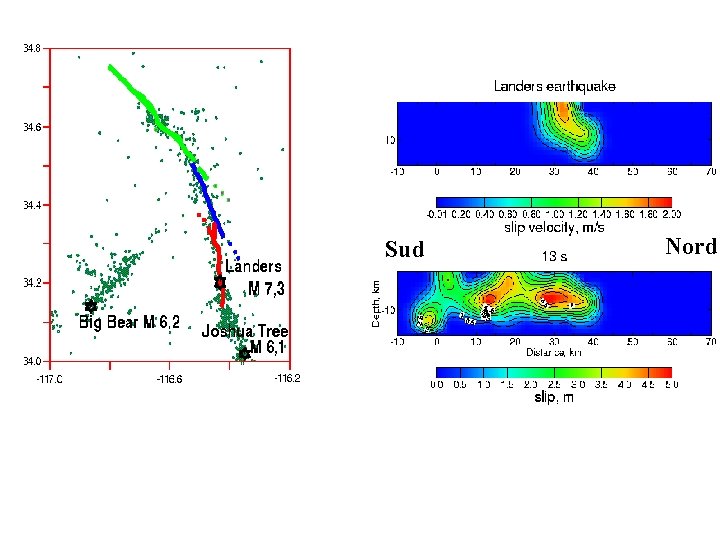
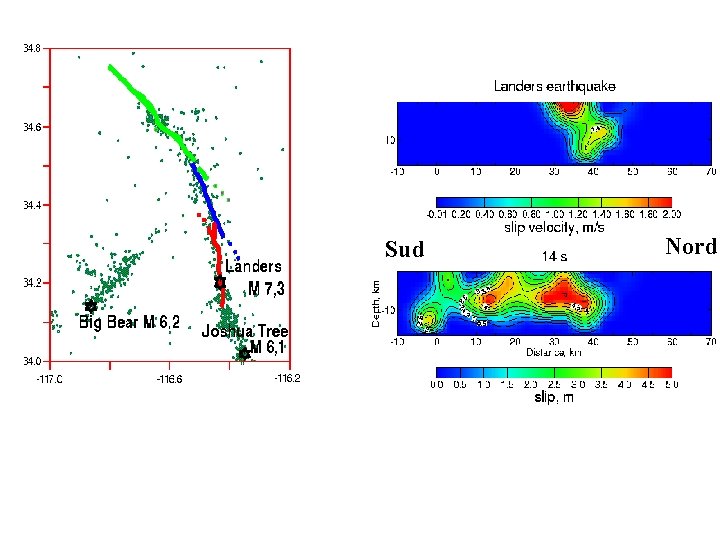
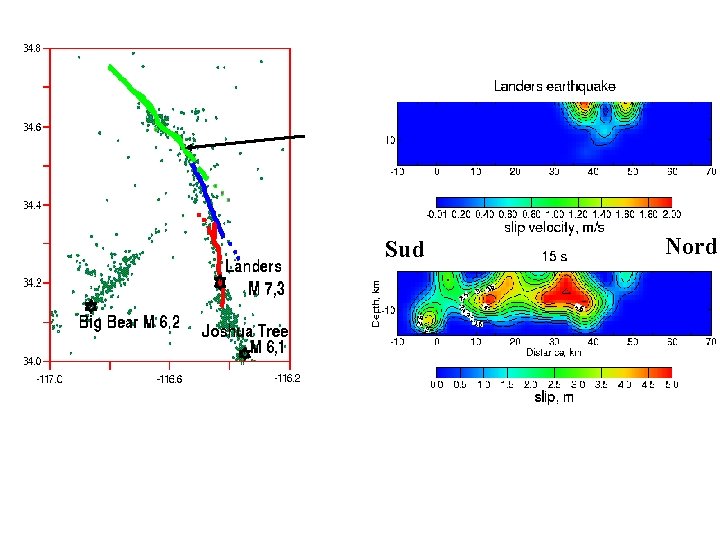
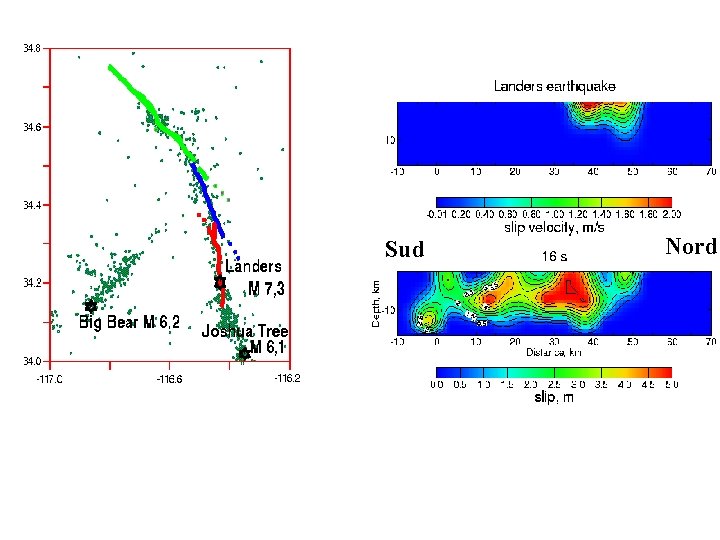
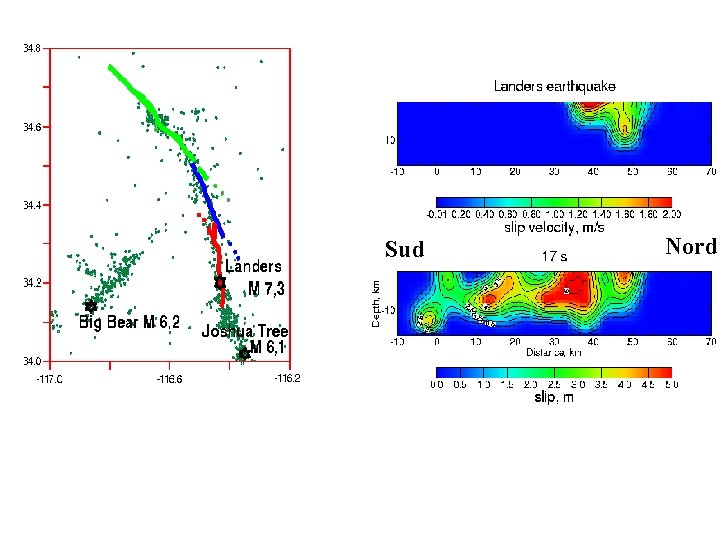
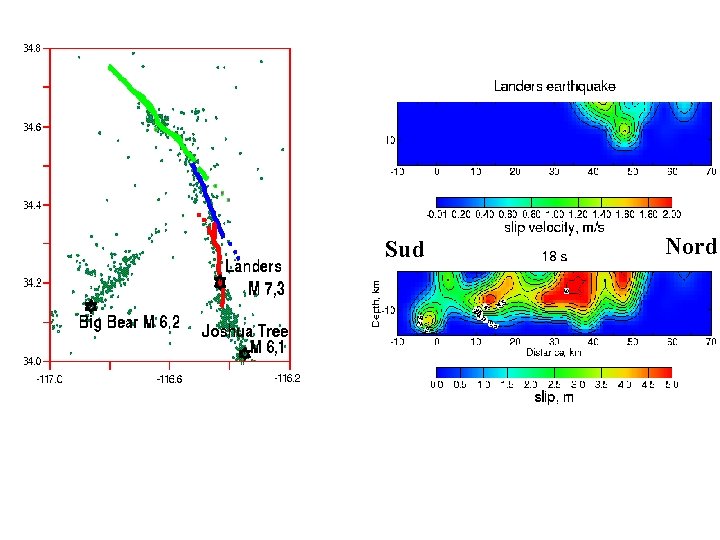
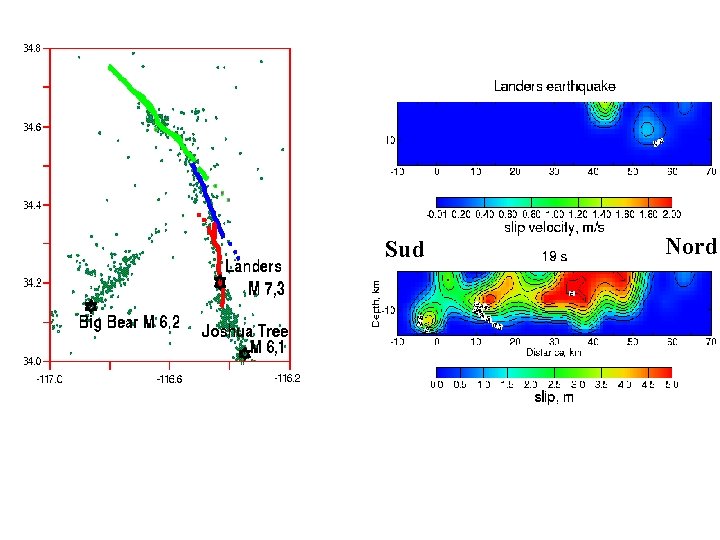
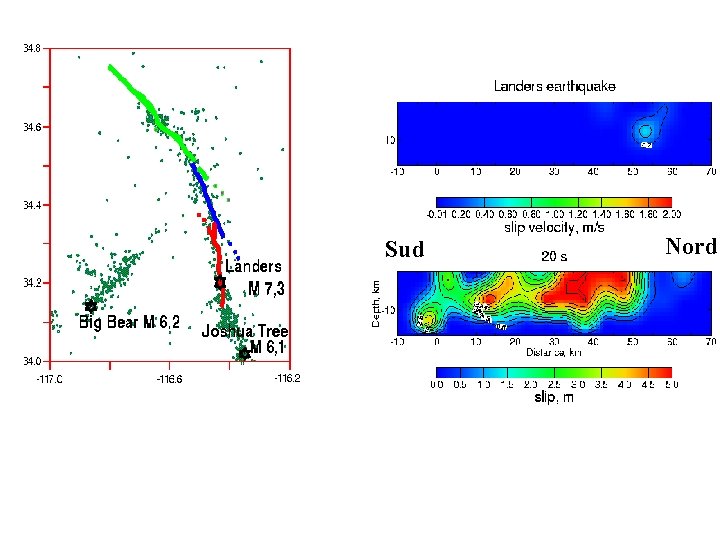
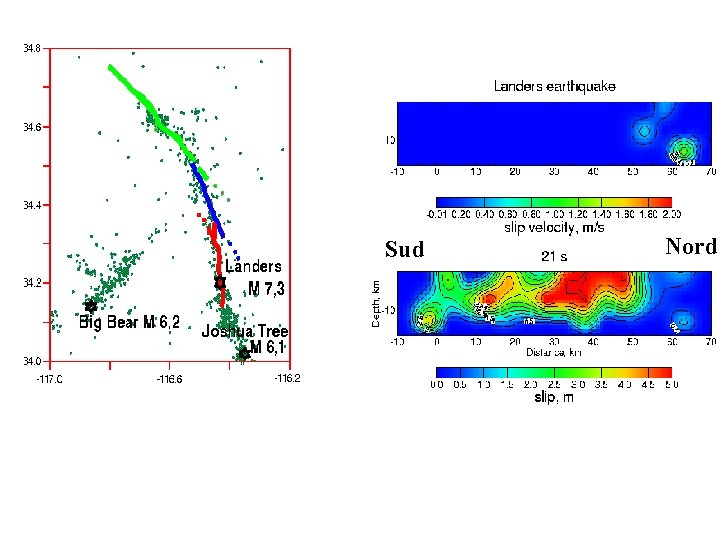
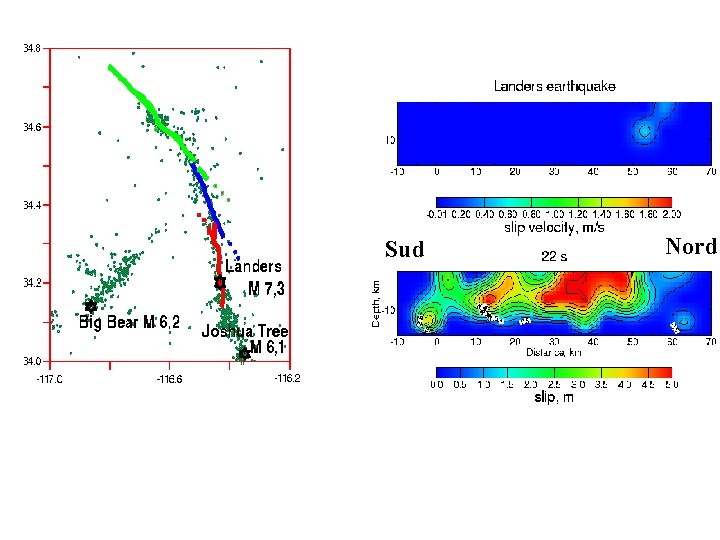
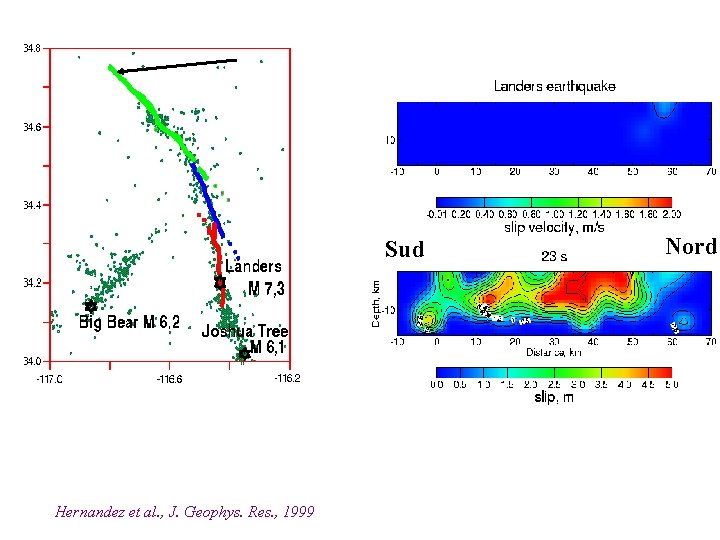
Landers (1992, Mw=7, 3) Hernandez et al. , J. Geophys. Res. , 1999
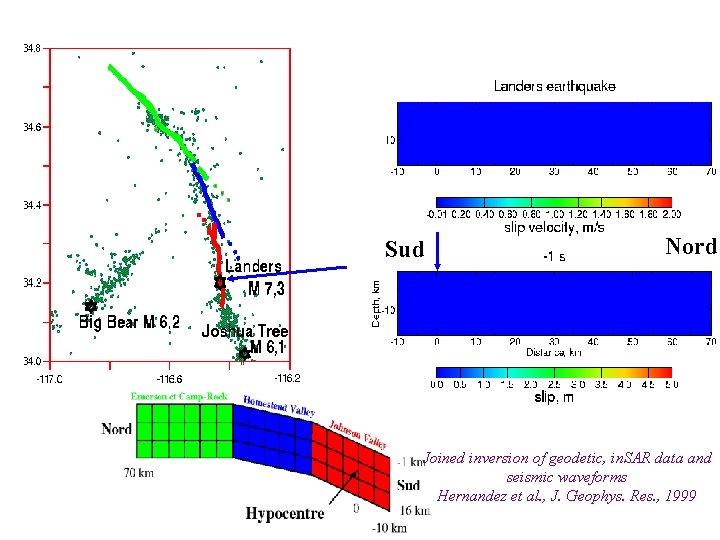
Sud Nord Joined inversion of geodetic, in. SAR data and seismic waveforms Hernandez et al. , J. Geophys. Res. , 1999
Sud Nord
Sud Nord
Sud Nord
Sud Nord
Sud Nord
Sud Nord
Sud Nord
Sud Nord
Sud Nord
Sud Nord
Sud Nord
Sud Nord
Sud Nord
Sud Nord
Sud Nord
Sud Nord
Sud Nord
Sud Nord
Sud Nord
Sud Nord
Sud Nord
Sud Nord
Sud Nord
Sud Hernandez et al. , J. Geophys. Res. , 1999 Nord
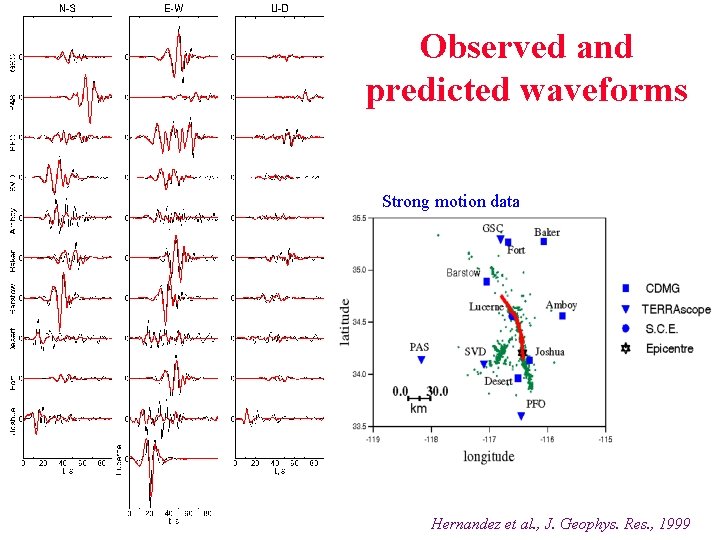
Observed and predicted waveforms Strong motion data Hernandez et al. , J. Geophys. Res. , 1999
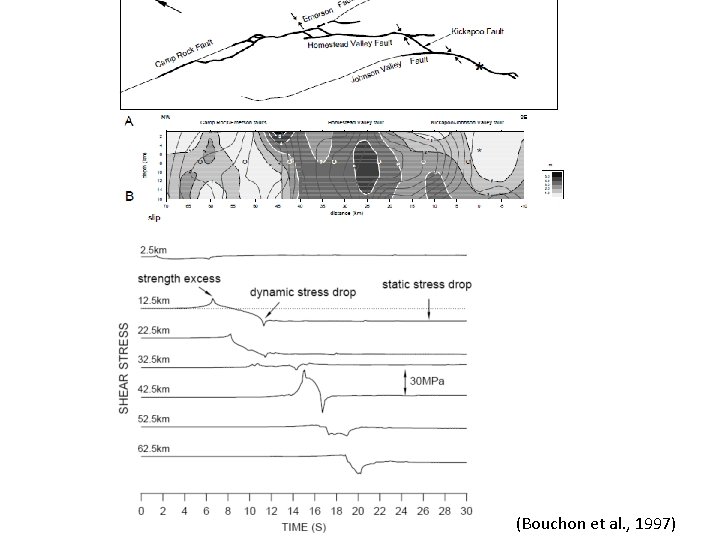
(Bouchon et al. , 1997)
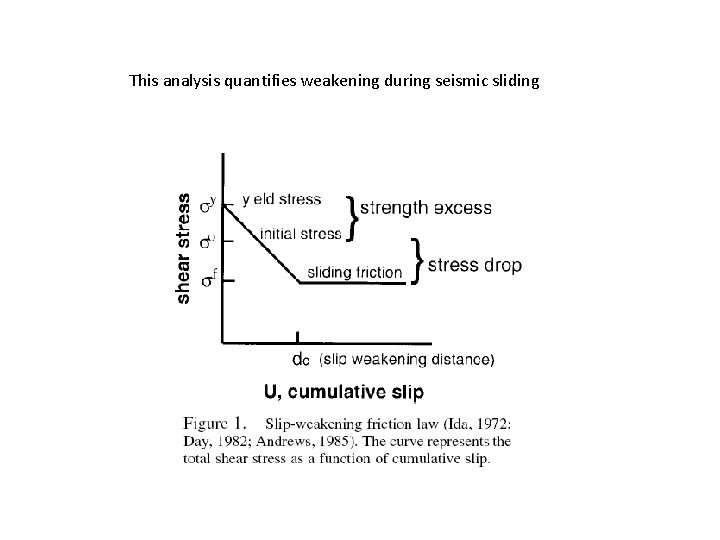
This analysis quantifies weakening during seismic sliding
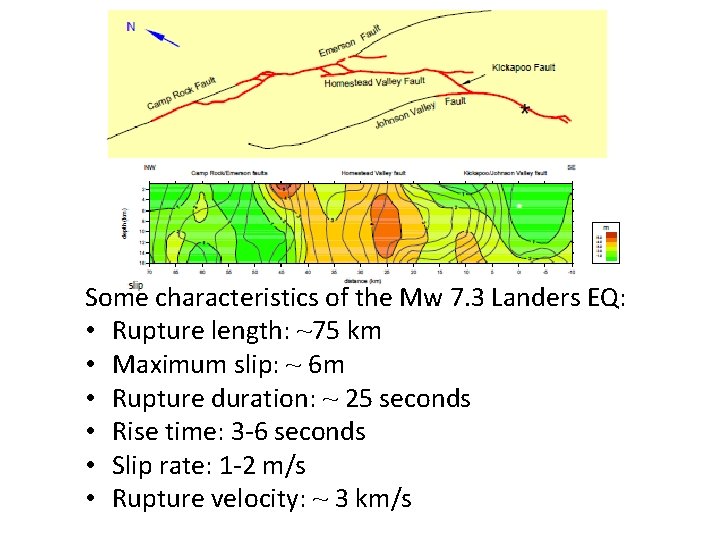
Some characteristics of the Mw 7. 3 Landers EQ: • Rupture length: ~75 km • Maximum slip: ~ 6 m • Rupture duration: ~ 25 seconds • Rise time: 3 -6 seconds • Slip rate: 1 -2 m/s • Rupture velocity: ~ 3 km/s
– Seismic ruptures “pulse like” (e. g, Heaton, 1990) for large earthquakes (Mw>7) with rise times of the order of 3 -10 s typically – the rupture velocity is variable during the rupture but generally 0. 7 to 0. 9 the shear wave velocity. (2. 5 -3. 5 kms). It is occasionnally ‘supershear’ (>3. 5 -4 km/s). – Seismic sliding rate is generally of the order of 1 m/s – Large earthquakes typically ruptures faults down to 15 km within continent and down to 30 -40 km along subduction Zones. – Seismic ruptures are affected by fault geometries. They often stop at geometric complexities but can jump across significant stepovers – Slip variability measured at the small scale is probably due to off-fault anelastic defomation
- Slides: 41