GCSE Statistics Variance and Standard Deviation We are

")


- Slides: 14
GCSE Statistics Variance and Standard Deviation
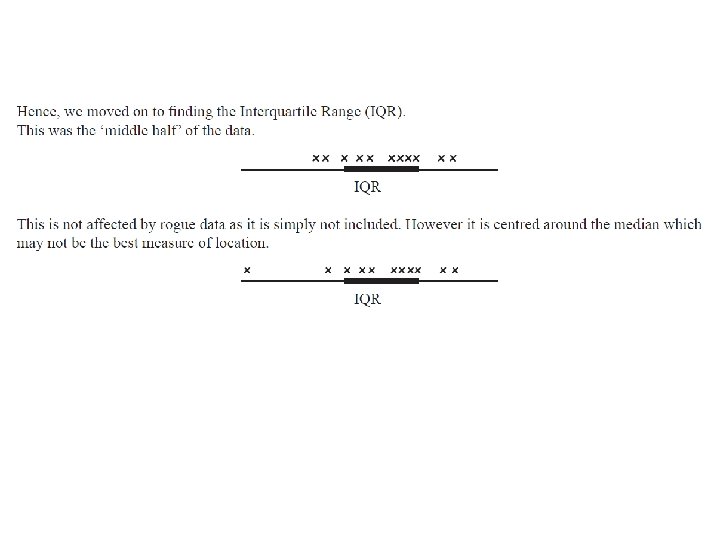
We are back to looking at measures of dispersion (spread)
To increase our level of accuracy and sophistication further, it is important that we try to include all the pieces of data in our calculation. This leads us to variance and standard deviation which are based on the mean. Advantages and disadvantages of measures of dispersion Book page 148 Measure Range Advantages • A reasonably good indicator Disadvantages • Badly affected by extreme values Inter-quartile range • Not affected by extreme values • Often used with skewed data • Does not tell you what happens beyond the quartiles Variance • Good measure • All values used • Used when data are fairly symmetrical • Mathematical properties not useful (SD preferred) • Not so good if data are strongly skewed Standard deviation • Good measure • All values used • Used when data are fairly symmetrical • Can be used in mathematical calculations of other statistics • Not so good if data are strongly skewed
Page 145 in the text and on the formulae sheet in the exam
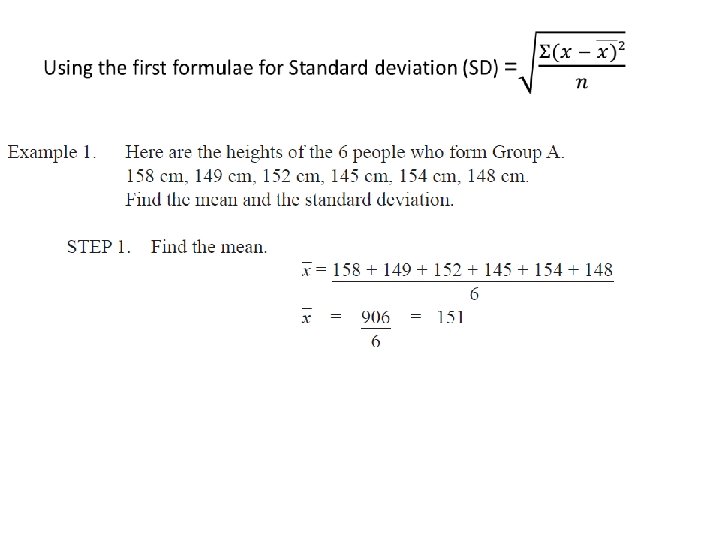
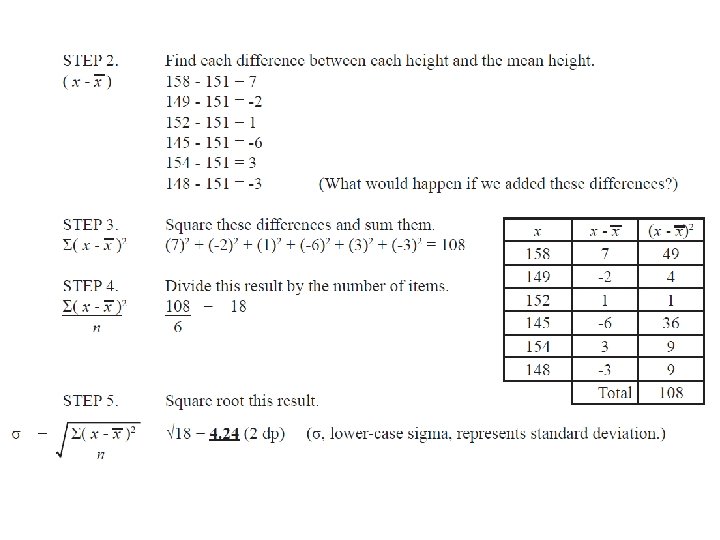
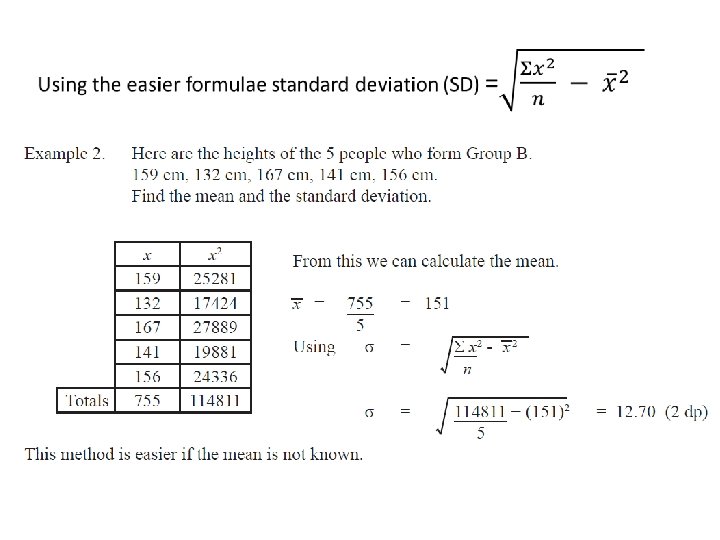
Standard deviation is the square root of variance It is the average distance each piece of data is from the mean Page 146 in the text and on the formulae sheet in the exam
And now for data in a frequency table This time your formula looks like this: Or the easier version
So this time we draw a slightly different table To use the easy version of the formulae our table would look like this
Your turn Exercise 4 I page 149 Other sources of material 10 Ticks level 9 pack 3 (the notes come from here)