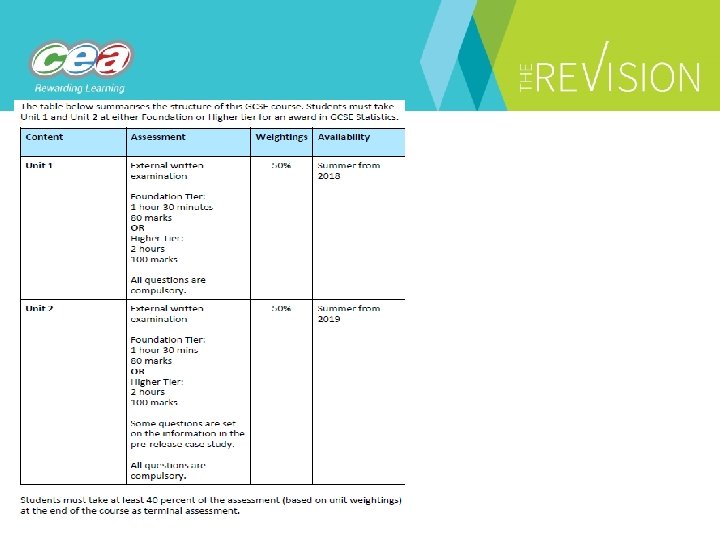
GCSE Statistics Support Event Wednesday 23052108 Corrs Corner


 Multiple (grouped) Frequency or Percentage A B C X Y")


 60 50 40 30 20 10")


")


150 100 50 0")
150 100 50 0")
150 100 50 0")
 Energy (kcal) 48 245 51 228 50 248")


 2. Use of the geometric mean")


- Slides: 112
GCSE Statistics Support Event Wednesday 23/05/2108 Corr’s Corner Hotel 9. 30 to 15. 30
Education Manager: Michael Mc. Enery mmcenery@ccea. org. uk 02890261200 ext 2170 Subject Support Officer: Nuala Tierney ntierney@ccea. org. uk Chair of Examiners: Ruth Crooks Chief Examiner: Darren Owens Principal Examiners: James Mc. Auley, Conor Sweeney, Brenda Crossen
Proposed Amendments to Specification use simple cases of hypothesis testing using H 0 and H 1 notation, including knowledge of one- and two-tailed tests; page 14 of specification These amendments are with CCEA Regulator and awaiting decision. Microsite will inform you of decision before September 2018. use simple cases of hypothesis testing using Ho and H 1 notation, including knowledge of one- and two-tailed tests; and This has been removed as the level of complexity of this topic is too advanced for this course and is not in keeping with the spirit of this specification. This is not included in the comparable specifications for AQA and Edexcel. The Df. E guidance on this topic suggests that it should be covered at A 2. demonstrate understanding of the binomial distribution as a commonly used model for experiments; This has been included to replace hypothesis testing to provide an example of a probability distribution for a discrete random variable to complement the Normal distribution which is already included. use binomial expansions to calculate probabilities; As above. The binomial distribution as a model
Access to Resources – C 2 k Fronter Room Send details to mmcenery@ccea. org. uk https: //fronter. com/c 2 kschools/main. phtml
Session 1 The Statistical Problem Solving Process
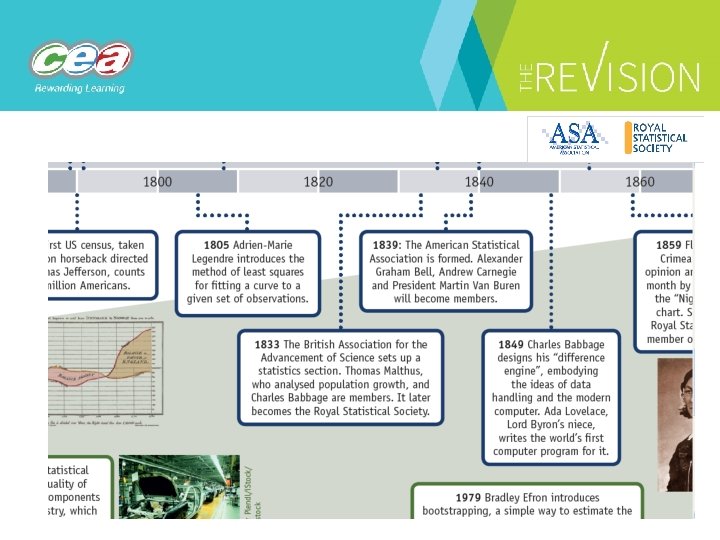
The timeline can be accessed from the following link: http: //www. statslife. org. uk/images/pdf/timeline-of-statistics. pdf
• The RSS rebranded in 2014 when the current logo and strapline was developed. • The reason for changing is that we wished to have a brand that spoke to the important role that statistics and data play in everyone’s lives, and an identity that reflected what the Society is today: professional, modern and inclusive.
The 1857 RSS logo
The RSS logo One of the original aims of the Society was to present statistical facts for others to interpret hence the original badge of the wheatsheaf with the latin motto "aliis exterendum" which translates as "to be threshed by others". This purist approach of presenting statistics without interpretation was soon found to be untenable and the motto was dropped in 1857 when the wheatsheaf was also tidied up. The First 100 Years: 1834 -1934 I. D. Hill JRSS Series A (General), Vol. 147, No. 2 (1984), p. 133 Explanation from the archivist for RSS, The Royal Statistical Society www. rss. org. uk
Statistical problem solving • Posing a question • Planning • Collecting data • Processing representing and Analysing data • Discussing and Interpreting results • Communicating in a variety of forms • Evaluating
GCSE Statistics • Understand use the statistical problem solving process. • Appreciate the use of Statistics in real life Synoptic – seeing things together …
The statistical problem solving process Real world Statistical world
The statistical problem solving process Statistical world
The statistical problem solving process Real world
The statistical problem solving process Real world and Statistical modelling
Subject-specific skills • Content skills and • Process skills • Statistical techniques and • Statistical thinking
Subject-specific skills • Using and applying standard statistical techniques • Interpreting and reasoning statistically • Addressing statistical problems by using the statistical enquiry cycle
Using and applying standard statistical techniques • Collecting and representing data • Calculating summary statistics and calculating probabilities • Accurately recalling appropriate facts, terminology, definitions and procedures • Using and interpreting appropriate notation correctly
Interpreting and reasoning statistically • Interpreting statistical information and results in the context of the given problem • Reasoning statistically to draw conclusions from statistical information • Communicating findings accurately • Making deductions and inferences
Addressing statistical problems using the statistical enquiry cycle • Assessing the appropriateness of statistical methodologies • Assessing the appropriateness of the conclusions drawn • Translating a real world problem into a series of statistical processes • Critically evaluating a given way of presenting information • Evaluating methods used and results obtained in the context of the given problem • Evaluating solutions to identify how they may have been affected by assumptions made.
Assessment Objectives • Demonstrate knowledge and understanding, using appropriate terminology and notation, of standard techniques used to Collect and represent data Calculate summary statistics and probabilities • Interpret statistical information and results in context and reason statistically to draw conclusions • Assess the appropriateness of statistical methodologies and the conclusions drawn through the application of the statistical enquiry cycle.
Becoming confident with Statistics Subject-specific skills • Content skills and Process skills • Statistical techniques and Statistical thinking
Becoming confident with Statistics • Every Statistics lesson is an opportunity to develop Statistical Techniques • Every Statistics lesson is an opportunity to develop Statistical Thinking § Statistical problem solving process § Statistics in real-life
Statistics in real-life The timeline can be accessed from the following link: http: //www. statslife. org. uk/images/pdf/timeline-of-statistics. pdf
Timeline of Statistics
Session 2 Specification Guidance
Planning Communicating and evaluating Statistical Enquiry Cycle Discussing and interpreting Data collection Processing, representing and analysing data
Assessment Objectives AO 1 demonstrate knowledge and understanding, using appropriate terminology and notation, of standard statistical techniques used to: collect and represent data; and calculate summary statistics and probabilities; 55% AO 2 interpret statistical information and results in context and reason statistically to draw conclusions; 25% AO 3 assess the appropriateness of statistical methodologies and the 20% conclusions drawn through the application of the statistical enquiry cycle.
AO Weightings 55% OVERALL 25% 60% Unit 1 25% 50% Unit 2 0% 10% 20% 15% 25% 30% 40% AO 1 50% AO 2 AO 3 60% 25% 70% 80% 90% 100%
AO Example: Pictogram The pictogram shows the number of pupils absent each day during one week. KEY: Monday Tuesday Wednesday Thursday Friday = 2 pupils
Brief Outline of Content 1. Planning and data collection 2. Data organisation 3. Diagrams 4. Calculations 5. Probability 6. Special distributions
Planning and Data Collection 1. Questions and hypotheses 2. Variables, data and data sources 3. Sampling 4. Obtaining data: experiment, survey, etc 5. Problems: outliers, non-response, etc
Questions and Hypotheses QUESTION HYPOTHESIS Does more revision result in a better mark? There is a positive correlation between the number of hours spent on revision and the mark in the test. Is the weather better at the coast The average number of hours of than inland? sunshine is greater at the coast than inland. Is GCSE Statistics worth doing? Those who have GCSE Statistics get better A-Level results than those who don’t.
Simple Random Sample
Simple Random Sample
Simple Random Sample
Simple Random Sample
Simple Random Sample
Systematic Sample
Systematic Sample
Systematic Sample
Systematic Sample
Stratified Sampling Sample Population
Cluster Sampling Theoretical structure of the Population
Cluster Sampling Actual structure of the Population
Cluster Sampling Select one cluster as the sample
Data Organisation 1. Tally chart 2. Frequency table 3. Grouped frequency table 4. Two-way table 5. Venn diagram 6. Stem and leaf diagram
Venn Diagram Even Prime 5 4 2 6 3 1
Venn Diagram Even 8 6 4 64 9 Square 27 1 Cube
Diagrams 1. Pictogram 8. Cumulative frequency 2. Bar chart 9. Box plot 3. Compound bar chart 10. Scatter diagram 4. Multiple bar chart 11. Time series 5. Pie chart 12. Control chart 6. Comparative pie chart 13. Population pyramid 7. Histogram 14. Choropleth map
Bar Charts Compound (stacked) Multiple (grouped) Frequency or Percentage A B C X Y Z
Comparative Pie Chart r R A B C D
Histogram Frequency On Foundation Tier, the class widths will be equal so knowledge of frequency density is not required. Length (cm)
Histogram Frequency Density On Higher Tier, the class widths may be unequal so frequency density is required. Length (cm)
Cumulative Frequency 60 60 50 50 40 40 30 30 20 20 10 10 0 0 15 20 25 30 35 40 45 50
Box Plot LQ Smallest Value 25% 50% Median 25% UQ Largest Value 25% 50%
Scatter Graphs y Response Variable A line of best fit should start and end at the first and last points. Explanatory Variable x
Time Series 90 80 70 Sales (£ 000) 60 50 40 30 20 10 0 Q 1 Q 2 Q 3 Year 1 Q 4 Q 1 Q 2 Q 3 Year 2 Q 4 Q 1 Q 2 Q 3 Year 3 Q 4
Control Chart Upper action Line Upper warning line Target line Lower warning line Lower action Line 1 2 3 4 5 6 7 8 Sample Number
Control Chart Upper action Line Upper warning line Process is under control Target line Lower warning line Lower action Line 1 2 3 4 5 6 7 8 Sample Number
Control Chart Upper action Line Upper warning line Target line Lower warning line Lower action Line 1 2 3 4 5 6 7 8 Sample Number
Control Chart Upper action Line Upper warning line Process needs checked Target line Lower warning line Lower action Line Process needs checked 1 2 3 4 5 6 7 8 Sample Number
Control Chart Upper action Line Upper warning line Target line Lower warning line Lower action Line 1 2 3 4 5 6 7 8 Sample Number
Control Chart Process is out of control Upper action Line Upper warning line Target line Lower warning line Lower action Line Process is out of control 1 2 3 4 5 6 7 8 Sample Number
Control Chart Upper action Line Upper warning line Target line Lower warning line Lower action Line 1 2 3 4 5 6 7 8 Sample Number
Population Pyramid 80 + 70 – 80 60 – 70 50 – 60 40 – 50 30 – 40 20 – 30 10 – 20 0 – 10 MALE FEMALE
Choropleth Map
Choropleth Map
1. 2. 3. 4. 5. 6. 7. 8. 9. Calculations Mean, mode, median, range, geometric mean Median, quartiles, IQR Deciles and percentiles Moving averages Standard deviation Index numbers: simple, chain base, weighted Standardised scores Product moment Spearman’s rank
Percentiles 60 50 40 30 20 17 10 0 15 20 25 30 P 34 35 40 45 50
Standard Deviation Any correct formula/method may be used. Candidates can use calculator functions to calculate but should know which button(s) to use. Knowledge of s 2 as an estimate for 2 is not needed and should not be used.
Simple Index Numbers Year 2012 2014 2015 2016 2017 Price 38 p 39 p 44 p 48 p 47 p 51 p Simple Index No. 100 102. 6 115. 8 126. 3 123. 7 134. 2 = 123. 7 Price has increased by 23. 7% since 2012.
Chain Base Index Numbers Year 2012 2014 2015 2016 2017 Price 38 p 39 p 44 p 48 p 47 p 51 p Chain base index No. 100 102. 6 115. 8 126. 3 123. 7 134. 2 = 97. 9 Price has decreased by 2. 1% since 2015
Probability 1. The probability scale 2. Relative frequency as an estimate 3. Equally likely outcomes 4. Expected frequency 5. Risk 6. Venn diagrams 7. Tree diagrams
Absolute Risk
Distributions 1. The binomial distribution as a model 2. The normal distribution as a model
Session 3 Guidance on Unit 2 (pre-release)
Unit 2 is designed to give candidates the opportunity to apply their knowledge of the Statistical Enquiry Cycle to published statistics in a prescribed context. This is a unique feature of the CCEA GCSE Statistics. OVERALL 55% Unit 1 25% 60% Unit 2 25% 50% 0% 10% 20% 15% 25% 30% 40% AO 1 50% AO 2 AO 3 60% 25% 70% 80% 90% 100%
Unit 2 The Unit 2 examination will test candidates’ knowledge and understanding of the components of the Statistical Enquiry Cycle as applied to the prescribed context. Contexts will be realistic, current and local. Pre-release material will be uploaded to the GCSE Statistics microsite in September for the forthcoming examination. Candidates will not need to memorise any information from the prerelease material and will not need a copy of it in the examination.
Unit 2 is not an investigation, nor will the entire paper be based on the pre-release material. Questions will fall into one of three categories: o directly related to pre-release; o inspired by or indirectly related to pre-release; o not connected to pre-release.
Example
Session 4 Foundation Tier New Topics
Foundation Tier ‘New’ Topics • • • Correlation and Correlation coefficients Data sets Sampling Control Charts Simple index numbers
Statistics in the news Franz H. Messerli, M. D.
The Vending Machine
Correlation and Correlation Coefficients The Vending Machine Chocolate Bar Option 40 Option 42 Option 44 Option 45 Option 46 Option 47 Option 50 Option 51 Option 52 Option 53 Option 54 Option 55 Option 56 Option 57 Option 60 Option 63 Weight (g) 48 51 50 40 46 55 48 38 43 36 42 54 45 43 36 49 Energy (kcal) 245 228 248 203 248 186 236 198 204 194 229 278 240 228 199 249 Manufacturer 1 Manufacturer 2 Manufacturer 3 Manufacturer 2 Manufacturer 4 Manufacturer 2 Manufacturer 1 Manufacturer 4 Manufacturer 4 Price £ 0. 80 £ 2. 00 £ 0. 80 £ 0. 95 £ 0. 90 £ 0. 95
Correlation and correlation coefficients Chocolate bars 300 250 200 Energy (kcal)150 100 50 0 0 10 20 30 Weight (g) 40 50 60
Correlation and Correlation coefficients Chocolate bars 300 250 200 Energy (kcal)150 100 50 0 0 10 20 30 Weight (g) 40 50 60
Correlation and Correlation coefficients Chocolate bars 300 250 200 Energy (kcal)150 100 50 0 0 10 20 30 Weight (g) 40 50 60
Correlation and Correlation coefficients Weight (g) Energy (kcal) 48 245 51 228 50 248 40 203 46 248 55 186 48 236 38 198 43 204 36 194 42 229 54 278 45 240 43 228 36 199 49 249 r= 0. 549220635 Weight (g) 48 51 50 40 46 48 38 43 36 42 54 45 43 36 49 Energy (kcal) 245 228 248 203 248 236 198 204 194 229 278 240 228 199 249 r= 0. 889324614
Data sets • • • The Vending Machine Chocolate bars The Melmount Medical Centre Quality Irish Potatoes Crisps (Multipacks) Food Hampers
Sampling
Control Charts • The graph below shows values within the action lines. No action is required. It is not possible for every sample mean to be exactly on target.
Control Charts The graph below shows the quality assurance chart for a soft drink company. They measure a sample of cans every half hour and record the sample median on the chart. The target median is set at 332 ml to ensure the capacity doesn’t drop below the stated amount (330 ml).
Simple index numbers • For example, for the data in the table below, calculate the simple price indices for 2015 and 2016 relative to 2014 (the base period) These index numbers show that: prices in 2015 increased by 5% relative to 2014 prices in 2016 increased by 8. 9% relative to 2014
Session 5 New Topics for Higher Tier
‘New’ Topics 1. Cumulative frequency diagrams (discrete data) 2. Use of the geometric mean 3. Correlation and regression 4. Absolute and relative risk 5. The binomial distribution
Session 6 Cross-curricular Themes Thinking skills and Personal Capabilities
• Cross-Curricular Skills § Communication skills § Using Mathematics skills § Using ICT skills • Thinking Skills and Personal Capabilities § Self-Management skills § Working with Others Skills § Problem Solving skills
The statistical problem solving process Students should be able to understand use the statistical problem-solving process by: • planning; • collecting data; • processing, representing and analysing data; • discussing and interpreting results; and • communicating in a variety of forms such as written, tabular or diagrammatic.
Communication Skills • Written Communication Skills § Reading § Writing • Oral Communication Skills § Listening § Presenting
Not just literacy but Statistical literacy True ease in writing comes from art, not chance, as those move easiest who have learn’d to dance. Alexander Pope 1688 – 1744 The limits of my language mean the limits of my world. Ludwig Wittgenstein 1889 – 1951
Using Mathematics • Understand use positive and negative numbers of any size in practical contexts. • Carry out statistical calculations with numbers of any size in practical contexts, to a suitable degree of accuracy.
Using Mathematics • Understand use equivalences between fractions, decimals and percentages. • Understand, use and calculate ratio and proportion, including problems using scale.
Using Mathematics • Understand use statistical formulae. § § § § Calculating the angle for a sector in a pie chart. Frequency density for a histogram Calculation of arithmetic mean Range Interquartile range Probability 4 point moving averages
Using ICT • Scientific calculators • Spreadsheets • The Internet
Use techniques such as names drawn from a hat, dice, cards, random number lists or random numbers from a calculator or spreadsheet to select a random sample. Collect data using methods such as experiment, data logging, survey, reference, census, simulation, questionnaires and/or observation and demonstrate understanding of when these methods are appropriate. Calculate a product moment correlation coefficient using calculator functions or spreadsheet functions and demonstrate knowledge that correlation coefficients are used when the data are random on random. Calculate standard deviation using a formula or calculator functions for a small set of ungrouped data or large set of grouped data and interpret standard deviation as a measure of spread. Use and interpret a given line of best fit for a scatter diagram including outputs from software.
• Working with others § Interpersonal skills § Working in a team § Leading others • Self-management § Aiming High § Remaining positive
Problem Solving skills • Statistical problem solving § Creativity § Problem Solving • Ask Questions § Why? Who? What? Where? When? How? Which?
Problem solving skills A data rich world - Knowledge Economy Human Endeavour – ‘Curiosity based research’ Beyond the Timeline …?