
GBTA BTI Outlook for Global U S Business

GBTA BTI™ Outlook for Global & U. S. Business Travel GBTA Austin- April 11, 2017 Jon Gray, Principal Rockport Analytics
The GBTA & Rockport Analytics Partnership • Ongoing strategic partnership • Research sponsors include CWT, American Express, IHG, Visa, Boeing, etc. • Sampling of Research Engagements: – Travel Price Forecast – Economic Impact of Business Travel (U. S. , Mexico & Canada) – The ROI of Business Travel – GBTA Business Traveler Sentiment Index – Study of the Chinese Meetings Market – Study of Project Based Business Travel – BTI™ Outlooks (Global + 10 individual countries) Copyright © 2017 Rockport Analytics, LLC. All Rights Reserved. 2
What is the GBTA BTI™? • Conducting the 9 th Annual GBTA Global BTI™ study in 2017 • Also conduct deeper dive (quarterly or biannual study of business travel) in 10 major business travel markets around the world • Demand-side measurements of business travel -all types of business trips and all spending while on a trip • Input/output approach puts T&E on par with labor, material, and other business inputs • Travel spend is a function of industry sales & sector travel intensity • Projections driven by global economy, travel productivity, travel supply capacity, travel pricing, and relevant policy issues • 75 countries by 48 industries historic trends and forecasts –the “Datacube” Copyright © 2017 Rockport Analytics, LLC. All Rights Reserved. 3
The BTI™ Methodology For 10 specific markets, Rockport Analytics developed an econometric model to better inform the forecast process. The model relates measures of business travel spending to key economic and market drivers of business travel including: § Gross Domestic Product (GDP) and its components § Employment & Unemployment § Corporate profit performance § Measures of Business & Consumer Confidence § International Trade, Foreign Direct Investment, and Exchange Rates § Commodity & Oil Prices § Inflation Measures § Productivity Rates for Business Travel § International Air Transport Association (IATA) Passenger & Revenue § Smith Travel Research (STR) Global Hotel Performance Model results combined with anecdotal information and judgment to produce the GBTA BTI™ Outlook Copyright © 2017 Rockport Analytics, LLC. All Rights Reserved. 4
GBTA BTI™ Outlook Global Business Travel Performance 5
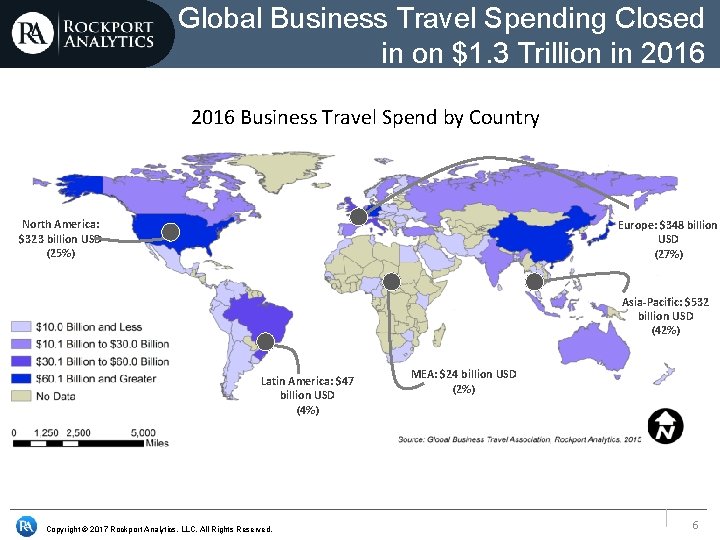
Global Business Travel Spending Closed in on $1. 3 Trillion in 2016 Business Travel Spend by Country North America: $323 billion USD (25%) Europe: $348 billion USD (27%) Asia-Pacific: $532 billion USD (42%) Latin America: $47 billion USD (4%) Copyright © 2017 Rockport Analytics, LLC. All Rights Reserved. MEA: $24 billion USD (2%) 6
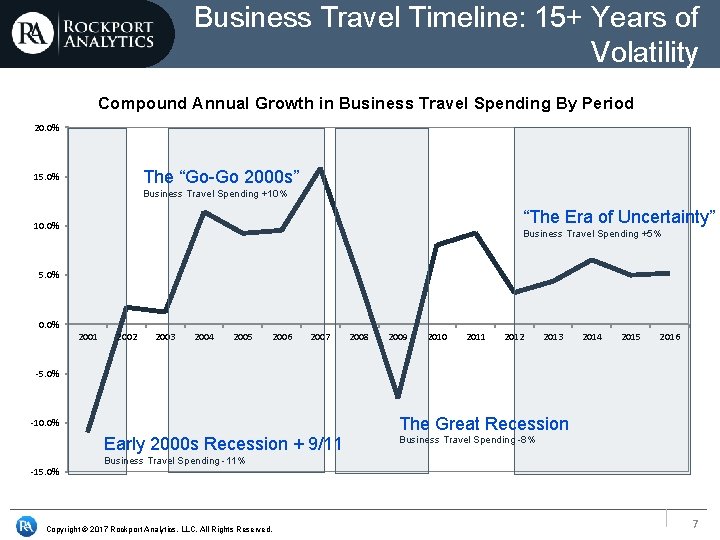
Business Travel Timeline: 15+ Years of Volatility Compound Annual Growth in Business Travel Spending By Period 20. 0% The “Go-Go 2000 s” 15. 0% Business Travel Spending +10% “The Era of Uncertainty” 10. 0% Business Travel Spending +5% 5. 0% 0. 0% 2001 2002 2003 2004 2005 2006 2007 2008 2009 2010 2011 2012 2013 2014 2015 2016 -5. 0% The Great Recession -10. 0% Early 2000 s Recession + 9/11 -15. 0% Business Travel Spending -8% Business Travel Spending -11% Copyright © 2017 Rockport Analytics, LLC. All Rights Reserved. 7
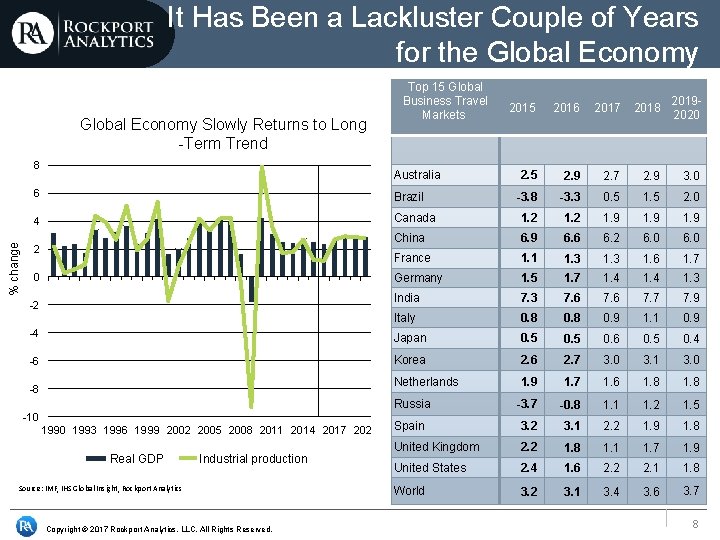
It Has Been a Lackluster Couple of Years for the Global Economy Slowly Returns to Long -Term Trend % change 8 Top 15 Global Business Travel Markets 2019 - 2020 2015 2016 2017 2018 2. 5 2. 9 2. 7 2. 9 3. 0 -3. 8 -3. 3 0. 5 1. 5 2. 0 Australia 6 Brazil 4 Canada 1. 2 1. 9 China 6. 9 6. 6 6. 2 6. 0 France 1. 1 1. 3 1. 6 1. 7 Germany 1. 5 1. 7 1. 4 1. 3 India 7. 3 7. 6 7. 7 7. 9 Italy 0. 8 0. 9 1. 1 0. 9 -4 Japan 0. 5 0. 6 0. 5 0. 4 -6 Korea 2. 6 2. 7 3. 0 3. 1 3. 0 Netherlands 1. 9 1. 7 1. 6 1. 8 Russia -3. 7 -0. 8 1. 1 1. 2 1. 5 Spain 3. 2 3. 1 2. 2 1. 9 1. 8 United Kingdom 2. 2 1. 8 1. 1 1. 7 1. 9 United States 2. 4 1. 6 2. 2 2. 1 1. 8 World 3. 2 3. 1 3. 4 3. 6 3. 7 2 0 -2 -8 -10 1993 1996 1999 2002 2005 2008 2011 2014 2017 2020 Real GDP Industrial production Source: IMF, IHS Global Insight, Rockport Analytics Copyright © 2017 Rockport Analytics, LLC. All Rights Reserved. 8
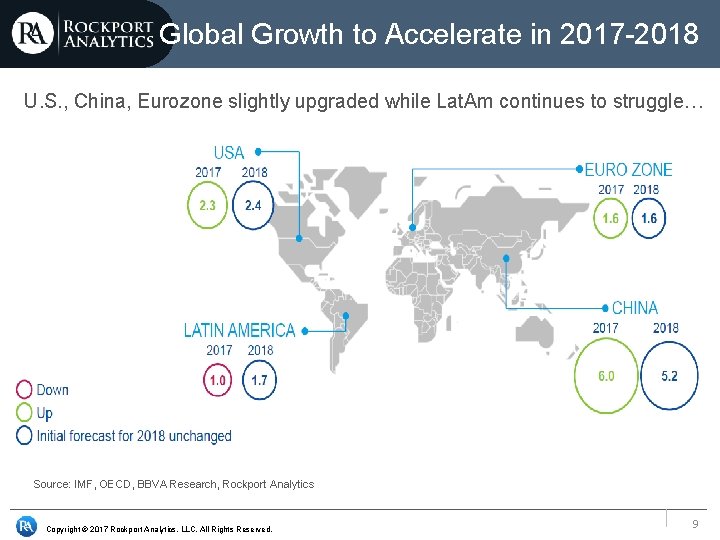
Global Growth to Accelerate in 2017 -2018 U. S. , China, Eurozone slightly upgraded while Lat. Am continues to struggle… Source: IMF, OECD, BBVA Research, Rockport Analytics Copyright © 2017 Rockport Analytics, LLC. All Rights Reserved. 9
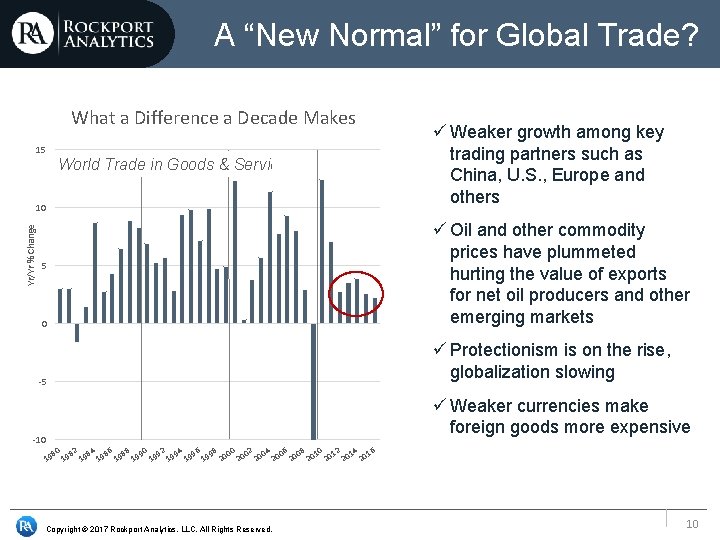
A “New Normal” for Global Trade? What a Difference a Decade Makes 15 World Trade in Goods & Services Yr/Yr % Change 10 ü Weaker growth among key trading partners such as China, U. S. , Europe and others ü Oil and other commodity prices have plummeted hurting the value of exports for net oil producers and other emerging markets 5 0 ü Protectionism is on the rise, globalization slowing -5 ü Weaker currencies make foreign goods more expensive -10 80 982 984 986 988 990 992 994 996 998 000 002 004 006 008 010 012 014 016 1 2 2 2 1 1 1 1 2 2 2 1 19 Copyright © 2017 Rockport Analytics, LLC. All Rights Reserved. 10
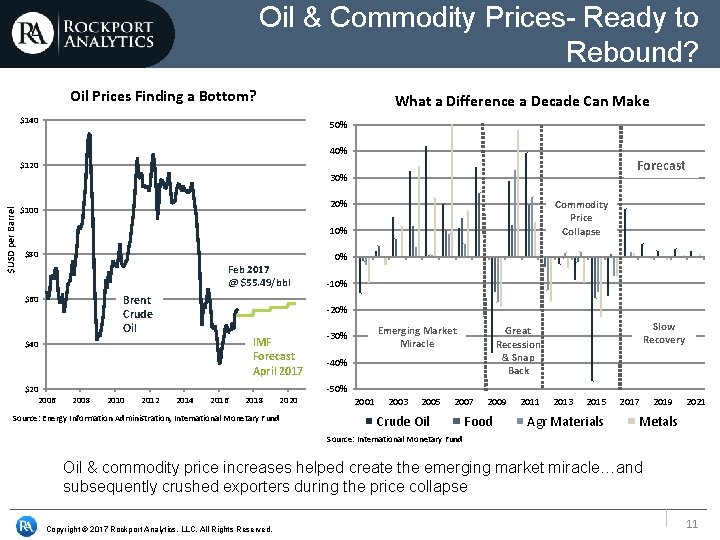
Oil & Commodity Prices- Ready to Rebound? Oil Prices Finding a Bottom? What a Difference a Decade Can Make $140 50% 40% Forecast $120 $USD per Barrel 30% Commodity Price Collapse 20% $100 10% $80 Feb 2017 @ $55. 49/bbl Brent Crude Oil $60 2008 2010 2012 -10% -20% IMF Forecast April 2017 $40 $20 2006 0% 2014 2016 2018 2020 Source: Energy Information Administration, International Monetary Fund Emerging Market Miracle -30% Slow Recovery Great Recession & Snap Back -40% -50% 2001 2003 2005 2007 Crude Oil 2009 Food 2011 2013 2015 Agr Materials 2017 2019 2021 Metals Source: International Monetary Fund Oil & commodity price increases helped create the emerging market miracle…and subsequently crushed exporters during the price collapse Copyright © 2017 Rockport Analytics, LLC. All Rights Reserved. 11
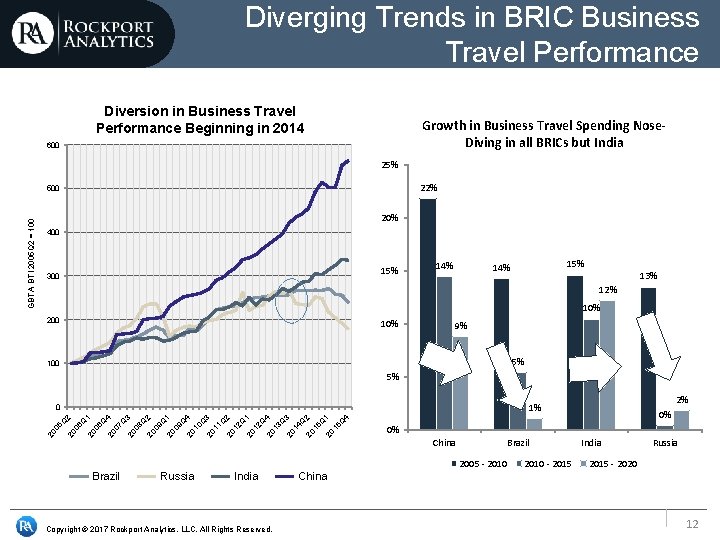
Diverging Trends in BRIC Business Travel Performance Diversion in Business Travel Performance Beginning in 2014 Growth in Business Travel Spending Nose. Diving in all BRICs but India 600 25% 22% 20% 400 15% 300 14% 15% 14% 13% 12% 10% 200 10% 9% 5% 100 5% 2% 1% Q 15 20 0% China Brazil 2005 - 2010 Brazil Russia India Copyright © 2017 Rockport Analytics, LLC. All Rights Reserved. 0% 4 1 Q 20 15 3 Q 20 14 4 Q 20 12 Q 20 13 1 2 12 20 11 Q 20 10 20 Q 3 4 Q 1 09 20 Q 2 09 20 Q 3 08 20 Q 4 07 20 Q 1 06 20 Q 06 20 05 Q 2 0 20 GBTA BTI 2005 Q 2 = 100 500 2010 - 2015 India Russia 2015 - 2020 China 12
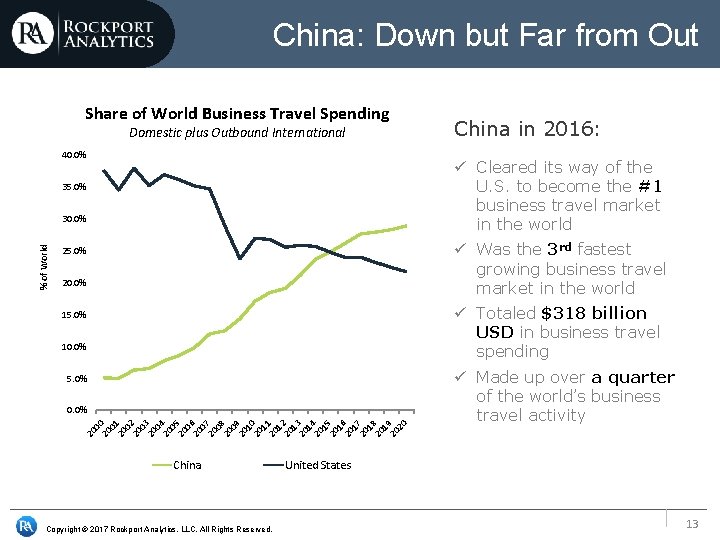
China: Down but Far from Out Share of World Business Travel Spending Domestic plus Outbound International 40. 0% ü Cleared its way of the U. S. to become the #1 business travel market in the world 35. 0% 30. 0% % of World China in 2016: ü Was the 3 rd fastest growing business travel market in the world 25. 0% 20. 0% ü Totaled $318 billion USD in business travel spending 15. 0% 10. 0% 5. 0% 20 0 0 20 1 02 20 0 20 3 0 20 4 0 20 5 0 20 6 0 20 7 0 20 8 0 20 9 1 20 0 1 20 1 1 20 2 1 20 3 1 20 4 1 20 5 1 20 6 1 20 7 1 20 8 1 20 9 20 0. 0% China Copyright © 2017 Rockport Analytics, LLC. All Rights Reserved. ü Made up over a quarter of the world’s business travel activity United States 13
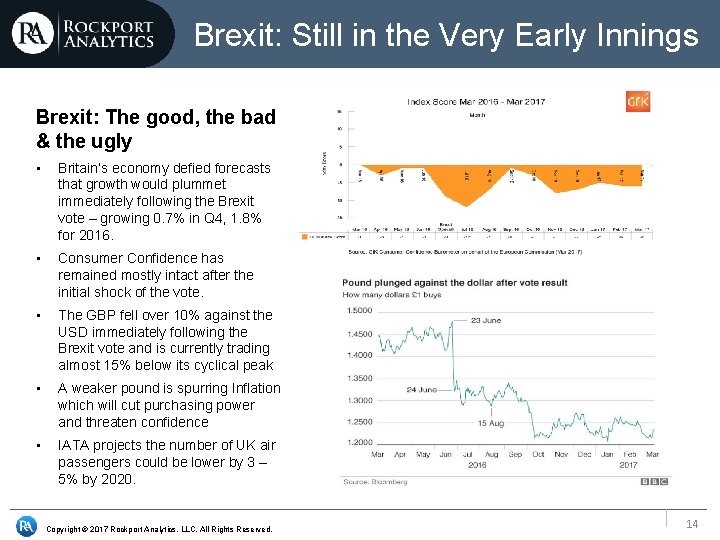
Brexit: Still in the Very Early Innings Brexit: The good, the bad & the ugly • Britain’s economy defied forecasts that growth would plummet immediately following the Brexit vote – growing 0. 7% in Q 4, 1. 8% for 2016. • Consumer Confidence has remained mostly intact after the initial shock of the vote. • The GBP fell over 10% against the USD immediately following the Brexit vote and is currently trading almost 15% below its cyclical peak • A weaker pound is spurring Inflation which will cut purchasing power and threaten confidence • IATA projects the number of UK air passengers could be lower by 3 – 5% by 2020. Copyright © 2017 Rockport Analytics, LLC. All Rights Reserved. 14
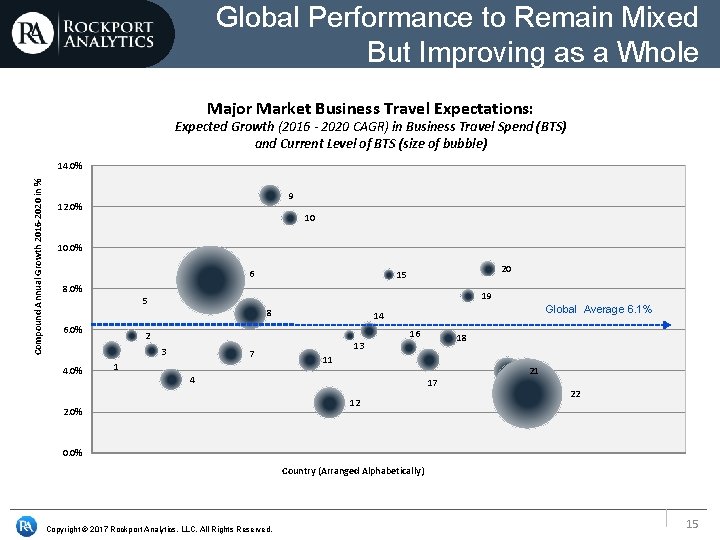
Global Performance to Remain Mixed But Improving as a Whole Major Market Business Travel Expectations: Expected Growth (2016 - 2020 CAGR) in Business Travel Spend (BTS) and Current Level of BTS (size of bubble) Compound Annual Growth 2016 -2020 in % 14. 0% 9 12. 0% 10 10. 0% 6 8. 0% 19 5 6. 0% 8 7 1 Global Average 6. 1% 14 2 3 4. 0% 20 15 13 16 11 4 2. 0% 18 17 12 21 22 0. 0% Country (Arranged Alphabetically) Copyright © 2017 Rockport Analytics, LLC. All Rights Reserved. 15
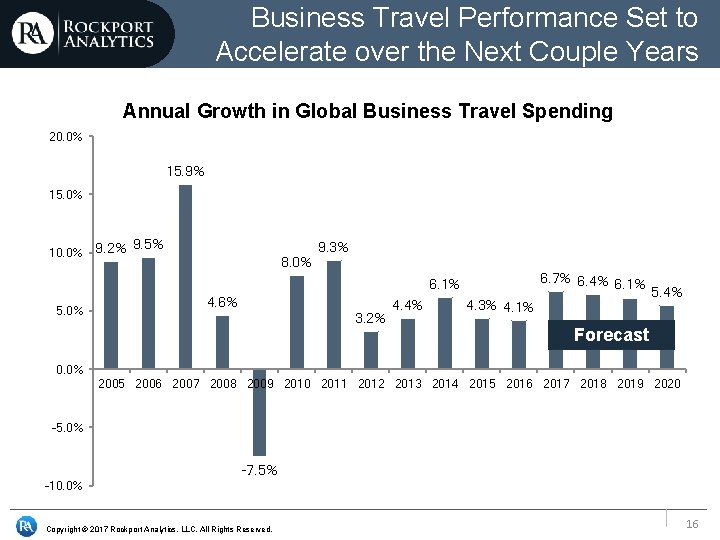
Business Travel Performance Set to Accelerate over the Next Couple Years Annual Growth in Global Business Travel Spending 20. 0% 15. 9% 15. 0% 10. 0% 9. 2% 9. 5% 8. 0% 9. 3% 6. 7% 6. 4% 6. 1% 5. 0% 4. 6% 3. 2% 4. 4% 4. 3% 4. 1% 5. 4% Forecast 0. 0% 2005 2006 2007 2008 2009 2010 2011 2012 2013 2014 2015 2016 2017 2018 2019 2020 -5. 0% -7. 5% -10. 0% Copyright © 2017 Rockport Analytics, LLC. All Rights Reserved. 16
GBTA BTI™ Outlook U. S. Business Travel Performance 17
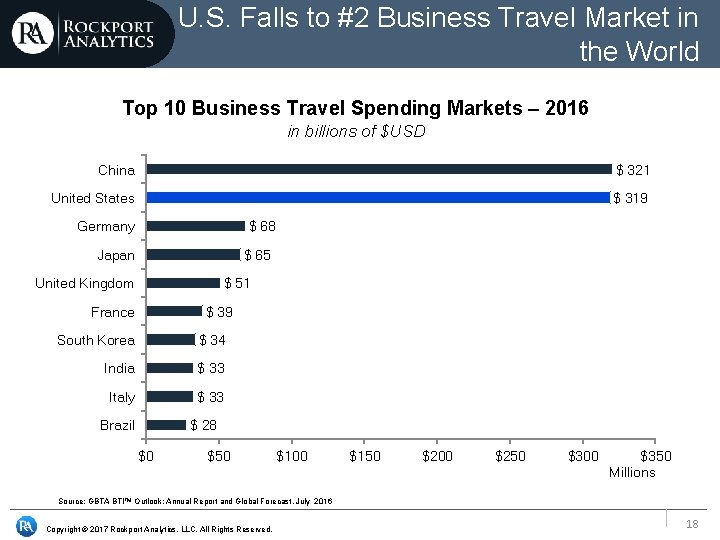
U. S. Falls to #2 Business Travel Market in the World Top 10 Business Travel Spending Markets – 2016 in billions of $USD China $ 321 United States $ 319 Germany $ 68 Japan $ 65 United Kingdom $ 51 France $ 39 South Korea $ 34 India $ 33 Italy $ 33 Brazil $ 28 $0 $50 $100 $150 $200 $250 $300 $350 Millions Source: GBTA BTI™ Outlook: Annual Report and Global Forecast, July 2016 Copyright © 2017 Rockport Analytics, LLC. All Rights Reserved. 18
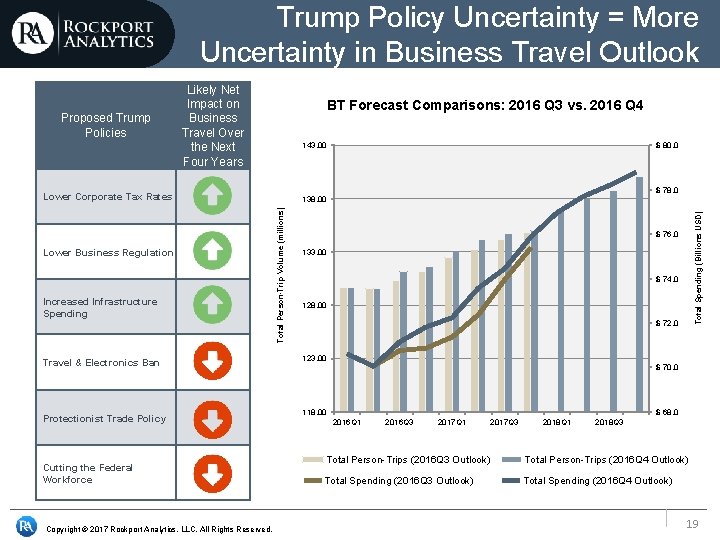
Trump Policy Uncertainty = More Uncertainty in Business Travel Outlook Lower Business Regulation Increased Infrastructure Spending Cutting the Federal Workforce $ 80. 0 $ 78. 0 138. 00 $ 76. 0 133. 00 $ 74. 0 128. 00 $ 72. 0 123. 00 Travel & Electronics Ban Protectionist Trade Policy 143. 00 Copyright © 2017 Rockport Analytics, LLC. All Rights Reserved. Total Spending (Billions USD) Lower Corporate Tax Rates BT Forecast Comparisons: 2016 Q 3 vs. 2016 Q 4 Total Person-Trip Volume (millions) Proposed Trump Policies Likely Net Impact on Business Travel Over the Next Four Years $ 70. 0 118. 00 $ 68. 0 2016 Q 1 2016 Q 3 2017 Q 1 2017 Q 3 2018 Q 1 2018 Q 3 Total Person-Trips (2016 Q 3 Outlook) Total Person-Trips (2016 Q 4 Outlook) Total Spending (2016 Q 3 Outlook) Total Spending (2016 Q 4 Outlook) 19
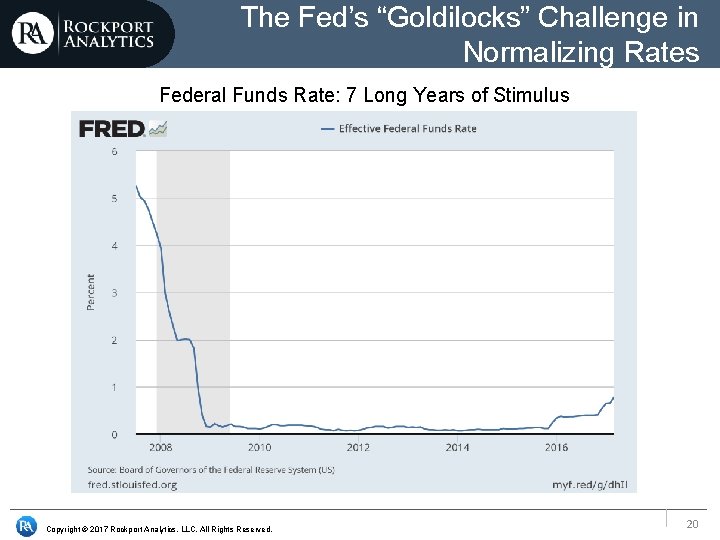
The Fed’s “Goldilocks” Challenge in Normalizing Rates Federal Funds Rate: 7 Long Years of Stimulus Copyright © 2017 Rockport Analytics, LLC. All Rights Reserved. 20
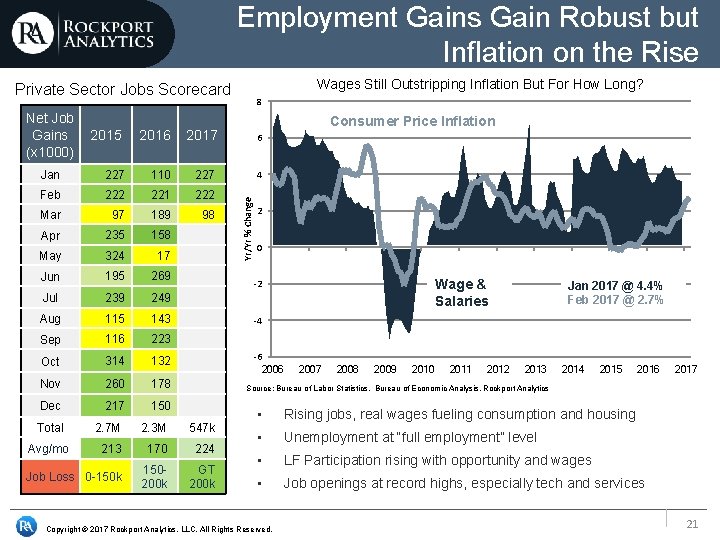
Employment Gains Gain Robust but Inflation on the Rise Wages Still Outstripping Inflation But For How Long? Private Sector Jobs Scorecard Consumer Price Inflation 2016 2017 6 4 Jan 227 110 227 Feb 222 221 222 Mar 97 189 98 Apr 235 158 May 324 17 Jun 195 269 Jul 239 249 Aug 115 143 Sep 116 223 Oct 314 132 Nov 260 178 Dec 217 150 Total 2. 7 M 2. 3 M 547 k Avg/mo 213 170 224 Job Loss 0 -150 k 150200 k GT 200 k Yr/Yr % Change Net Job Gains 2015 (x 1000) 8 2 0 Wage & Salaries -2 Jan 2017 @ 4. 4% Feb 2017 @ 2. 7% -4 -6 2007 2008 2009 2010 2011 2012 2013 2014 2015 2016 2017 Source: Bureau of Labor Statistics, Bureau of Economic Analysis, Rockport Analytics • Rising jobs, real wages fueling consumption and housing • Unemployment at “full employment” level • LF Participation rising with opportunity and wages • Job openings at record highs, especially tech and services Copyright © 2017 Rockport Analytics, LLC. All Rights Reserved. 21
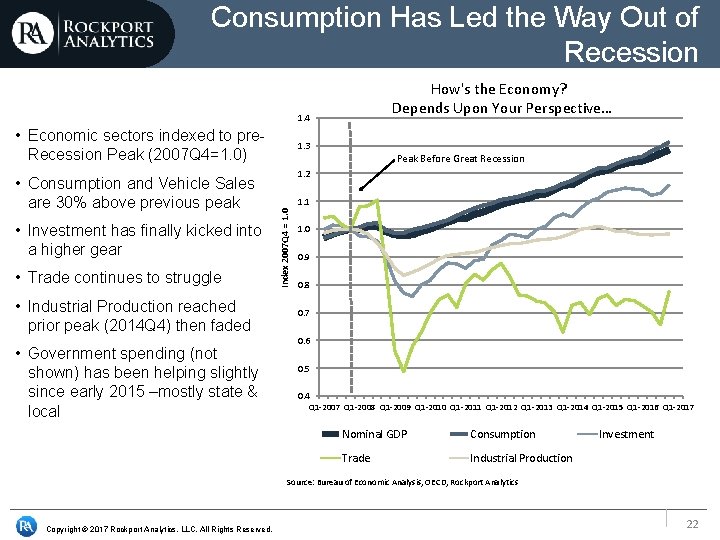
Consumption Has Led the Way Out of Recession How's the Economy? Depends Upon Your Perspective… 1. 4 • Economic sectors indexed to pre. Recession Peak (2007 Q 4=1. 0) • Investment has finally kicked into a higher gear • Trade continues to struggle • Industrial Production reached prior peak (2014 Q 4) then faded • Government spending (not shown) has been helping slightly since early 2015 –mostly state & local Peak Before Great Recession 1. 2 1. 1 Index 2007 Q 4 = 1. 0 • Consumption and Vehicle Sales are 30% above previous peak 1. 3 1. 0 0. 9 0. 8 0. 7 0. 6 0. 5 0. 4 Q 1 -2007 Q 1 -2008 Q 1 -2009 Q 1 -2010 Q 1 -2011 Q 1 -2012 Q 1 -2013 Q 1 -2014 Q 1 -2015 Q 1 -2016 Q 1 -2017 Nominal GDP Consumption Trade Industrial Production Investment Source: Bureau of Economic Analysis, OECD, Rockport Analytics Copyright © 2017 Rockport Analytics, LLC. All Rights Reserved. 22
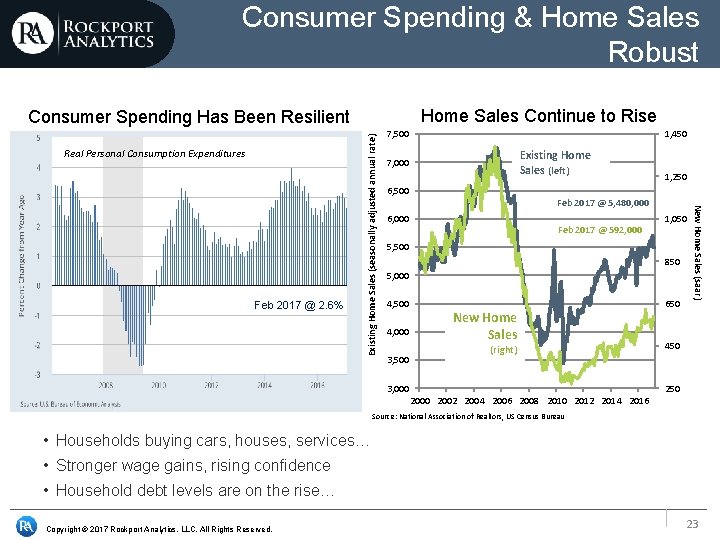
Consumer Spending & Home Sales Robust Home Sales Continue to Rise Real Personal Consumption Expenditures 7, 500 1, 450 Existing Home Sales (left) 7, 000 1, 250 6, 500 Feb 2017 @ 5, 480, 000 6, 000 Feb 2017 @ 592, 000 1, 050 5, 500 850 5, 000 4, 500 4, 000 3, 500 New Home Sales (right) 3, 000 650 New Home Sales (saar) Feb 2017 @ 2. 6% Existing Home Sales (seasonally adjusted annual rate) Consumer Spending Has Been Resilient 450 2000 2002 2004 2006 2008 2010 2012 2014 2016 Source: National Association of Realtors, US Census Bureau • Households buying cars, houses, services… • Stronger wage gains, rising confidence • Household debt levels are on the rise… Copyright © 2017 Rockport Analytics, LLC. All Rights Reserved. 23
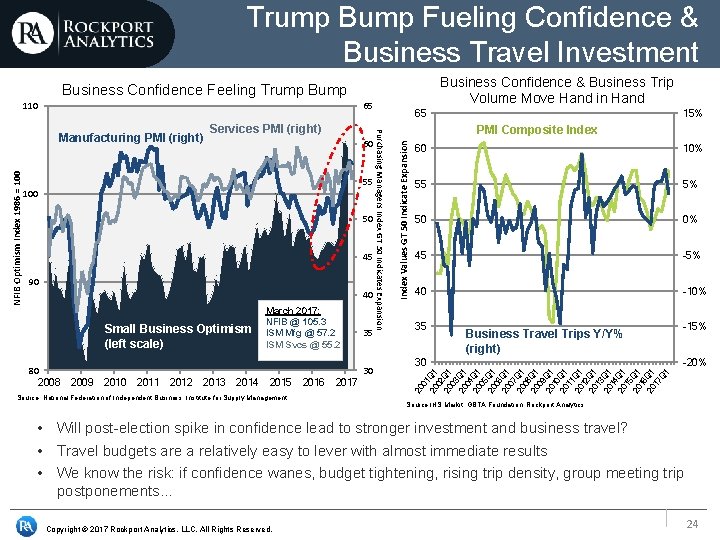
Trump Bump Fueling Confidence & Business Travel Investment Business Confidence & Business Trip Volume Move Hand in Hand Business Confidence Feeling Trump Bump 65 60 55 100 50 45 90 40 Small Business Optimism (left scale) 80 2008 March 2017: NFIB @ 105. 3 ISM Mfg @ 57. 2 ISM Svcs @ 55. 2 35 30 2009 2010 2011 2012 2013 2014 2015 Source: National Federation of Independent Business, Institute for Supply Management 2016 2017 15% PMI Composite Index Values GT 50 Indicate Expansion NFIB Optimism Index 1986 = 100 Services PMI (right) Purchasing Managers Index GT 50 Indicates Expansion Manufacturing PMI (right) 65 60 10% 55 5% 50 0% 45 -5% 40 -10% 35 Business Travel Trips Y/Y% (right) 30 -15% -20% 20 01 20 Q 1 02 20 Q 1 03 20 Q 1 04 20 Q 1 05 20 Q 1 06 20 Q 1 07 20 Q 1 08 20 Q 1 09 20 Q 1 10 20 Q 1 11 20 Q 1 12 20 Q 1 13 20 Q 1 14 20 Q 1 15 20 Q 1 16 20 Q 1 17 Q 1 110 Source IHS Markit, GBTA Foundation, Rockport Analytics • Will post-election spike in confidence lead to stronger investment and business travel? • Travel budgets are a relatively easy to lever with almost immediate results • We know the risk: if confidence wanes, budget tightening, rising trip density, group meeting trip postponements… Copyright © 2017 Rockport Analytics, LLC. All Rights Reserved. 24
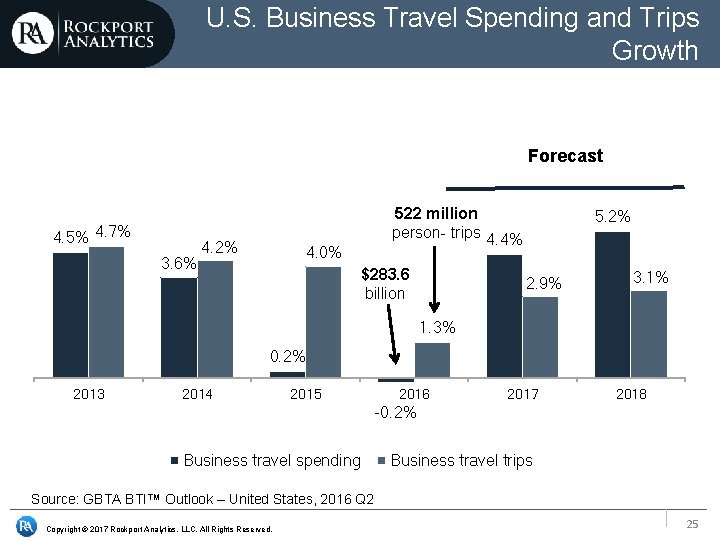
U. S. Business Travel Spending and Trips Growth Forecast 4. 5% 4. 7% 3. 6% 4. 2% 522 million person- trips 4. 4% 4. 0% $283. 6 billion 5. 2% 2. 9% 3. 1% 1. 3% 0. 2% 2013 2014 2015 2016 2017 2018 -0. 2% Business travel spending Business travel trips Source: GBTA BTI™ Outlook – United States, 2016 Q 2 Copyright © 2017 Rockport Analytics, LLC. All Rights Reserved. 25
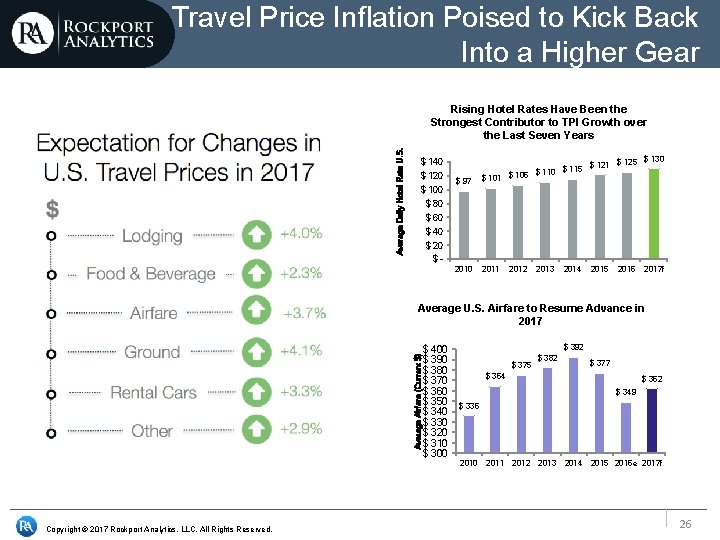
Travel Price Inflation Poised to Kick Back Into a Higher Gear Average Daily Hotel Rate U. S. Rising Hotel Rates Have Been the Strongest Contributor to TPI Growth over the Last Seven Years $ 140 $ 120 $ 100 $ 97 $ 110 $ 115 $ 101 $ 106 2010 2011 $ 130 $ 121 $ 125 $ 80 $ 60 $ 40 $ 20 $2012 2013 2014 2015 2016 2017 f Average Airfare (Current $) Average U. S. Airfare to Resume Advance in 2017 Copyright © 2017 Rockport Analytics, LLC. All Rights Reserved. $ 400 $ 390 $ 380 $ 370 $ 360 $ 350 $ 340 $ 330 $ 320 $ 310 $ 300 $ 392 $ 375 $ 382 $ 377 $ 364 $ 362 $ 349 $ 336 2010 2011 2012 2013 2014 2015 2016 e 2017 f 26
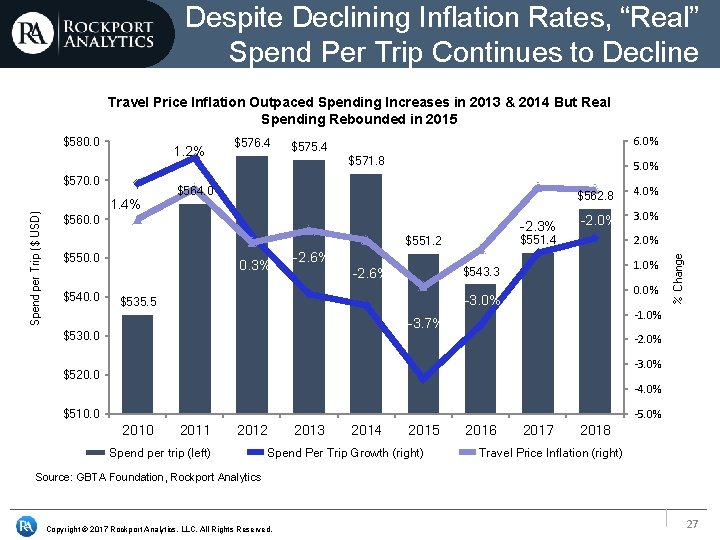
Despite Declining Inflation Rates, “Real” Spend Per Trip Continues to Decline Travel Price Inflation Outpaced Spending Increases in 2013 & 2014 But Real Spending Rebounded in 2015 1. 2% Spend per Trip ($ USD) $570. 0 1. 4% $576. 4 6. 0% $575. 4 $571. 8 5. 0% $564. 0 $560. 0 -2. 3% $540. 0 0. 3% -2. 6% 4. 0% -2. 0% 3. 0% 2. 0% $551. 4 $551. 2 $550. 0 $562. 8 1. 0% $543. 3 -2. 6% 0. 0% -3. 0% $535. 5 -1. 0% -3. 7% $530. 0 % Change $580. 0 -2. 0% -3. 0% $520. 0 -4. 0% -5. 0% $510. 0 2011 2012 Spend per trip (left) 2013 2014 2015 Spend Per Trip Growth (right) 2016 2017 2018 Travel Price Inflation (right) Source: GBTA Foundation, Rockport Analytics Copyright © 2017 Rockport Analytics, LLC. All Rights Reserved. 27
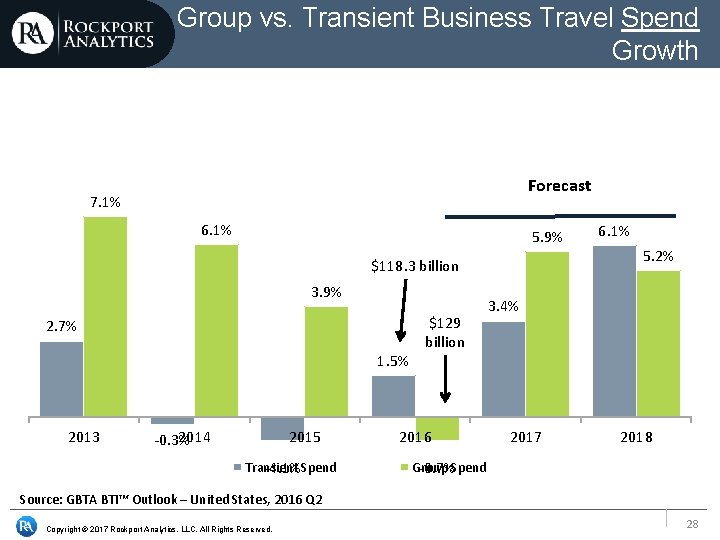
Group vs. Transient Business Travel Spend Growth Forecast 7. 1% 6. 1% 5. 9% $118. 3 billion 3. 9% 2. 7% 1. 5% 2013 2014 -0. 3% 2015 Transient -4. 1%Spend $129 billion 2016 6. 1% 5. 2% 3. 4% 2017 2018 Group -0. 7%Spend Source: GBTA BTI™ Outlook – United States, 2016 Q 2 Copyright © 2017 Rockport Analytics, LLC. All Rights Reserved. 28
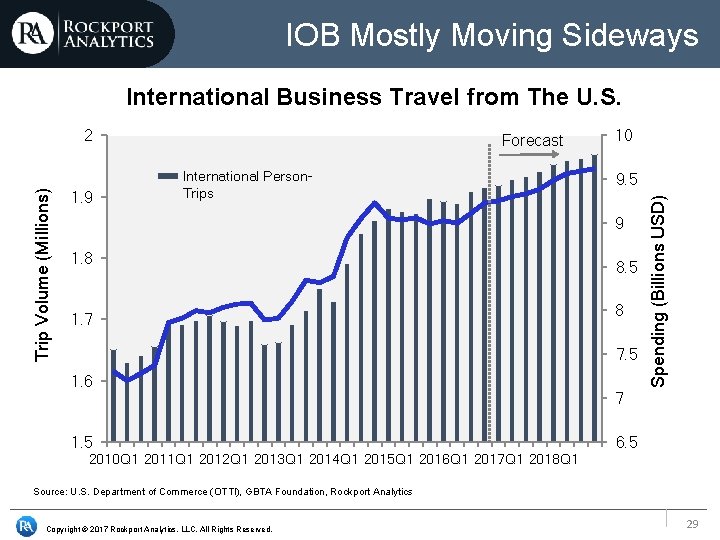
IOB Mostly Moving Sideways International Business Travel from The U. S. 1. 9 Forecast International Person. Trips 10 9. 5 9 1. 8 1. 7 8. 5 8 7. 5 1. 6 1. 5 2010 Q 1 2011 Q 1 2012 Q 1 2013 Q 1 2014 Q 1 2015 Q 1 2016 Q 1 2017 Q 1 2018 Q 1 Spending (Billions USD) Trip Volume (Millions) 2 7 6. 5 Source: U. S. Department of Commerce (OTTI), GBTA Foundation, Rockport Analytics Copyright © 2017 Rockport Analytics, LLC. All Rights Reserved. 29
Key Takeaways Uncertainty remains a key theme of the current global business travel landscape but most signs point to improving performance in 2017 and 2018 • Global trade continues to lag economic growth and hamper business travel performance. Is this a new normal? • Emerging market growth has been particularly lackluster but finally showing signs of improvement. • The growth China’s economy will continue to moderate but China’s business travel market remains the largest and one of the fastest growing markets in the world. • We are still in the early innings of “Brexit” – consumer and business confidence have remained mostly intact but rising inflation and reduced investment could undermine stability. The U. S. economy is performing well and we expect U. S. business travel to follow suit in 2017 and 2018. Policy – both fiscal & monetary – has the potential to fuel gains or derail growth in the U. S. economy and business travel markets • The U. S. economy has momentum as most key economic indicators – employment, wages, consumer & business confidence, profits – all continue to trend in the right direction. We expect all market segments (group, transient and international) business travel to improve over the next two years. • Over-tightening by the Federal Reserve remains a risk to economic performance and U. S. business travel. The Fed will have to carefully balance inflation expectations with the health of the recovery. • Trump policy expectations are mostly positive for business travel but the direction and scope of policy could significantly impact both the short and long-term prospects for business travel in the U. S. Copyright © 2017 Rockport Analytics, LLC. All Rights Reserved. 30
- Slides: 30