GBSAR system Vector Network Analyzer radio frequency Power

GB-SAR system Vector Network Analyzer : radio frequency의 발생 과 처리 Power amplifier : 신호의 증폭 RF switch : 편파의 자동 변경 Antenna : 신호의 송∙수신 Motion controller : rail에서의 움직임 제어 RS/GIS Lab. , Dept. of Geophysics, Kangwon National University 2009/11/26, EJ

실험 parameter Center frequency C-band measurement X-band measurement 5. 3 GHz 9. 65 GHz Bandwidth(BR) 600 MHz Number of samplings(NR) 1601 Power VNA(0 d. Bm)+amp(33 d. Bm) VNA(0 d. Bm)+amp(37. 8 d. Bm) Azimuth step(Δx) 5 cm Azimuth length 5 m Max. of range direction(Rmax) 200 m Angle of image(Xwidth) 0. 566 X range(max: 113 m) C-band antenna RS/GIS Lab. , Dept. of Geophysics, Kangwon National University 0. 311 X range(max: 62 m) X-band antenna 2009/11/26, EJ

실험 장소 및 시간 실험 날짜 사용 안테나 실험횟수 2008. 11/03 ~ 11/05 C-band 160 2009. 02/06 ~ 02/08 X-band 123 2009. 02/08 ~ 02/09 X-band 49 2009. 02/09 ~ 02/10 X-band 48 2009. 04/22 ~ 04/23 C-band 78 2009. 07/22 ~ 07/23 C-band 60 2009. 07/29 ~ 07/30 X-band 60 2009. 07/30 ~ 07/31 X-band 70 총 실험횟수 C-band : 298회 X-band : 350회 한국지질자원연구원 (IKONOS satellite @google earth) RS/GIS Lab. , Dept. of Geophysics, Kangwon National University 2009/11/26, EJ

trihedral corner reflector 와 실제 실험 영상 Trihedral corner reflector 시스템에서 바라 본 관찰지역 RS/GIS Lab. , Dept. of Geophysics, Kangwon National University Reflector의 배치 2009/11/26, EJ
")
GB-SAR 영상 VV-pol RS/GIS Lab. , Dept. of Geophysics, Kangwon National University C-band image(2008/11/03) X-band image(2009/02/06) VH-pol 2009/11/26, EJ
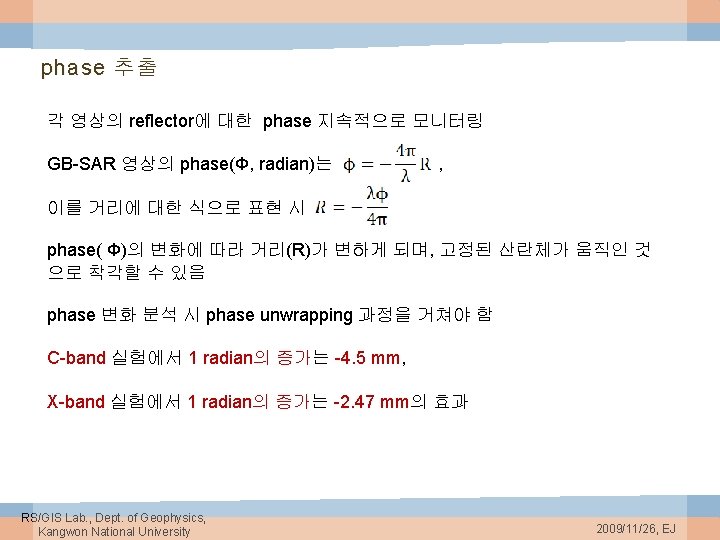
 2. 566 -10(= 2. 566 - 4π)")
phase unwrapping wrapped phase unwrapped phase (radian) 2. 566 -10(= 2. 566 - 4π) -1. 717 -8(= -1. 717 - 2π) 0. 283 -6(= 0. 283 - 2π) 2. 283 -4(= 2. 283 - 2π) -2 -2 0 0 2 2 -2. 283 4(= -2. 283 + 2π) -0. 283 6(= -0. 283 + 2π) 1. 171 8(= 1. 171 + 2π) -2. 566 10(= -2. 566 + 4π) phase 변화의 규칙성을 찾아 unwrapping 과정을 거쳐야 함 RS/GIS Lab. , Dept. of Geophysics, Kangwon National University 2009/11/26, EJ

시간에 따른 phase 변화 양상 2008/11/03, C-band VV-pol 2009/02/06, X-band VV-pol VV VH HV HH RMS phase length (radian) (mm) 08/11/03 1. 008 4. 54 1. 021 4. 60 0. 930 4. 19 0. 948 4. 27 09/04/22 1. 085 4. 89 1. 042 4. 69 1. 016 4. 58 1. 059 4. 77 09/07/22 0. 543 2. 45 0. 546 2. 46 0. 555 2. 50 0. 547 2. 46 09/02/06 0. 931 2. 30 0. 817 2. 02 0. 756 1. 87 0. 914 2. 26 09/02/08 0. 965 2. 38 1. 004 2. 50 1. 124 2. 78 0. 992 2. 45 09/02/09 1. 201 2. 97 1. 255 3. 10 1. 296 3. 20 1. 178 2. 91 09/07/29 1. 501 3. 71 1. 503 3. 71 1. 480 3. 65 1. 486 3. 67 RS/GIS Lab. , 09/07/30 Dept. of Geophysics, 1. 256 3. 10 Kangwon National University 1. 342 3. 31 1. 117 2. 76 1. 228 3. 03 Error 2009/11/26, EJ
 5 10")
GB-SAR 간섭영상 2008/11/03, C-band VV-pol -π (M 70 - -M - 1) 5 10 20 30 2160 M 1 ) π 0 RS/GIS Lab. , Dept. of Geophysics, Kangwon National University 2009/11/26, EJ
 (M 70 -M 1) (M 5 -M 1) (M 123")
(M 2 -M 1) (M 70 -M 1) (M 5 -M 1) (M 123 -M 1) (M 20 -M 1) -π RS/GIS Lab. , Dept. of Geophysics, Kangwon National University 2008/11/03, X-band VV-pol π 0 2009/11/26, EJ
![모션부분의 오차 발생 Used antenna C-band Center frequency [GHz] 5. 3 Range bandwidth [GHz]](http://slidetodoc.com/presentation_image/54d5a46fa026cbc7625456c91c2ce9bb/image-15.jpg "모션부분의 오차 발생 Used antenna C-band Center frequency [GHz] 5. 3 Range bandwidth [GHz]")
모션부분의 오차 발생 Used antenna C-band Center frequency [GHz] 5. 3 Range bandwidth [GHz] 0. 2 Number of points 1601 Azimuth Step [m] 0. 02 Azimuth length [m] 5 Rmax = 600 m Xwidth = 1. 415 X range(max: 849 m) 2007/03/19 21: 24분부터 약 2시간 측정 RS/GIS Lab. , Dept. of Geophysics, Kangwon National University 모션부분에서 발생하는 error의 경우, azimuth 방향으로의 fringe가 발생하므로 본 연구에서의 실험은 모션부분에서의 error는 아니라고 판단 2009/11/26, EJ
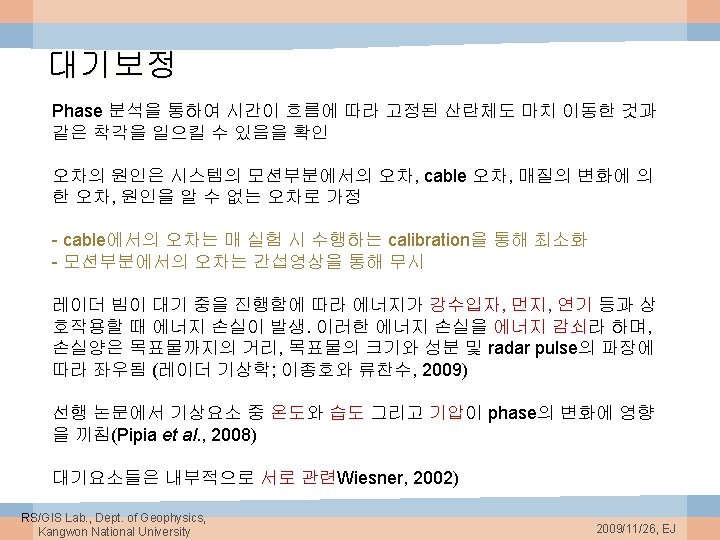
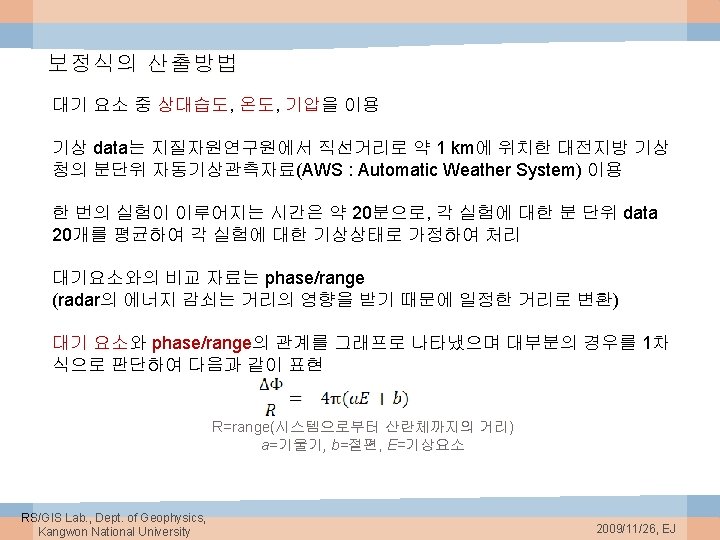
 coefficient of")
습도보정 대기 중 존재하는 수증기 및 산소는 레이더 전자파의 감쇠를 유발(Battan, 1973) coefficient of correlation C-band X-band VV VH HV HH 2008/11/03 -0. 914 -0. 888 -0. 937 -0. 918 2009/04/22 -0. 941 -0. 904 -0. 902 -0. 919 2009/07/22 -0. 973 -0. 969 -0. 965 -0. 973 2009/02/06 -0. 870 -0. 846 -0. 813 -0. 897 2009/02/08 -0. 956 -0. 949 -0. 929 -0. 961 2009/02/09 -0. 990 -0. 993 -0. 992 -0. 985 2009/07/29 -0. 935 -0. 948 -0. 946 -0. 945 2009/07/30 -0. 954 -0. 948 -0. 955 VV VH HV HH a 0. 000020 0. 000019 0. 000020 b -0. 001257 -0. 001231 -0. 001228 -0. 001255 a 0. 000027 b -0. 001232 -0. 001264 -0. 001273 -0. 001268 C-band X-band RS/GIS Lab. , Dept. of Geophysics, Kangwon National University 2009/11/26, EJ

온도보정 온도는 태양 복사의 영향을 받는 것으로 구름이 많을 경우 복사량 감소로 온도는 낮아지며, 이는 대기 중 습도가 높은 경우에도 나타남(Wiesner, 2002) coefficient of correlation C-band X-band VV VH HV HH 2008/11/03 0. 935 0. 908 0. 950 0. 931 2009/04/22 0. 873 0. 837 0. 825 0. 851 2009/07/22 0. 932 0. 926 0. 925 0. 933 2009/02/06 0. 895 0. 890 0. 873 0. 910 2009/02/08 0. 983 0. 987 0. 968 0. 986 2009/02/09 0. 988 0. 983 2009/07/29 0. 896 0. 913 0. 907 2009/07/30 0. 851 0. 853 0. 851 VV VH HV HH a -0. 000080 -0. 000081 -0. 000079 -0. 000080 b 0. 001104 0. 001235 0. 001206 0. 001213 a -0. 000125 -0. 000120 -0. 000125 b 0. 002265 0. 002241 0. 002220 0. 002256 C-band X-band RS/GIS Lab. , Dept. of Geophysics, Kangwon National University 2009/11/26, EJ

기압보정 기압의 분포는 고도와 온도의 영향을 받으며, 동일 고도의 경우 온도의 상승은 기압의 감소로 이어짐(Wiesner, 2002) coefficient of correlation C-band X-band VV VH HV HH 2008/11/03 -0. 557 -0. 538 -0. 555 -0. 544 2009/04/22 -0. 681 -0. 657 -0. 627 -0. 655 2009/07/22 -0. 871 -0. 868 -0. 864 -0. 871 2009/02/06 -0. 578 -0. 544 -0. 537 -0. 625 2009/02/08 0. 346 0. 395 0. 350 0. 371 2009/02/09 -0. 963 -0. 965 -0. 967 -0. 962 2009/07/29 -0. 772 -0. 749 -0. 750 -0. 774 2009/07/30 -0. 478 -0. 508 -0. 498 -0. 463 VV VH HV HH a 0. 000146 0. 000144 0. 000140 0. 000142 b -0. 145061 -0. 146014 -0. 141657 -0. 144005 a 0. 000140 0. 000135 b -0. 141448 -0. 141572 -0. 141048 -0. 136366 C-band X-band RS/GIS Lab. , Dept. of Geophysics, Kangwon National University 2009/11/26, EJ
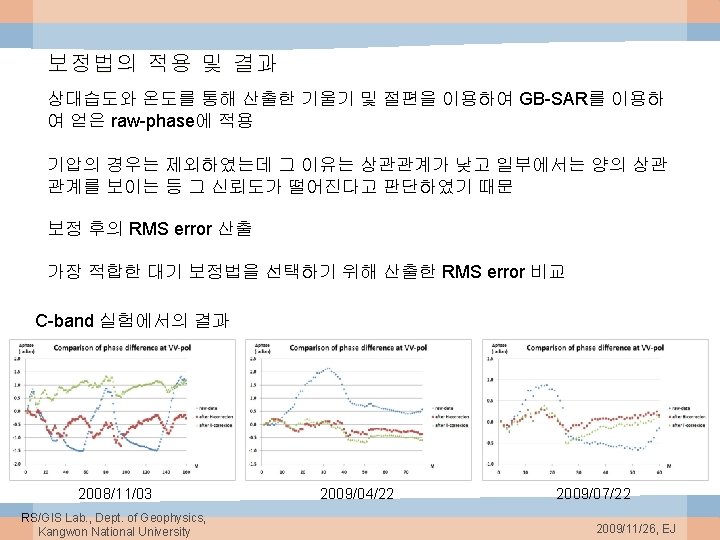

X-band 실험에서의 결과 2009/02/06 2009/02/08 2009/07/29 2009/02/09 2009/07/30 대부분의 경우에서 보정 후의 RMS error는 감소 RS/GIS Lab. , Dept. of Geophysics, Kangwon National University 2009/11/26, EJ
 2008/11/03 C-band 2009/04/22 2009/07/22 2009/02/06 2009/02/08 X-band 2009/02/09")
RMS error 의 비교 RMS error(mm) 2008/11/03 C-band 2009/04/22 2009/07/22 2009/02/06 2009/02/08 X-band 2009/02/09 2009/07/29 VV VH HV HH before correction 4. 54 4. 60 4. 19 4. 27 after H-correction 2. 74 2. 75 2. 23 2. 38 after T-correction 4. 14 4. 66 4. 52 before correction 4. 89 4. 69 4. 58 4. 77 after H-correction 1. 04 1. 26 1. 24 1. 14 after T-correction 1. 65 1. 88 1. 90 1. 74 before correction 2. 45 2. 46 2. 50 2. 46 after H-correction 0. 63 0. 68 0. 65 after T-correction 0. 96 1. 00 1. 05 0. 96 before correction 2. 30 2. 02 1. 87 2. 26 after H-correction 1. 50 1. 76 1. 93 1. 33 after T-correction 1. 92 2. 36 2. 47 1. 93 before correction 2. 38 2. 50 2. 78 2. 45 after H-correction 0. 71 0. 83 1. 06 0. 72 after T-correction 0. 78 0. 33 0. 39 0. 70 before correction 2. 97 3. 10 3. 20 2. 91 after H-correction 1. 16 1. 12 1. 05 1. 21 after T-correction 0. 30 0. 28 0. 35 before correction 3. 71 3. 65 3. 67 after H-correction 1. 18 1. 13 1. 07 1. 04 after T-correction 1. 62 1. 57 1. 50 before correction 3. 10 3. 31 2. 76 3. 03 1. 22 1. 41 0. 98 1. 10 RS/GIS Lab. , Dept. of Geophysics, after H-correction 2009/07/30 Kangwon National University C-band 실험 중 2008/11/03 에서의 온 도보정 결과와, X-band 실험 중 2009/02/06에서의 온도 보정의 결과를 제외한 나머지 결과는 모두 보정 후 RMS error는 감소 C-band 에서의 최고 보정 효과 - 습도보정: 3. 85 mm(04/22 at VV-pol) - 온도보정: 3. 24 mm(04/22 at VV-pol) X-band 에서의 최고 보정 효과 - 습도보정: 2. 63 mm(07/29 at HH-pol) - 온도보정: 2. 92 mm(02/09 at HV-pol) 2009/11/26, EJ

감사합니다. RS/GIS Lab. , Dept. of Geophysics, Kangwon National University 2009/11/26, EJ
- Slides: 26