
GATORADE MX Production Ana Chloe Shivani Izzet BACKGROUND
GATORADE MX Production Ana, Chloe, Shivani, Izzet
BACKGROUND
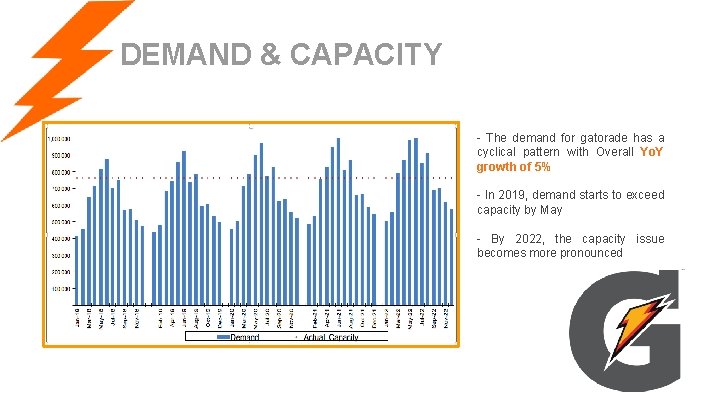
DEMAND & CAPACITY - The demand for gatorade has a cyclical pattern with Overall Yo. Y growth of 5% - In 2019, demand starts to exceed capacity by May - By 2022, the capacity issue becomes more pronounced
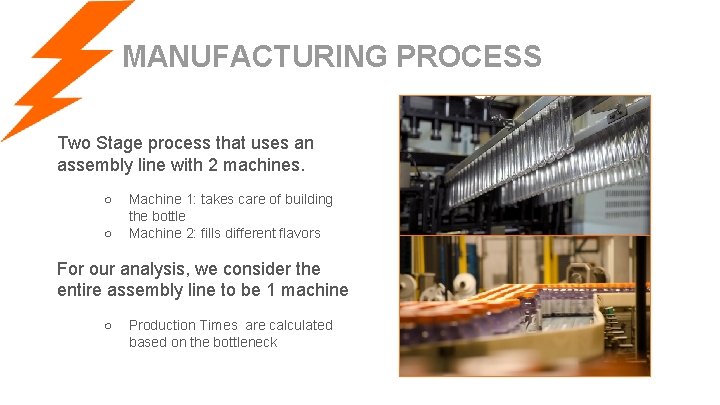
MANUFACTURING PROCESS Two Stage process that uses an assembly line with 2 machines. ○ ○ Machine 1: takes care of building the bottle Machine 2: fills different flavors For our analysis, we consider the entire assembly line to be 1 machine ○ Production Times are calculated based on the bottleneck
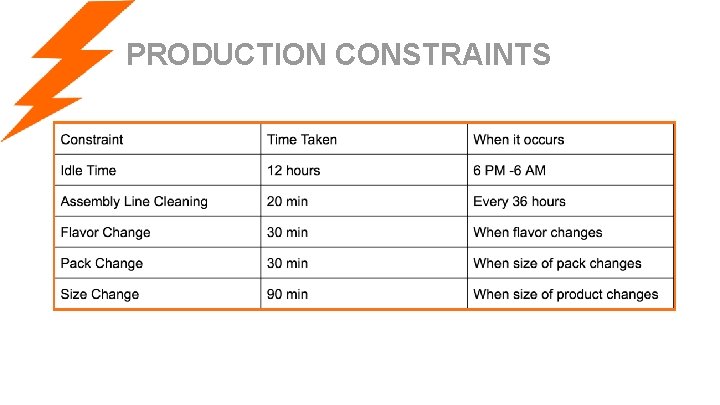
PRODUCTION CONSTRAINTS
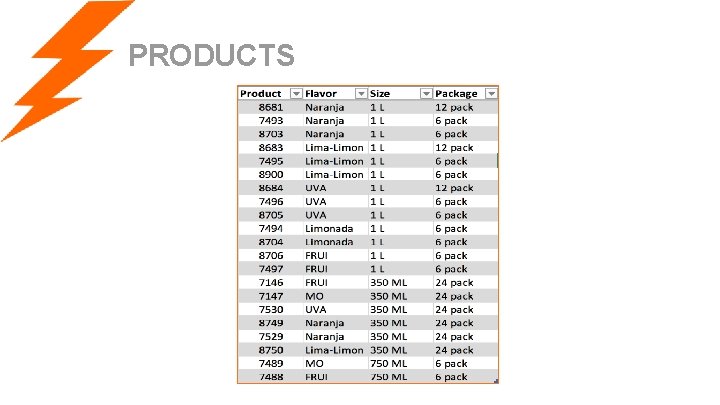
PRODUCTS
ANALYSIS
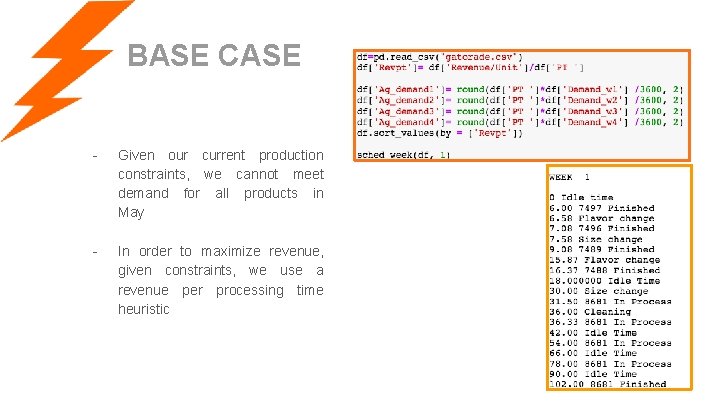
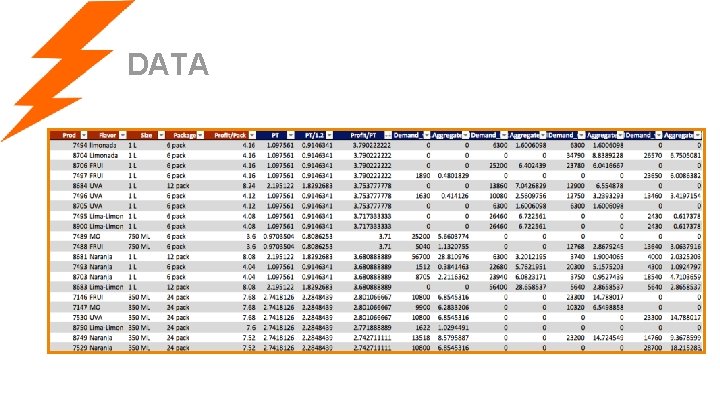
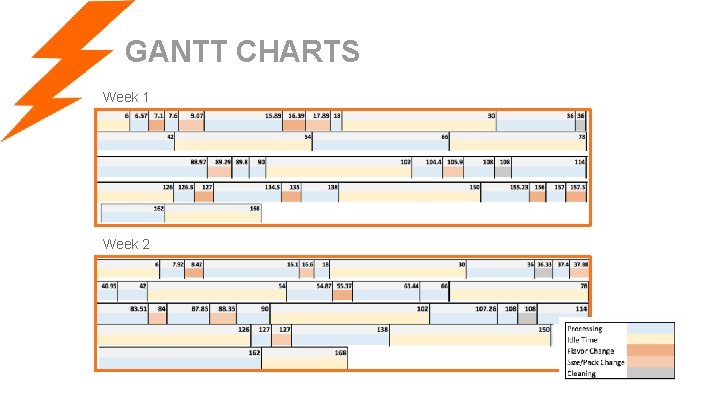
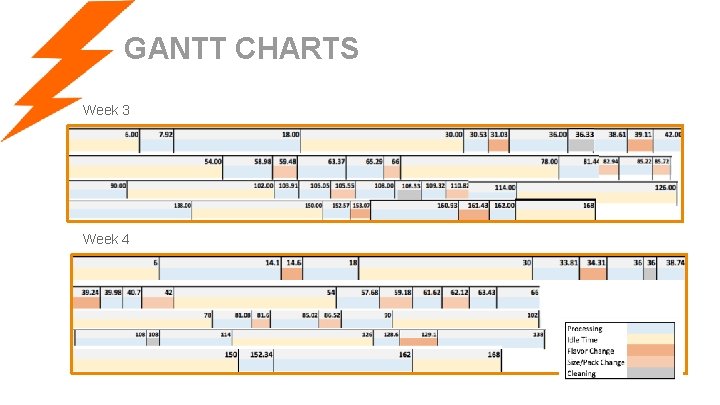
BASE CASE - Given our current production constraints, we cannot meet demand for all products in May - In order to maximize revenue, given constraints, we use a revenue per processing time heuristic
DATA
GANTT CHARTS Week 1 Week 2
GANTT CHARTS Week 3 Week 4
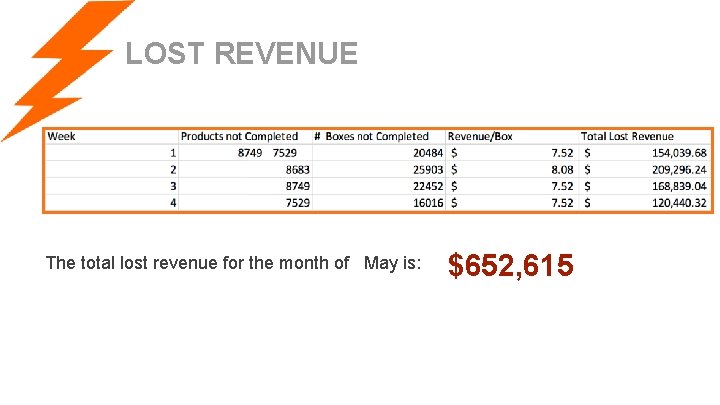
LOST REVENUE The total lost revenue for the month of May is: $652, 615
20% INCREASE IN VELOCITY - Assembly line consists of 2 machines where one machine is slower than the other - By upgrading this machine, the velocity of each job would be 20% higher and processing times would be 20% less - Cost of upgrade = $4 Million
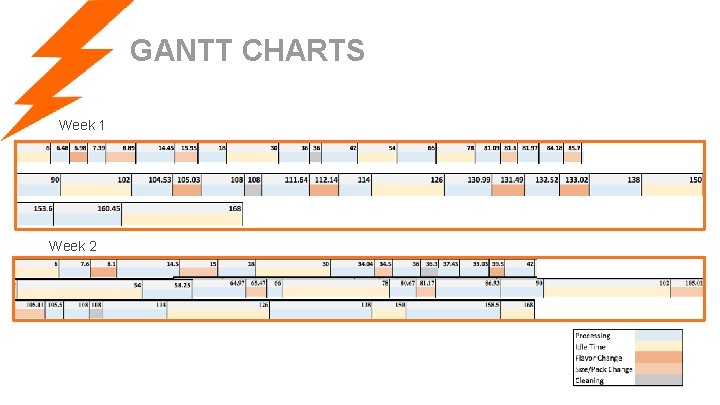
GANTT CHARTS Week 1 Week 2
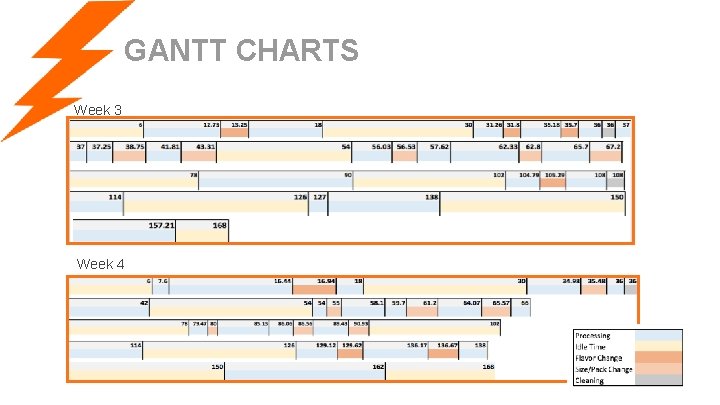
GANTT CHARTS Week 3 Week 4
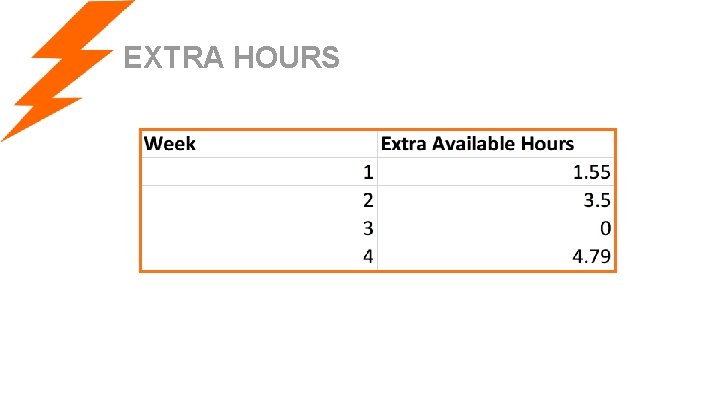
EXTRA HOURS
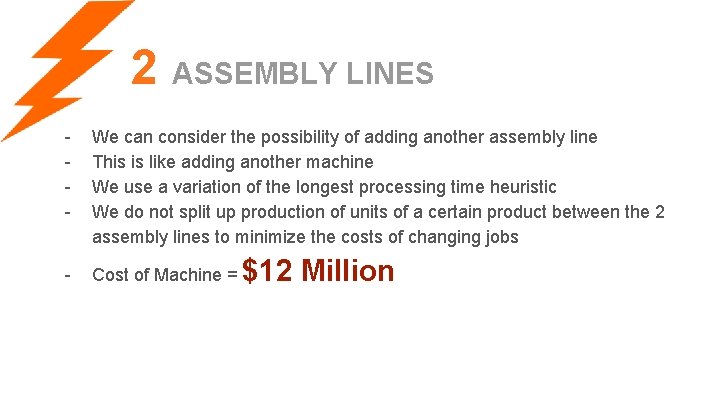
2 ASSEMBLY LINES - We can consider the possibility of adding another assembly line This is like adding another machine We use a variation of the longest processing time heuristic We do not split up production of units of a certain product between the 2 assembly lines to minimize the costs of changing jobs - Cost of Machine = $12 Million
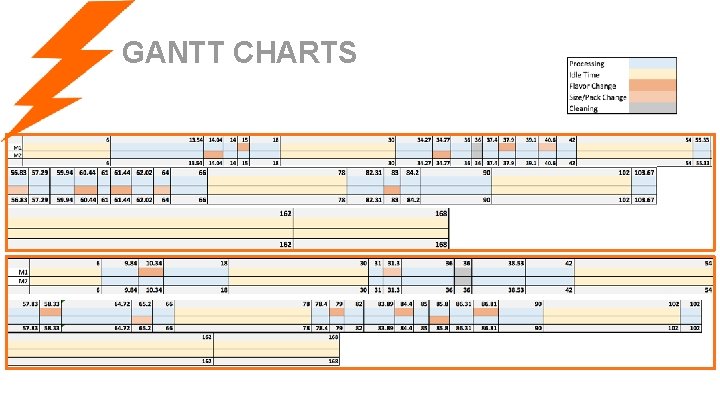
Week 1 GANTT CHARTS
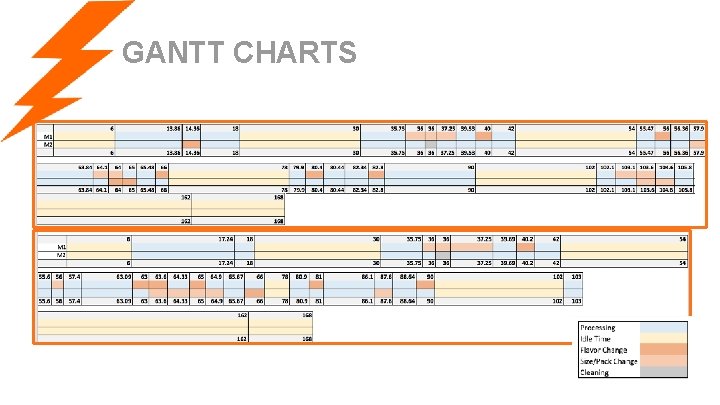
Week 3 GANTT CHARTS
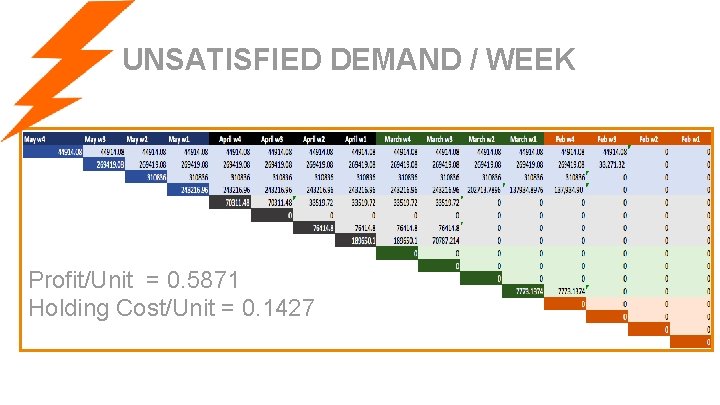
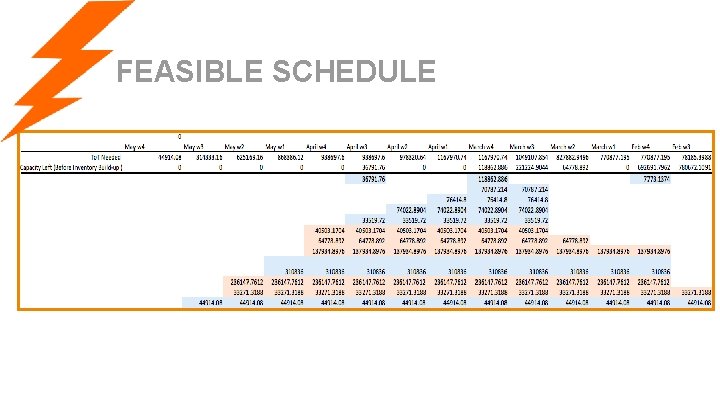
UNSATISFIED DEMAND / WEEK Profit/Unit = 0. 5871 Holding Cost/Unit = 0. 1427
FEASIBLE SCHEDULE
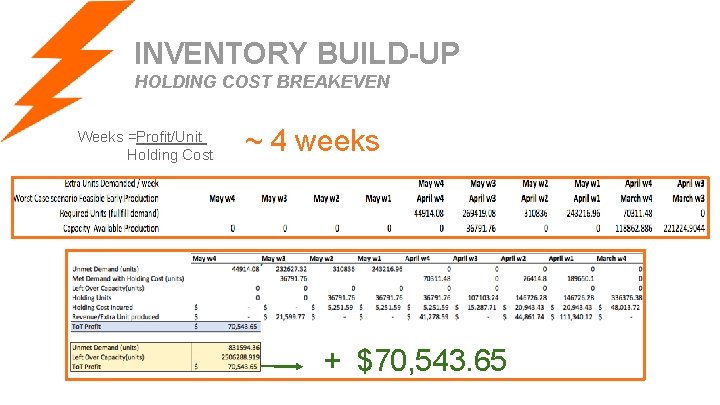
INVENTORY BUILD-UP HOLDING COST BREAKEVEN Weeks =Profit/Unit Holding Cost ~ 4 weeks + $70, 543. 65
FINANCIAL ANALYSIS
UPGRADE MACHINE (+%20 Vel) - Results in $636, 140 net revenue in month of May Assuming that there are 2 months per year where we have a capacity issue, we gain around $1, 272, 280/year At a cost of $4 million to upgrade the machine, we breakeven in ~3 years This is a conservative estimate as demand is growing and we anticipate more months to produce above current capacity by 2020
+ASSEMBLY LINE - With a second assembly line we fulfill all of May’s demand so we gain $652, 615 in revenue Assuming that there are 2 months per year where we have a capacity issue, we gain around 1, 300, 000 per year At a cost of $12 million to add an assembly line this would require 9. 2 + 1 year of installation to break even To bring down the break-even time, production from other factories could be completed on the new assembly line but this may have added costs
CONCLUSION - In the short term, Inventory build-up is the favorable strategy - In the long run, upgrading the machine makes sense as we gain more revenue per year - Demand is growing so the breakeven point will likely be less than 3 years
- Slides: 27