Gaseous sample Molecular Mass Molecular Hot filament Spectrometry


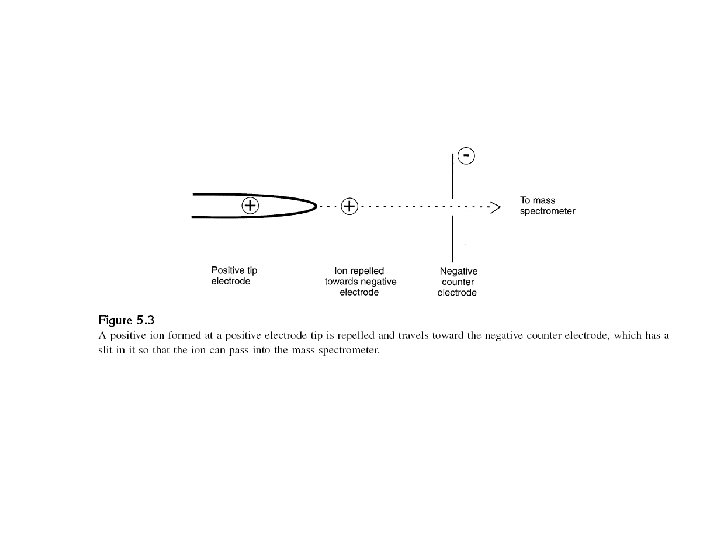
+ CH 3 (CH 2)8 CH 2 OH")


- Slides: 31
Gaseous sample Molecular Mass Molecular Hot filament Spectrometry electron Molecularsource. Mass Chapter 20 Magnet Molecular Mass Anode Slit A Slit B Spectrometry To pump Spectrometry Molecular Mass Path of lighter ions 10 -7 torr Exit slit Ion Spectrometry Collector Mass Spectrometry Metal analyzer Path of heavier tube ions Chapter Molecular Mass Spectrometry Schematic of a magnetic sector spectrometer 20
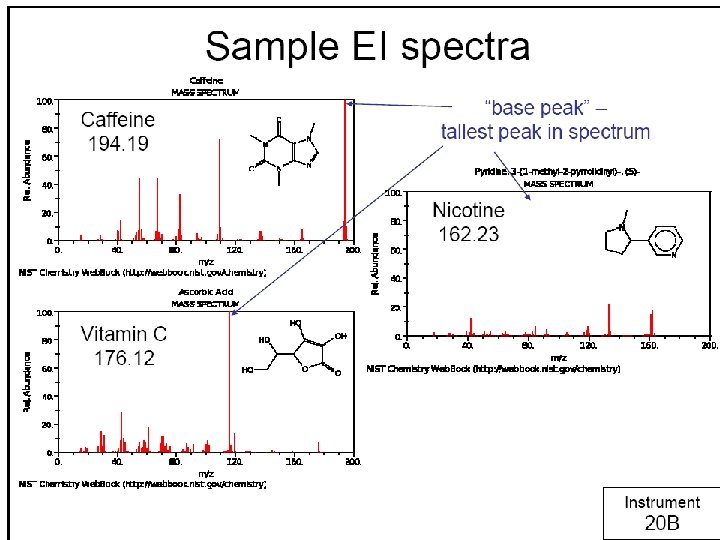
Relative abundance 100 Base Peak CH 2 CH 3 80 + CH 2 MW = 106 60 Molecular ion peak 40 + CH 2 CH 3 20 10 20 30 40 50 60 70 m/z Mass spectrum of ethylbenzene 80 90 100 110
Relative abundance 100 41 Base peak C 3 H 5 + CH 3 (CH 2)8 CH 2 OH 80 55 60 70 40 83 20 98 40 60 80 100 M+ 158 112 C 8 H 16+ 120 140 m/z Mass spectrum of decanol from a hard source 160
141 Relative abundance 100 (M - OH)+ CH 3 (CH 2)8 CH 2 OH 80 Base peak CH 3 (CH 2)8 CH 2+ 60 40 20 60 70 84 80 98 (M - 1)+ 157 112 100 120 140 m/z Mass spectrum of decanol from a soft source 160
Heater Shield Filament Electron beam Repeller 1 st accelerating slit 2 nd accelerating slit Focusing slit Molecular leak Anode To mass analyzer
Some Typical reactions in an electron impact source Molecular ion formation ABCD + e- Fragmentation ABCD*+ + 2 e. A+ + BCD* A* + BCD+ BC + D+ B + A+ CD* + AB+ A + B+ D + C+ AB* + CD+ Rearrangement followed by fragmentation ABCD*+ ADBC*+ C + D+ BC* + AD* + BC+ Collision followed by fragmentation ABCD*+ + ABCD*2+ BCD* + ABCDA+
Chemical ionization • • • CH 4+ + CH 4 CH 3+ + CH 4 CH 5+ + MH C 2 H 5+ + MH CH 5+ + CH 3 C 2 H 5 + + H 2 MH 2+ + CH 4 MH 2+ + C 2 H 4 M + + C 2 H 5 Proton transfer Hydride transfer
84 80 60 40 H 2 O+ 100 Relative abundance 100 EI C 2 H 4+ C 3 H 6+ 20 (M-H 2 O)+ C 4 H 8+ 40 (M-H 2 O+H)+ 120 80 m/z 80 60 130 FI 84 40 20 40 160 (M+H)+ 148 COOH 45 80 m/z HOOC CH CH 2 COOH NH 2 Relative abundance 100 148 (M+H)+ 80 60 FD 40 20 40 80 120 160
10 -5 to 10 -8 torr Ion Source Mass analyzer Ion transducer Sample Vacuum pump Signal processor
Vacuum pump Heating coil Direct insertion probe Ionization chamber A sample probe for inserting a sample directly into an ion source
Gaseous sample Hot filament electron source Anode Slit A Slit B To pump Path of lighter ions Magnet 10 -7 torr Exit slit Ion Collector Path of heavier ions Metal analyzer tube Schematic of a magnetic sector spectrometer
Magnetic Sector analyzers • KE = z e. V = ½ mv 2 – V potential difference between A and B – ze is the charge of the ion – v velocity of the ion after acceleration • FM= Bzev – FM magnetic force – B magnetic field strength • • Fc = mv 2/r Fc balancing centripetal force Bzev = mv 2/r m/z = B 2 r 2 e/2 V
Magnetic analyzer Electrostatic analyzer Exit slit Point of double focus Ion collector Source exit slit Ion source Nier-Johnson design of double focusing spectrometer
Electron control grid Filament Ion energy grid Ion cathode Dynode strip Sample Ionization region Anode vacuum Electron multiplication region Acceleration region Schematic of a time-of –flight mass spectrometer
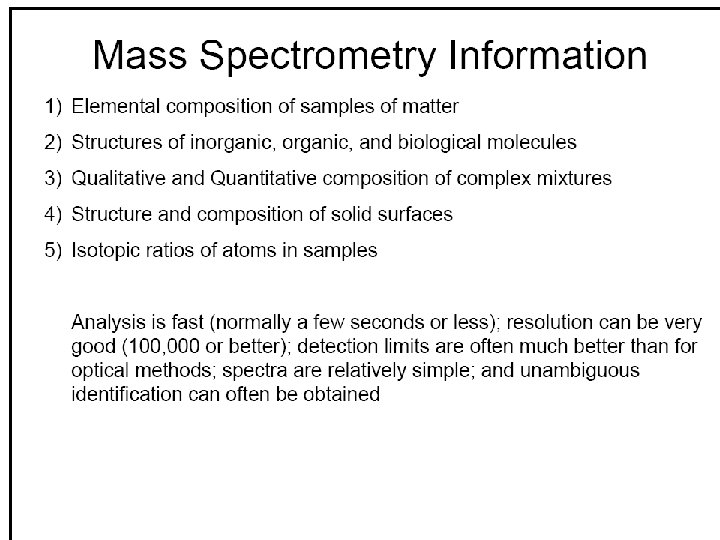
Applications of Molecular Mass Spectrometry • • • Elucidation of structure of organic and biological molecules Determination of molecular weight of peptides and oligonuclutides Identification of components of thin layer and paper chromatography Determination of sequences of amino acids in of polypeptides and proteins Detection and identification of species separated by chromatography and capillary electrophoresis Identification of drugs of abuse and metabolites of drugs of abuse in blood, urine, and salvia Monitoring of gases in patient’s breath during surgery Testing for the presence of drugs in blood of thoroughbred racing horses and Olympic athletes Dating of archeological specimens Analyses of aerosol particles Determination of pesticide residues in food Monitoring of volatile organic species in water supplies