
GANESHA ECOSPHERE LTD Waste to Wealth WHO are

- Slides: 13
GANESHA ECOSPHERE LTD
Waste to Wealth - WHO are we - WHAT do we do - HOW do we do it - WHY do we do it
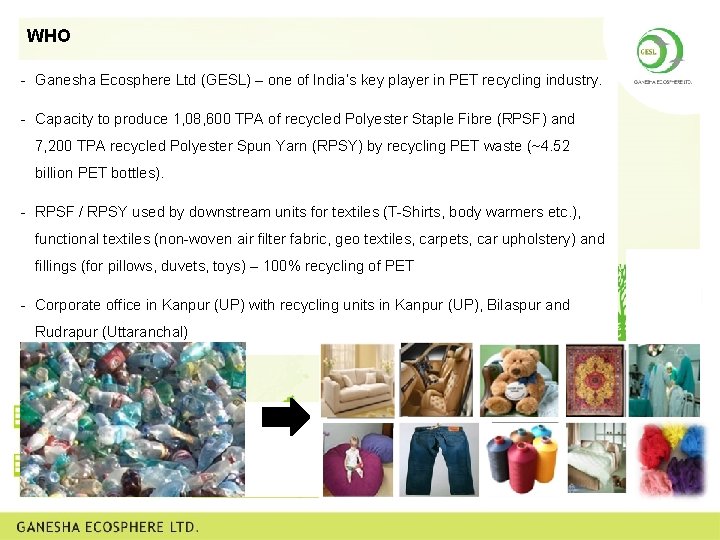
WHO - Ganesha Ecosphere Ltd (GESL) – one of India’s key player in PET recycling industry. - Capacity to produce 1, 08, 600 TPA of recycled Polyester Staple Fibre (RPSF) and 7, 200 TPA recycled Polyester Spun Yarn (RPSY) by recycling PET waste (~4. 52 billion PET bottles). - RPSF / RPSY used by downstream units for textiles (T-Shirts, body warmers etc. ), functional textiles (non-woven air filter fabric, geo textiles, carpets, car upholstery) and fillings (for pillows, duvets, toys) – 100% recycling of PET - Corporate office in Kanpur (UP) with recycling units in Kanpur (UP), Bilaspur and Rudrapur (Uttaranchal)
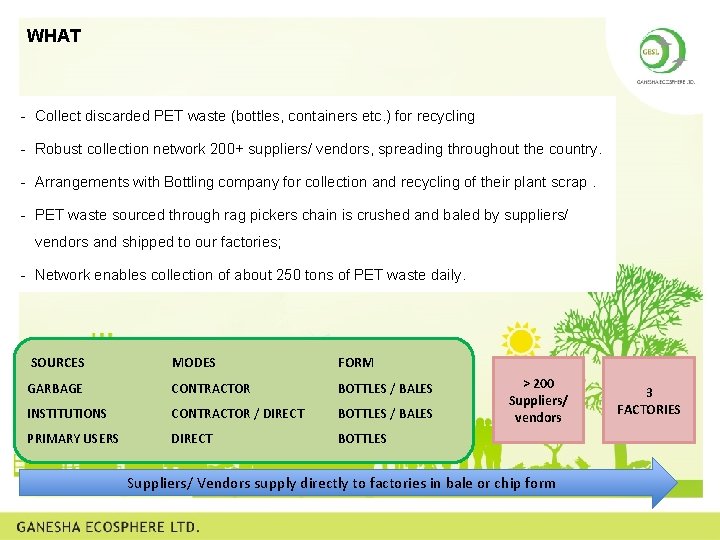
WHAT - Collect discarded PET waste (bottles, containers etc. ) for recycling - Robust collection network 200+ suppliers/ vendors, spreading throughout the country. - Arrangements with Bottling company for collection and recycling of their plant scrap. - PET waste sourced through rag pickers chain is crushed and baled by suppliers/ vendors and shipped to our factories; - Network enables collection of about 250 tons of PET waste daily. SOURCES MODES FORM GARBAGE CONTRACTOR BOTTLES / BALES INSTITUTIONS CONTRACTOR / DIRECT BOTTLES / BALES PRIMARY USERS DIRECT BOTTLES > 200 Suppliers/ vendors Suppliers/ Vendors supply directly to factories in bale or chip form 3 FACTORIES
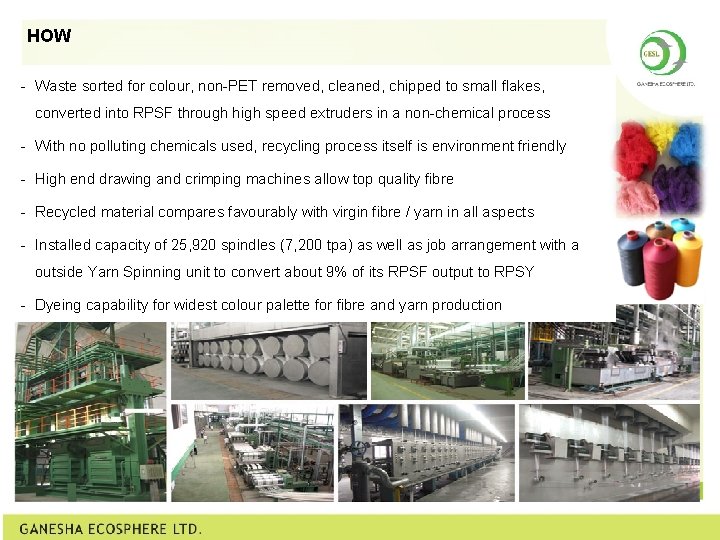
HOW - Waste sorted for colour, non-PET removed, cleaned, chipped to small flakes, converted into RPSF through high speed extruders in a non-chemical process - With no polluting chemicals used, recycling process itself is environment friendly - High end drawing and crimping machines allow top quality fibre - Recycled material compares favourably with virgin fibre / yarn in all aspects - Installed capacity of 25, 920 spindles (7, 200 tpa) as well as job arrangement with a outside Yarn Spinning unit to convert about 9% of its RPSF output to RPSY - Dyeing capability for widest colour palette for fibre and yarn production
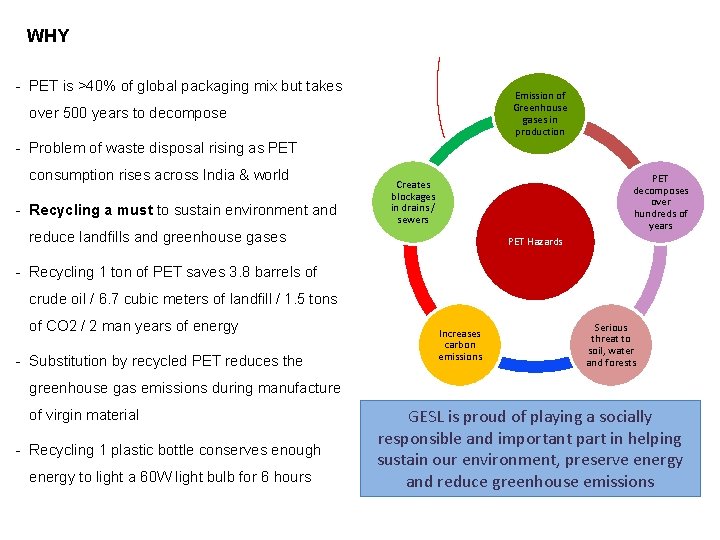
WHY - PET is >40% of global packaging mix but takes Emission of Greenhouse gases in production over 500 years to decompose - Problem of waste disposal rising as PET consumption rises across India & world - Recycling a must to sustain environment and PET decomposes over hundreds of years Creates blockages in drains / sewers reduce landfills and greenhouse gases PET Hazards - Recycling 1 ton of PET saves 3. 8 barrels of crude oil / 6. 7 cubic meters of landfill / 1. 5 tons of CO 2 / 2 man years of energy - Substitution by recycled PET reduces the Increases carbon emissions Serious threat to soil, water and forests greenhouse gas emissions during manufacture of virgin material - Recycling 1 plastic bottle conserves enough energy to light a 60 W light bulb for 6 hours GESL is proud of playing a socially responsible and important part in helping sustain our environment, preserve energy and reduce greenhouse emissions
FINANCIALS
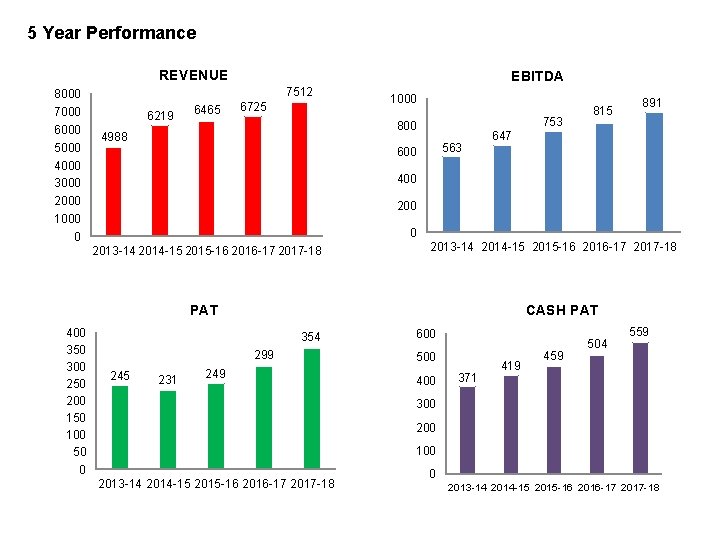
5 Year Performance REVENUE 8000 7000 6000 5000 4000 3000 2000 1000 0 EBITDA 7512 6219 6465 6725 1000 753 800 4988 563 600 891 647 400 200 0 2013 -14 2014 -15 2015 -16 2016 -17 2017 -18 PAT 400 350 300 250 200 150 100 50 0 815 CASH PAT 354 299 245 231 249 600 500 400 371 419 459 504 559 300 200 100 2013 -14 2014 -15 2015 -16 2016 -17 2017 -18
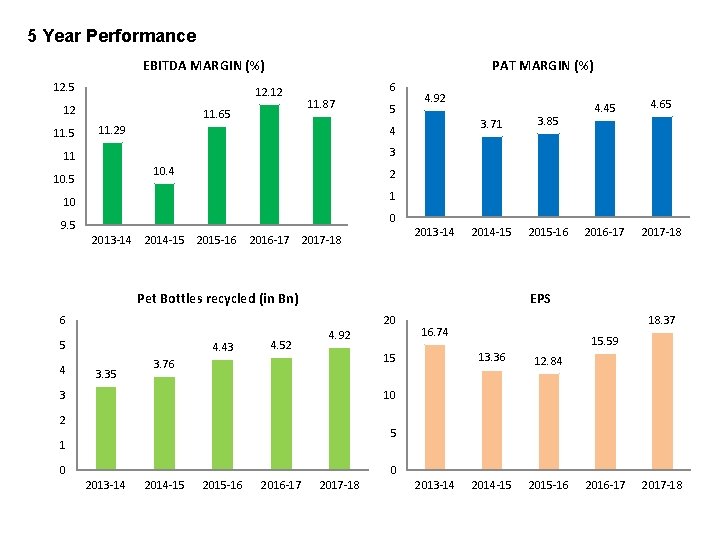
5 Year Performance EBITDA MARGIN (%) 12. 5 12. 12 12 11. 5 PAT MARGIN (%) 11. 65 6 11. 87 11. 29 5 4. 92 4 3. 71 3. 85 2014 -15 2015 -16 4. 65 2016 -17 2017 -18 3 11 10. 4 10. 5 2 1 10 0 9. 5 2013 -14 2014 -15 2015 -16 2016 -17 2013 -14 2017 -18 Pet Bottles recycled (in Bn) 6 5 4 4. 45 4. 43 3. 35 4. 52 EPS 4. 92 20 16. 74 15 3. 76 3 18. 37 15. 59 13. 36 12. 84 2014 -15 2015 -16 10 2 5 1 0 0 2013 -14 2014 -15 2015 -16 2016 -17 2017 -18 2013 -14 2016 -17 2017 -18
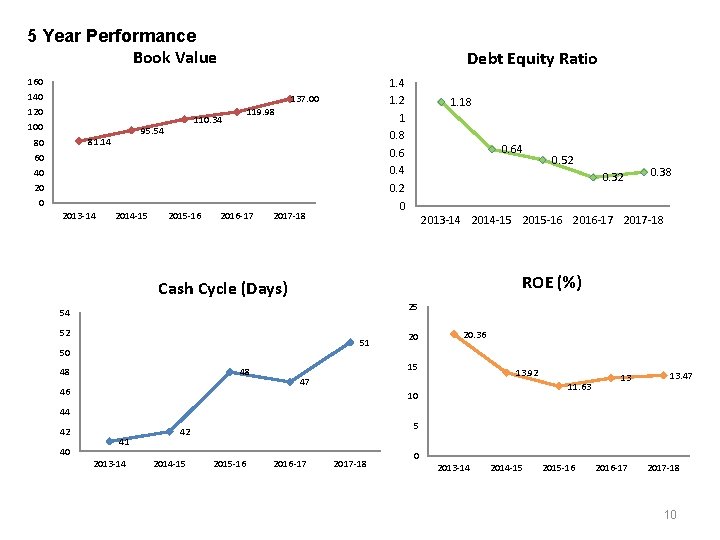
5 Year Performance Book Value Debt Equity Ratio 1. 4 1. 2 1 0. 8 0. 6 0. 4 0. 2 0 160 140 137. 00 120 100 110. 34 95. 54 81. 14 80 119. 98 60 40 2013 -14 2014 -15 2015 -16 2016 -17 2017 -18 1. 18 0. 64 0. 52 0. 38 2013 -14 2014 -15 2015 -16 2016 -17 2017 -18 ROE (%) Cash Cycle (Days) 25 54 52 51 50 48 48 46 20 20. 36 15 13. 92 47 11. 63 10 13 13. 47 44 42 40 41 2013 -14 5 42 2014 -15 2015 -16 2016 -17 2017 -18 0 2013 -14 2014 -15 2015 -16 2016 -17 2017 -18 10
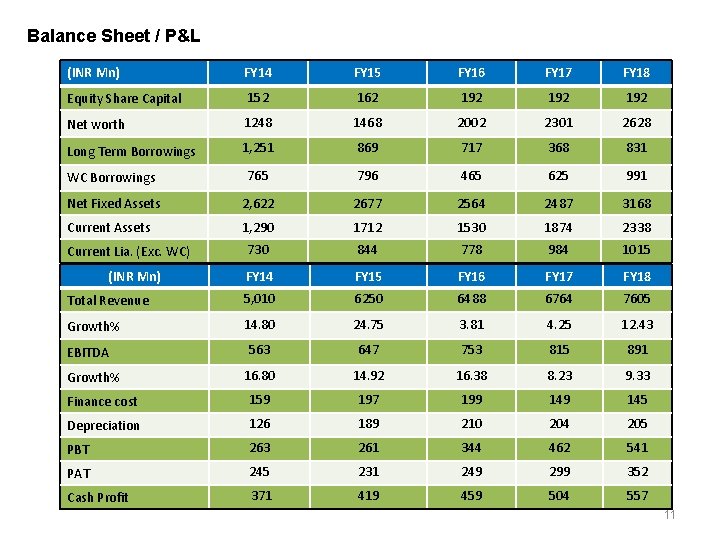
Balance Sheet / P&L (INR Mn) FY 14 FY 15 FY 16 FY 17 FY 18 Equity Share Capital 152 162 192 192 Net worth 1248 1468 2002 2301 2628 Long Term Borrowings 1, 251 869 717 368 831 WC Borrowings 765 796 465 625 991 Net Fixed Assets 2, 622 2677 2564 2487 3168 Current Assets 1, 290 1712 1530 1874 2338 730 844 778 984 1015 FY 14 FY 15 FY 16 FY 17 FY 18 Total Revenue 5, 010 6250 6488 6764 7605 Growth% 14. 80 24. 75 3. 81 4. 25 12. 43 563 647 753 815 891 16. 80 14. 92 16. 38 8. 23 9. 33 Finance cost 159 197 199 145 Depreciation 126 189 210 204 205 PBT 263 261 344 462 541 PAT 245 231 249 299 352 Cash Profit 371 419 459 504 557 Current Lia. (Exc. WC) (INR Mn) EBITDA Growth% 11
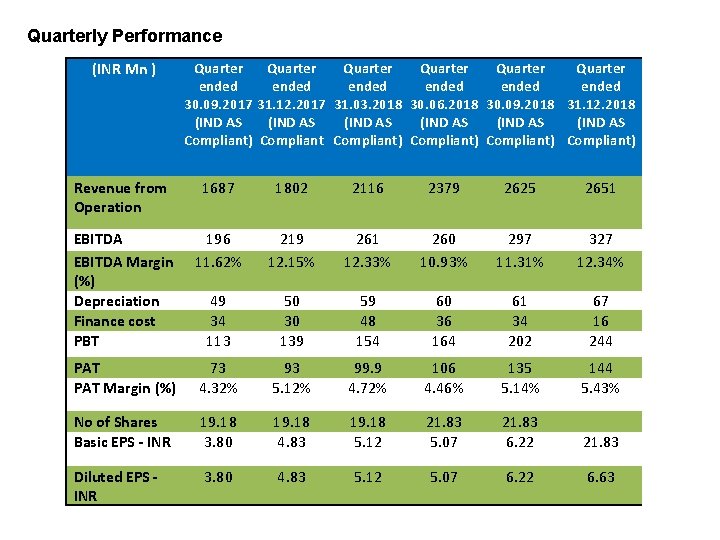
Quarterly Performance (INR Mn ) Quarter Quarter ended ended 30. 09. 2017 31. 12. 2017 31. 03. 2018 30. 06. 2018 30. 09. 2018 31. 12. 2018 (IND AS (IND AS Compliant) Compliant) Revenue from Operation 1687 1802 2116 2379 2625 2651 EBITDA Margin (%) Depreciation Finance cost PBT 196 11. 62% 219 12. 15% 261 12. 33% 260 10. 93% 297 11. 31% 327 12. 34% 49 34 113 50 30 139 59 48 154 60 36 164 61 34 202 67 16 244 PAT Margin (%) 73 4. 32% 93 5. 12% 99. 9 4. 72% 106 4. 46% 135 5. 14% 144 5. 43% No of Shares Basic EPS - INR 19. 18 3. 80 19. 18 4. 83 19. 18 5. 12 21. 83 5. 07 21. 83 6. 22 21. 83 Diluted EPS INR 3. 80 4. 83 5. 12 5. 07 6. 22 6. 63
THANK YOU