
GA EPD Permit SIP Modeling Update James W


- Slides: 57
GA EPD Permit & SIP Modeling Update James W. Boylan Georgia EPD – Air Protection Branch Manager, Data and Modeling Unit AWMA Regulatory Update Conference May 1, 2014 – Atlanta, GA
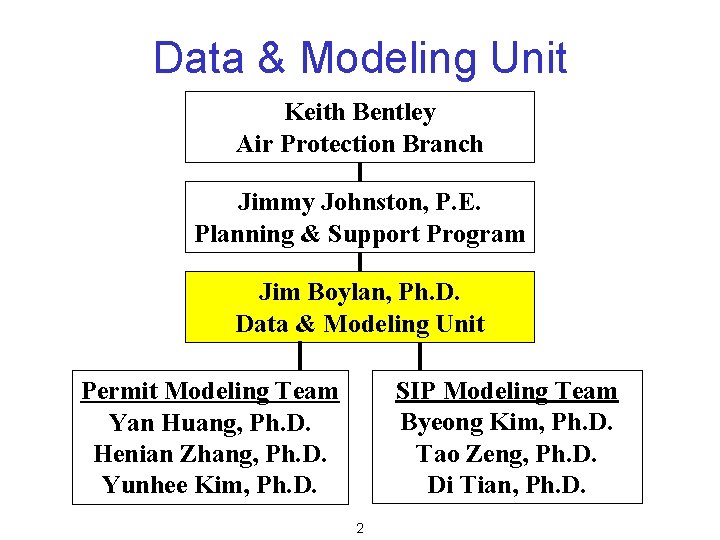
Data & Modeling Unit Keith Bentley Air Protection Branch Jimmy Johnston, P. E. Planning & Support Program Jim Boylan, Ph. D. Data & Modeling Unit SIP Modeling Team Byeong Kim, Ph. D. Tao Zeng, Ph. D. Di Tian, Ph. D. Permit Modeling Team Yan Huang, Ph. D. Henian Zhang, Ph. D. Yunhee Kim, Ph. D. 2
Permit Modeling Update
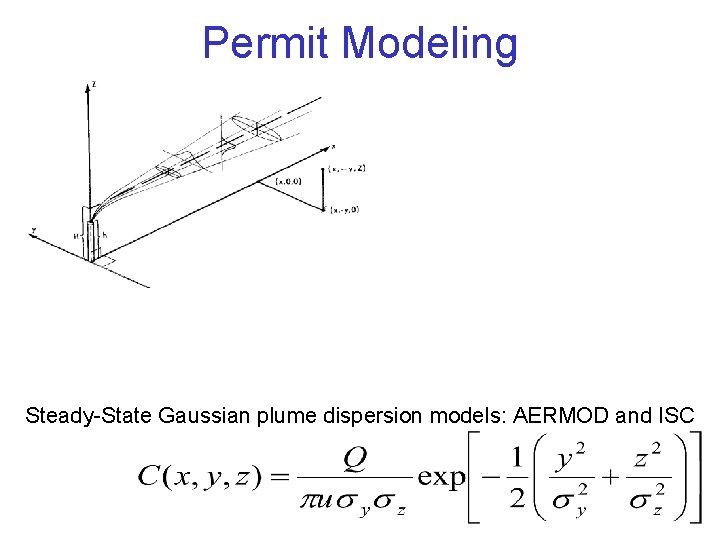
Permit Modeling Steady-State Gaussian plume dispersion models: AERMOD and ISC
Permit Modeling Guidance • Georgia EPD PSD Permit Application Guidance Document (09/18/12) – http: //www. georgiaair. org/airpermit/html/sspp/psd_ guidance_document. htm • Guideline for Ambient Impact Assessment of Toxic Air Pollutant Emissions, 1998 – http: //www. georgiaair. org/airpermit/downloads/oth erforms/infodocs/toxguide. pdf • Guideline for Modeling PM 10 Ambient Concentration in Areas Impacted by Quarry Operation Producing Crushed Stone - August 7, 2012 – http: //www. georgiaair. org/airpermit/downloads/ssp p/modeling/quarryguideline_august 2012. pdf 6
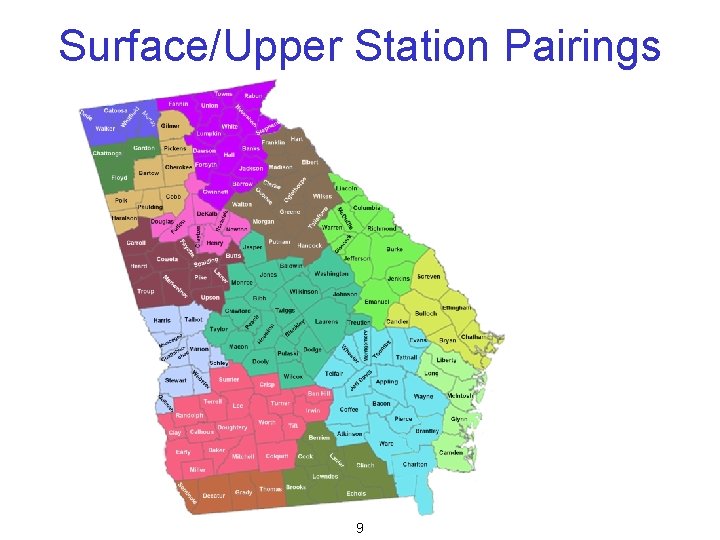
Meteorological Data • GA EPD has develop 5 -years of AERMET meteorological data for each ASOS surface and upper air pairing – Pairing based on distance, climatological zone, and data completeness criteria – 2007 -2011 data, except KAMG/KJAX is 2006 -2010 – Last updated on April 4, 2013 • All data sets are available on-line – http: //www. georgiaair. org/airpermit/html/sspp/mode ling/aermetdata. htm 7
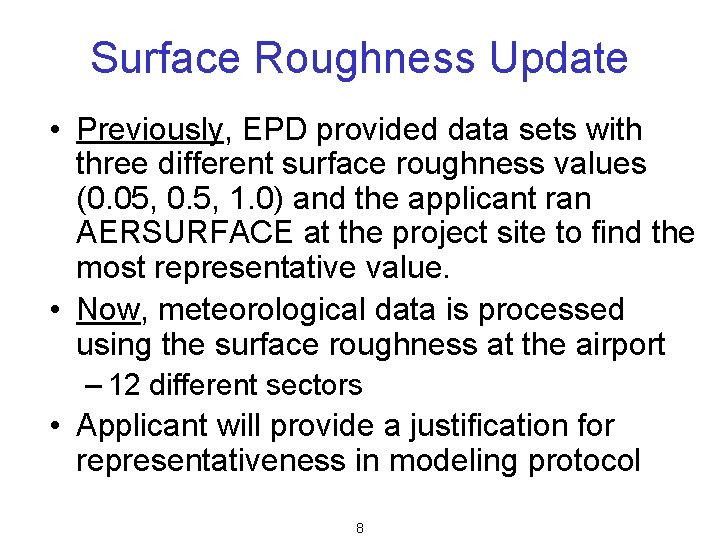
Surface Roughness Update • Previously, EPD provided data sets with three different surface roughness values (0. 05, 0. 5, 1. 0) and the applicant ran AERSURFACE at the project site to find the most representative value. • Now, meteorological data is processed using the surface roughness at the airport – 12 different sectors • Applicant will provide a justification for representativeness in modeling protocol 8
Surface/Upper Station Pairings 9
Background Concentrations • GA EPD has develop background concentrations for each county based on the 2010 -2012 design values – PM 10, PM 2. 5, SO 2, NO 2, CO, Pb • Will update to 2011 -2013 design values by the end of May • All data sets are available on-line – http: //www. georgiaair. org/airpermit/html/sspp/mo deling. htm 10
Off-Site Emissions Inventory • GA EPD will create a statewide emission inventory for the PSD air impact analysis – – NAAQS & Increment PM 10, PM 2. 5, NOx, SO 2, and CO Follow 40 CFR 51 Appendix W Contractor support from AMEC • GA EPD will maintain future updates to the emission inventory through the permit application process. • All emissions will be available on-line 11
Secondary Impacts • In 2012, EPA granted the Sierra Club’s Petition to engage in rule making to evaluate updates to Appendix W and, as appropriate, incorporate new analytical techniques or models for ozone and secondary PM 2. 5. – AERMOD does not have the ability to model ozone and secondary PM 2. 5 impacts • EPA’s Timeline – 11 th Conference on Air Quality Modeling (2014) 12
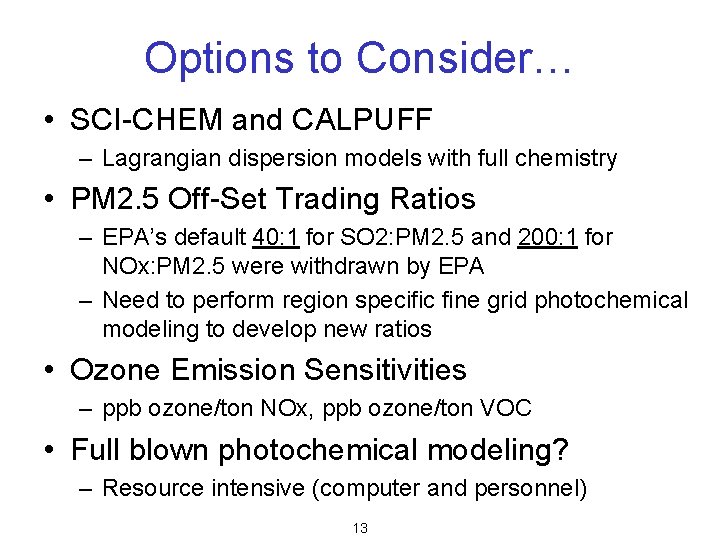
Options to Consider… • SCI-CHEM and CALPUFF – Lagrangian dispersion models with full chemistry • PM 2. 5 Off-Set Trading Ratios – EPA’s default 40: 1 for SO 2: PM 2. 5 and 200: 1 for NOx: PM 2. 5 were withdrawn by EPA – Need to perform region specific fine grid photochemical modeling to develop new ratios • Ozone Emission Sensitivities – ppb ozone/ton NOx, ppb ozone/ton VOC • Full blown photochemical modeling? – Resource intensive (computer and personnel) 13
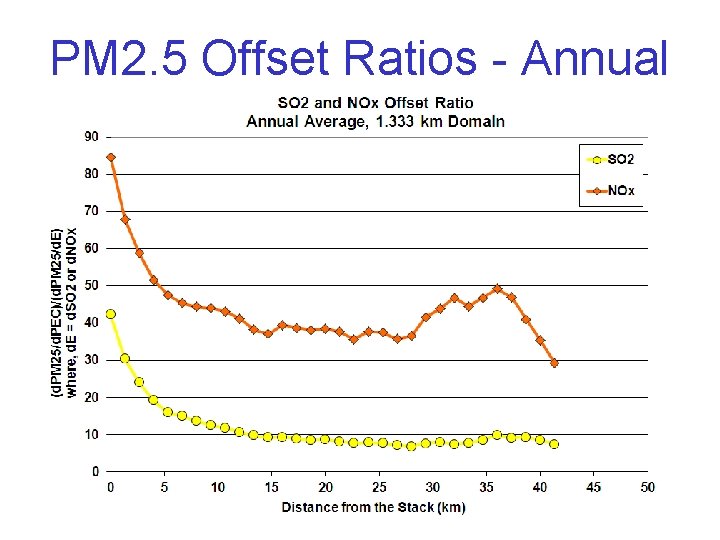
PM 2. 5 Offset Ratios - Annual
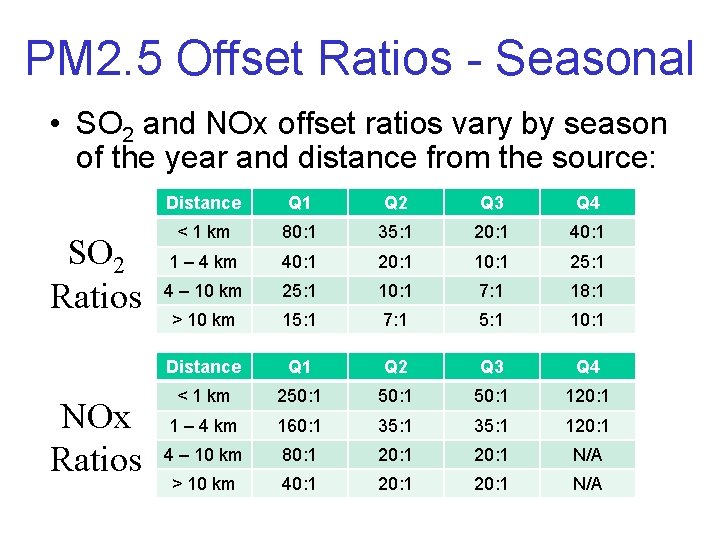
PM 2. 5 Offset Ratios - Seasonal • SO 2 and NOx offset ratios vary by season of the year and distance from the source: SO 2 Ratios NOx Ratios Distance Q 1 Q 2 Q 3 Q 4 < 1 km 80: 1 35: 1 20: 1 40: 1 1 – 4 km 40: 1 20: 1 10: 1 25: 1 4 – 10 km 25: 1 10: 1 7: 1 18: 1 > 10 km 15: 1 7: 1 5: 1 10: 1 Distance Q 1 Q 2 Q 3 Q 4 < 1 km 250: 1 120: 1 1 – 4 km 160: 1 35: 1 120: 1 4 – 10 km 80: 1 20: 1 N/A > 10 km 40: 1 20: 1 N/A
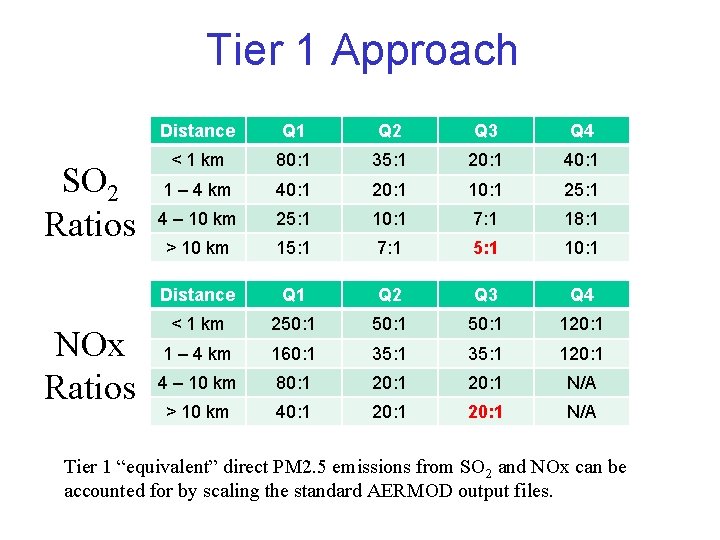
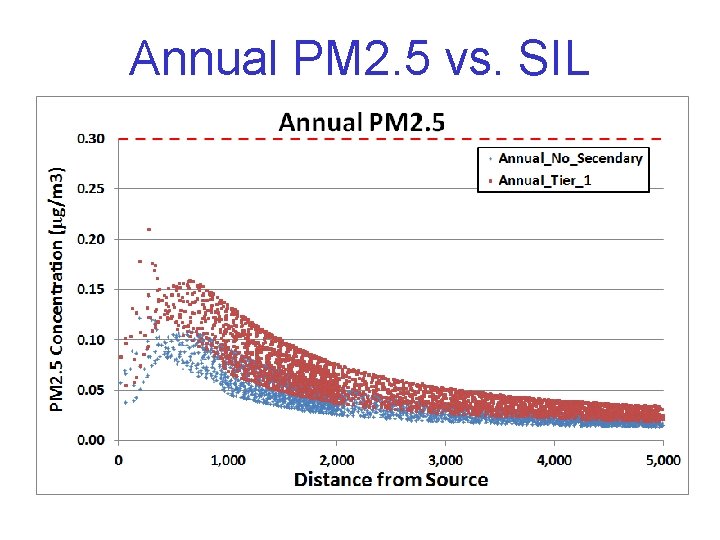
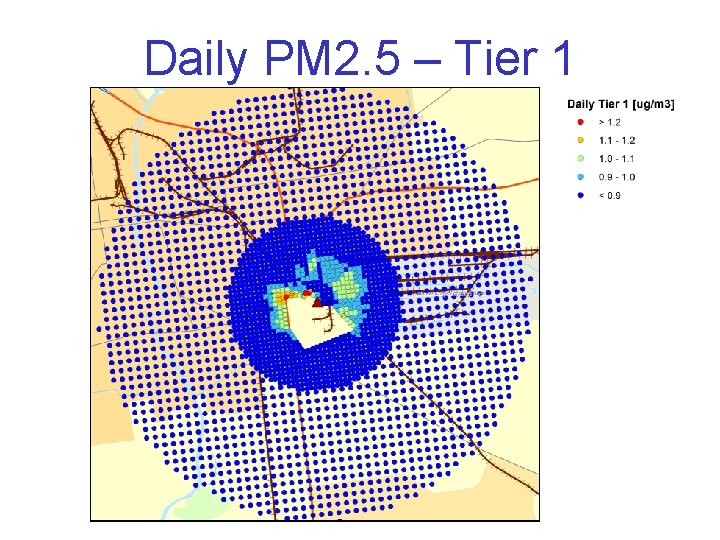
Tier 1 Approach SO 2 Ratios NOx Ratios Distance Q 1 Q 2 Q 3 Q 4 < 1 km 80: 1 35: 1 20: 1 40: 1 1 – 4 km 40: 1 20: 1 10: 1 25: 1 4 – 10 km 25: 1 10: 1 7: 1 18: 1 > 10 km 15: 1 7: 1 5: 1 10: 1 Distance Q 1 Q 2 Q 3 Q 4 < 1 km 250: 1 120: 1 1 – 4 km 160: 1 35: 1 120: 1 4 – 10 km 80: 1 20: 1 N/A > 10 km 40: 1 20: 1 N/A Tier 1 “equivalent” direct PM 2. 5 emissions from SO 2 and NOx can be accounted for by scaling the standard AERMOD output files.
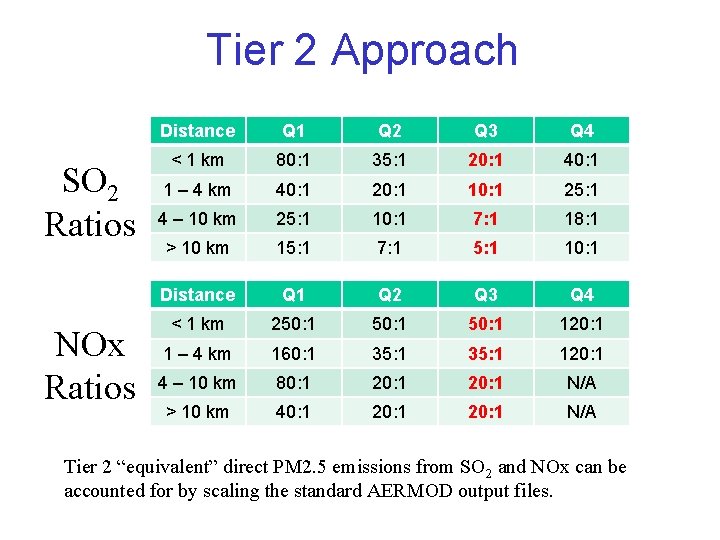
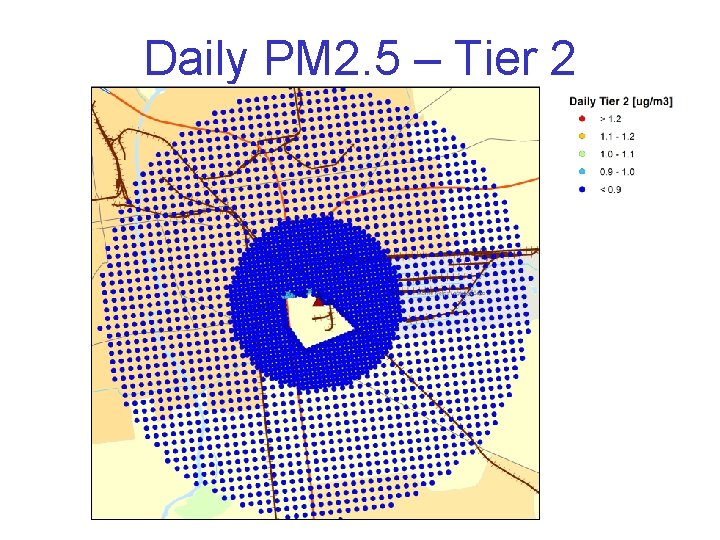
Tier 2 Approach SO 2 Ratios NOx Ratios Distance Q 1 Q 2 Q 3 Q 4 < 1 km 80: 1 35: 1 20: 1 40: 1 1 – 4 km 40: 1 20: 1 10: 1 25: 1 4 – 10 km 25: 1 10: 1 7: 1 18: 1 > 10 km 15: 1 7: 1 5: 1 10: 1 Distance Q 1 Q 2 Q 3 Q 4 < 1 km 250: 1 120: 1 1 – 4 km 160: 1 35: 1 120: 1 4 – 10 km 80: 1 20: 1 N/A > 10 km 40: 1 20: 1 N/A Tier 2 “equivalent” direct PM 2. 5 emissions from SO 2 and NOx can be accounted for by scaling the standard AERMOD output files.
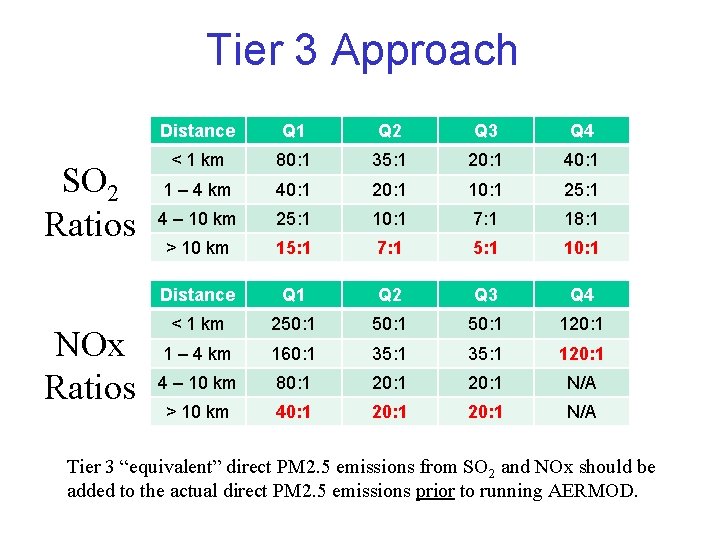
Tier 3 Approach SO 2 Ratios NOx Ratios Distance Q 1 Q 2 Q 3 Q 4 < 1 km 80: 1 35: 1 20: 1 40: 1 1 – 4 km 40: 1 20: 1 10: 1 25: 1 4 – 10 km 25: 1 10: 1 7: 1 18: 1 > 10 km 15: 1 7: 1 5: 1 10: 1 Distance Q 1 Q 2 Q 3 Q 4 < 1 km 250: 1 120: 1 1 – 4 km 160: 1 35: 1 120: 1 4 – 10 km 80: 1 20: 1 N/A > 10 km 40: 1 20: 1 N/A Tier 3 “equivalent” direct PM 2. 5 emissions from SO 2 and NOx should be added to the actual direct PM 2. 5 emissions prior to running AERMOD.
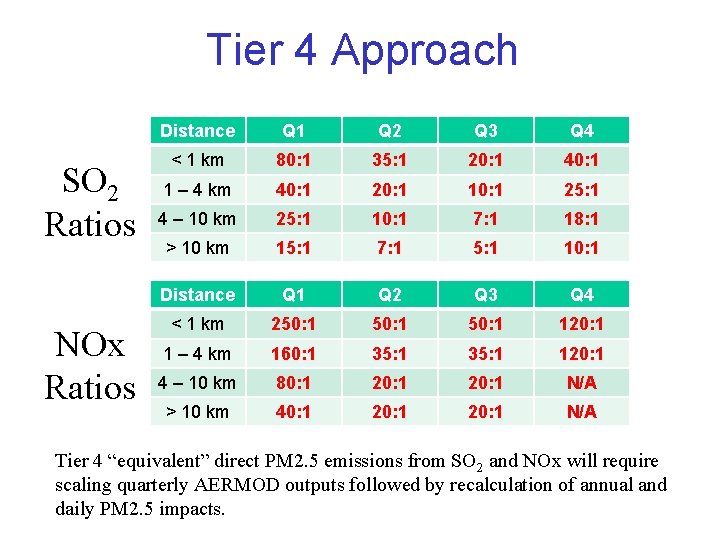
Tier 4 Approach SO 2 Ratios NOx Ratios Distance Q 1 Q 2 Q 3 Q 4 < 1 km 80: 1 35: 1 20: 1 40: 1 1 – 4 km 40: 1 20: 1 10: 1 25: 1 4 – 10 km 25: 1 10: 1 7: 1 18: 1 > 10 km 15: 1 7: 1 5: 1 10: 1 Distance Q 1 Q 2 Q 3 Q 4 < 1 km 250: 1 120: 1 1 – 4 km 160: 1 35: 1 120: 1 4 – 10 km 80: 1 20: 1 N/A > 10 km 40: 1 20: 1 N/A Tier 4 “equivalent” direct PM 2. 5 emissions from SO 2 and NOx will require scaling quarterly AERMOD outputs followed by recalculation of annual and daily PM 2. 5 impacts.
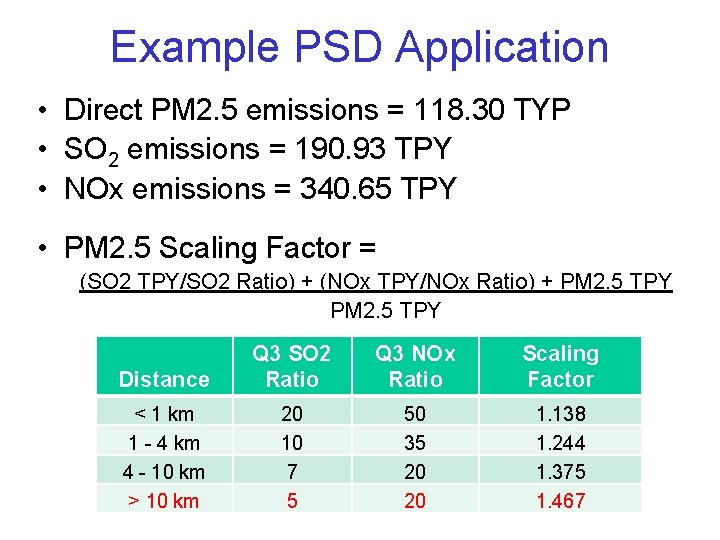
Example PSD Application • Direct PM 2. 5 emissions = 118. 30 TYP • SO 2 emissions = 190. 93 TPY • NOx emissions = 340. 65 TPY • PM 2. 5 Scaling Factor = (SO 2 TPY/SO 2 Ratio) + (NOx TPY/NOx Ratio) + PM 2. 5 TPY Distance Q 3 SO 2 Ratio Q 3 NOx Ratio Scaling Factor < 1 km 1 - 4 km 4 - 10 km > 10 km 20 10 7 5 50 35 20 20 1. 138 1. 244 1. 375 1. 467
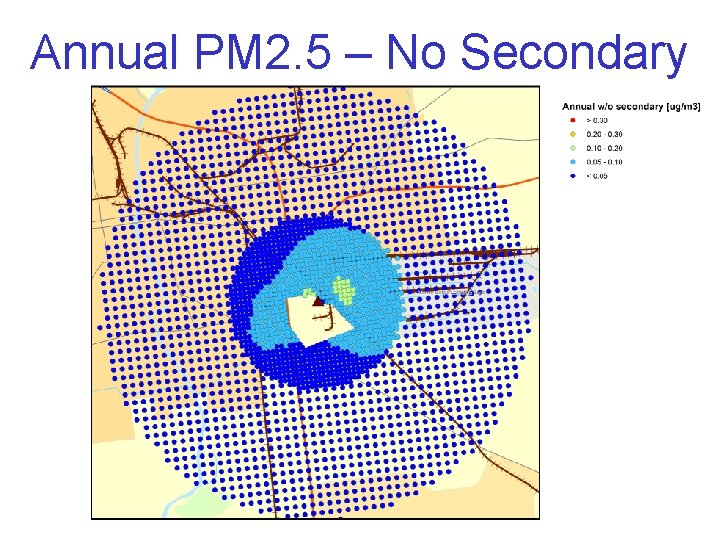
Annual PM 2. 5 – No Secondary
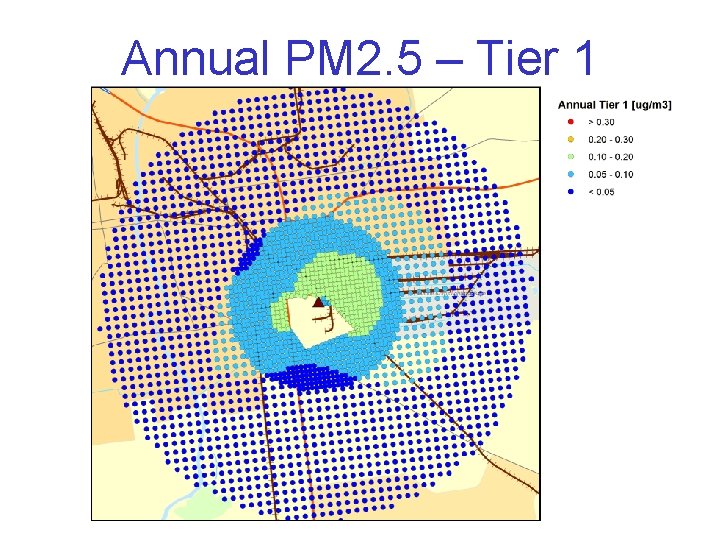
Annual PM 2. 5 – Tier 1
Annual PM 2. 5 vs. SIL
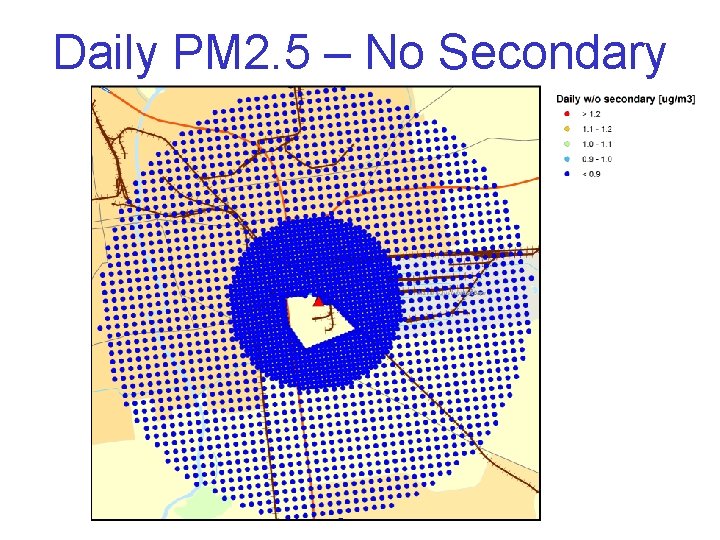
Daily PM 2. 5 – No Secondary
Daily PM 2. 5 – Tier 1
Daily PM 2. 5 – Tier 2
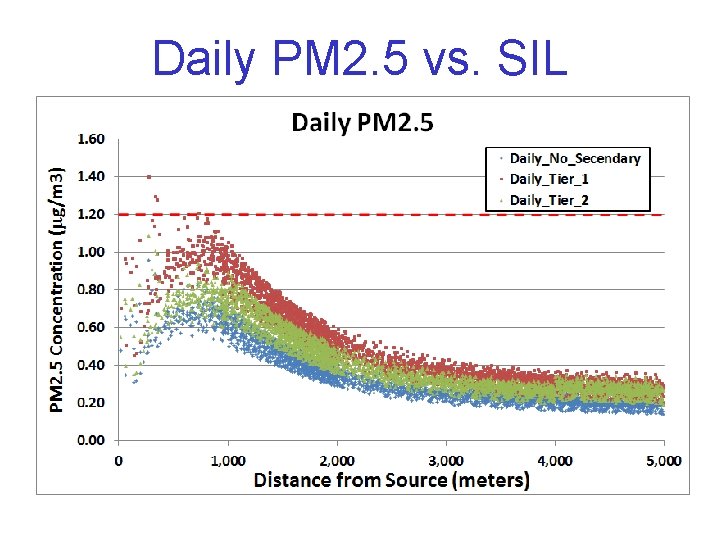
Daily PM 2. 5 vs. SIL
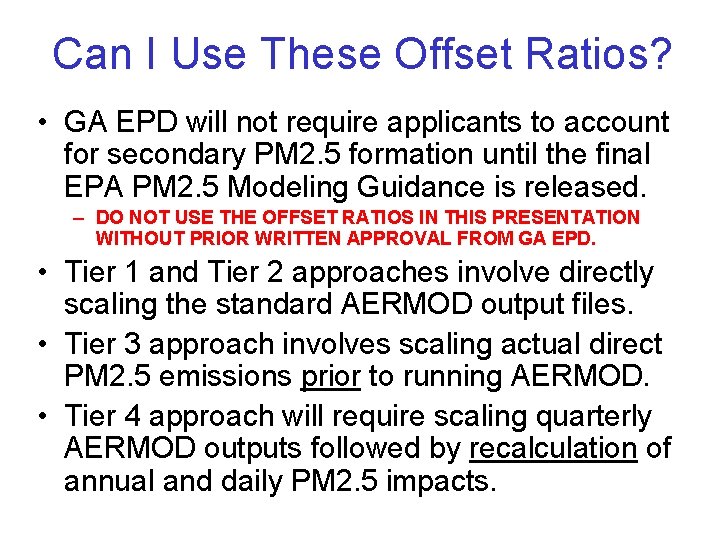
Can I Use These Offset Ratios? • GA EPD will not require applicants to account for secondary PM 2. 5 formation until the final EPA PM 2. 5 Modeling Guidance is released. – DO NOT USE THE OFFSET RATIOS IN THIS PRESENTATION WITHOUT PRIOR WRITTEN APPROVAL FROM GA EPD. • Tier 1 and Tier 2 approaches involve directly scaling the standard AERMOD output files. • Tier 3 approach involves scaling actual direct PM 2. 5 emissions prior to running AERMOD. • Tier 4 approach will require scaling quarterly AERMOD outputs followed by recalculation of annual and daily PM 2. 5 impacts.
SIP Modeling Update
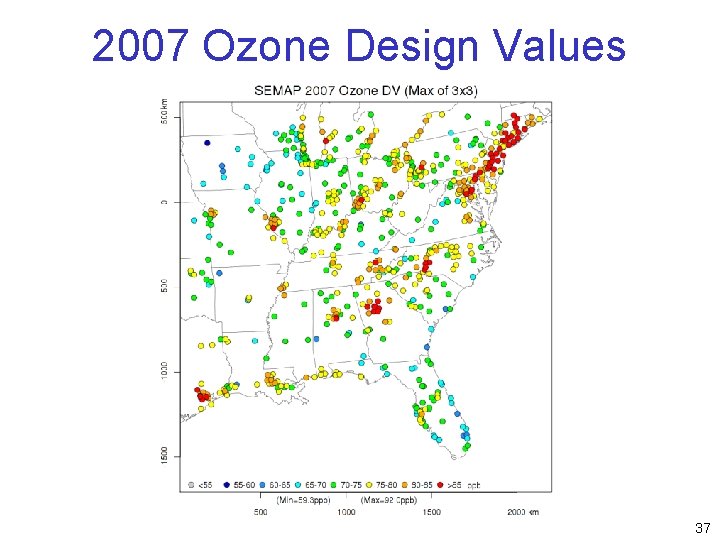
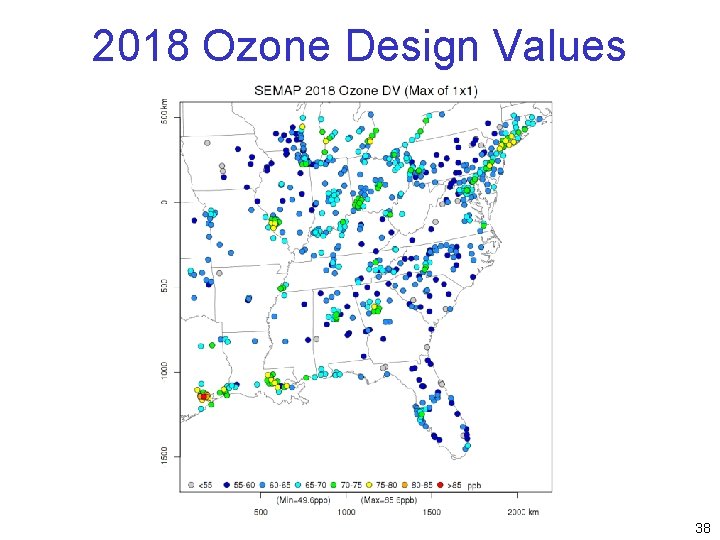
Attainment SIP Updates • Georgia is meeting the 1997 ozone NAAQS (85 ppb) and the 2006 PM 2. 5 NAAQS (15 mg/m 3) – Ozone maintenance plan for Atlanta was approved – PM 2. 5 maintenance plans for Atlanta, Macon, Floyd County, and Chattanooga are pending • Atlanta was designed nonattainment for the 2008 ozone NAAQS (75 ppb) – 15 counties – “Marginal” ozone areas do not require modeling • Georgia did not recommend any areas nonattainment for the 2012 PM 2. 5 NAAQS (12 mg/m 3) – Waiting for EPA official designations 30
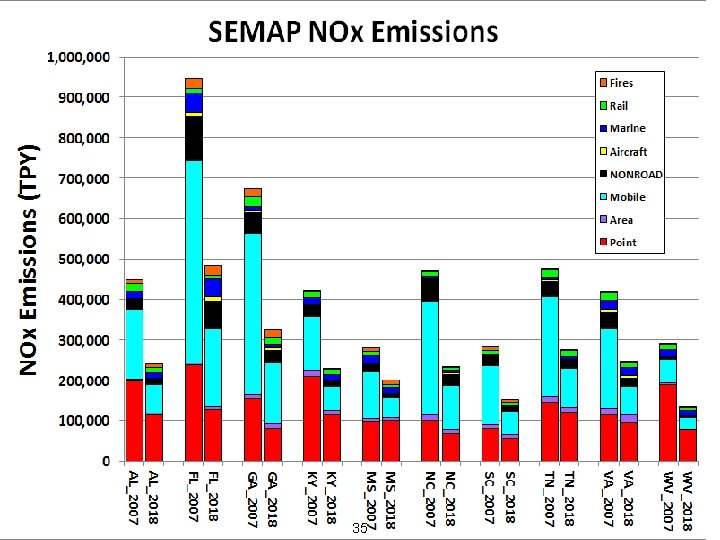
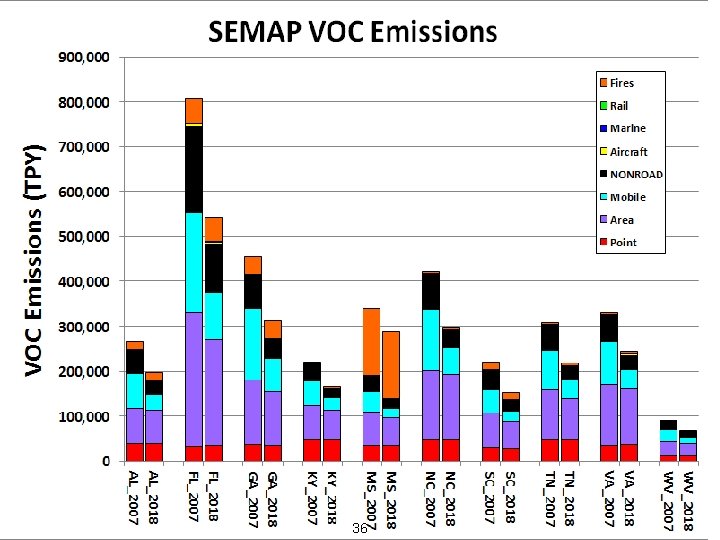
SEMAP Project • South. Eastern Modeling, Analysis, and Planning (SEMAP) Project – Managed through SESARM – Same group of states that were involved with SAMI, VISTAS, and ASIP • AL, FL, GA, KY, MS, NC, SC, TN, VA, WV • 2007 and 2018 annual modeling with CMAQv 5. 01 – 36 km (CONUS) and 12 km grids – Ozone, PM 2. 5, Regional Haze 31
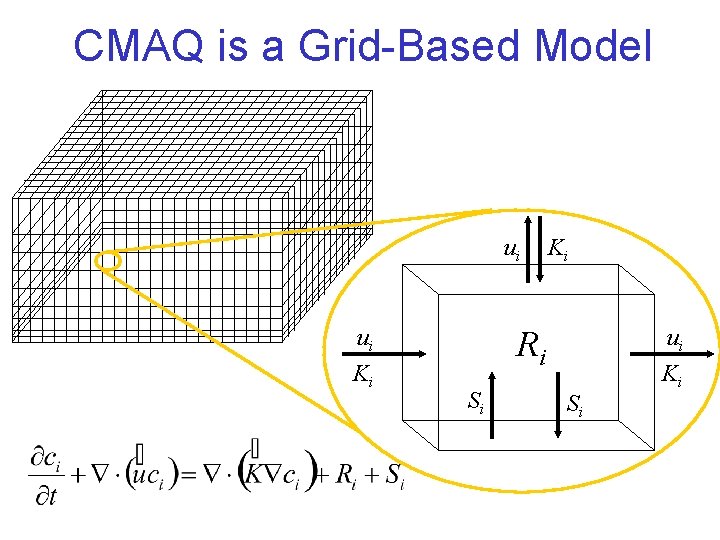
CMAQ is a Grid-Based Model ui ui Ki Ki Ri Si Si ui Ki
SEMAP 12 -km Modeling Domain 33
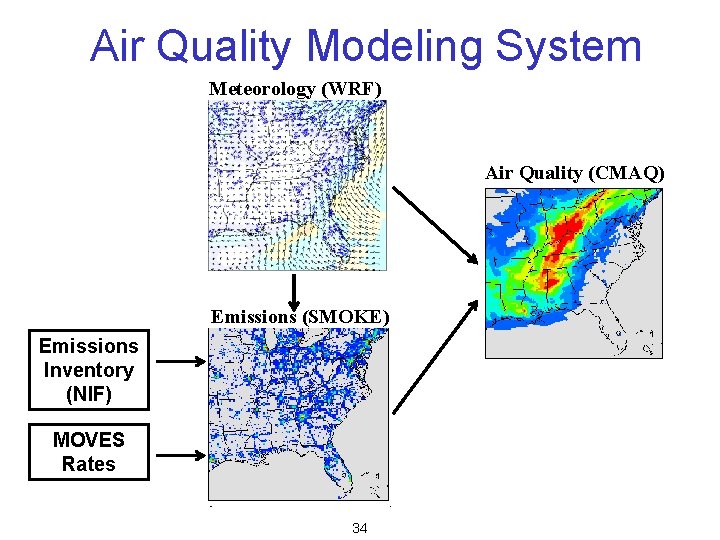
Air Quality Modeling System Meteorology (WRF) Air Quality (CMAQ) Emissions (SMOKE) Emissions Inventory (NIF) MOVES Rates 34
35
36
2007 Ozone Design Values 37
2018 Ozone Design Values 38
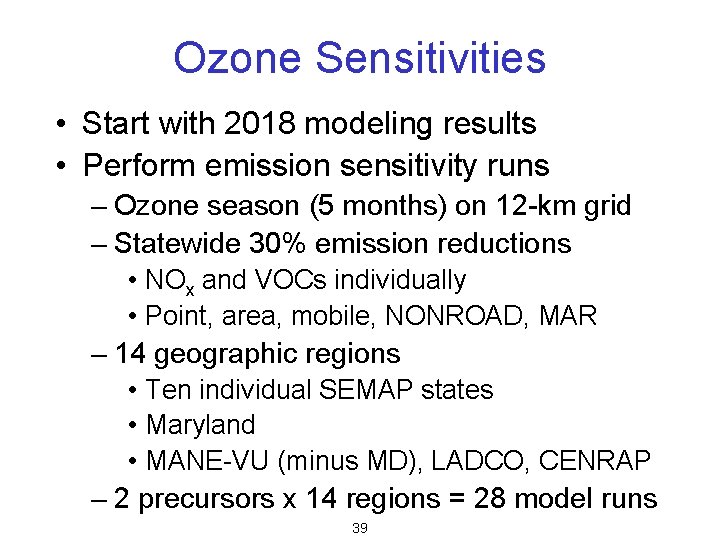
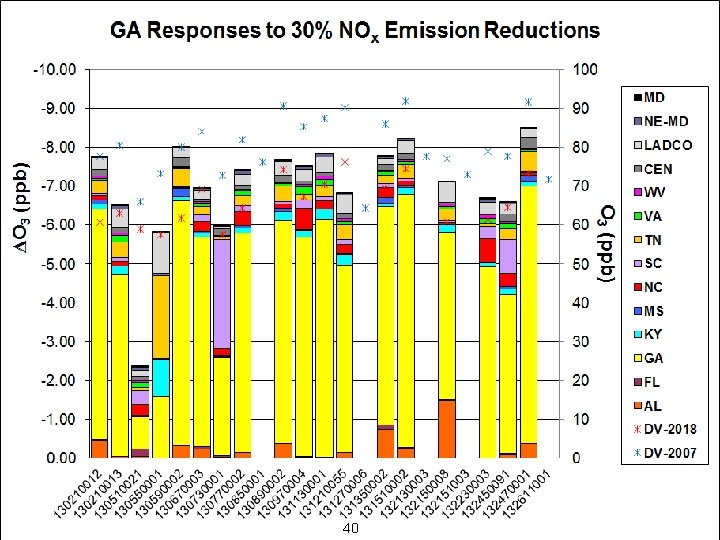
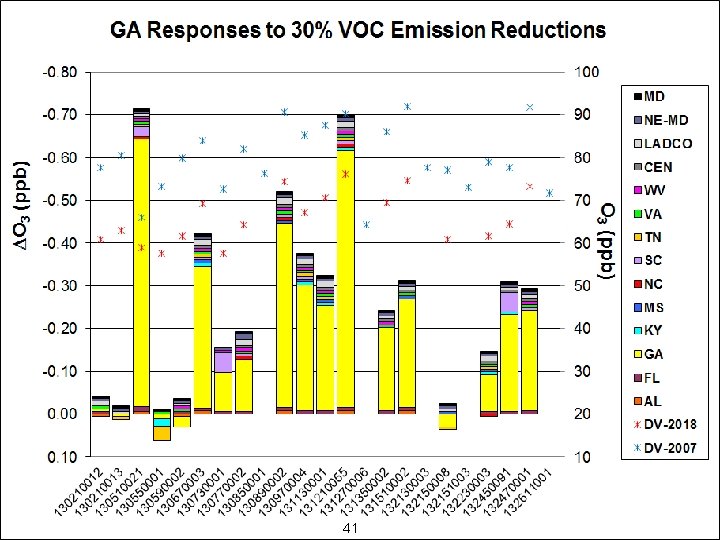
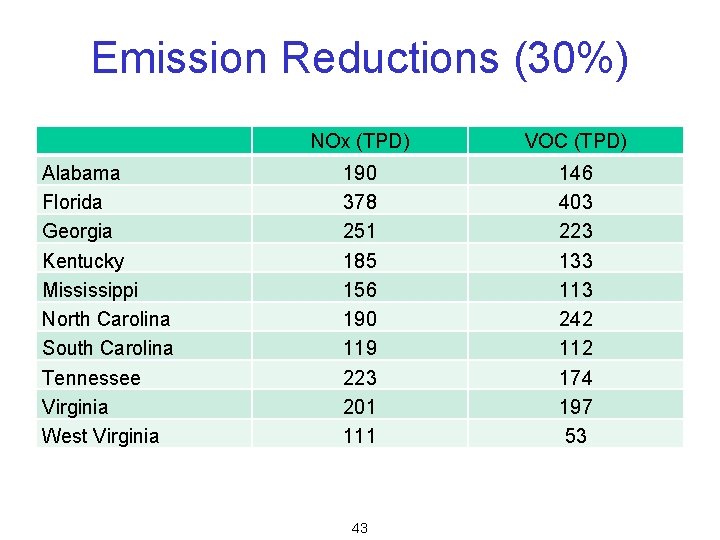
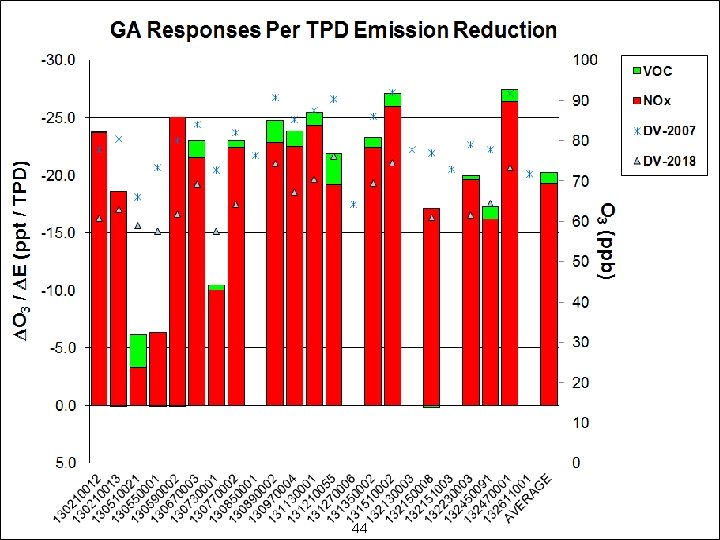
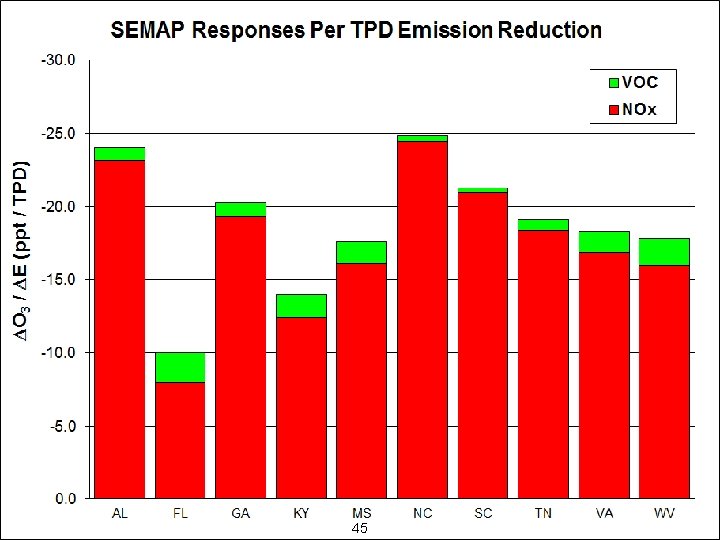
Ozone Sensitivities • Start with 2018 modeling results • Perform emission sensitivity runs – Ozone season (5 months) on 12 -km grid – Statewide 30% emission reductions • NOx and VOCs individually • Point, area, mobile, NONROAD, MAR – 14 geographic regions • Ten individual SEMAP states • Maryland • MANE-VU (minus MD), LADCO, CENRAP – 2 precursors x 14 regions = 28 model runs 39
40
41
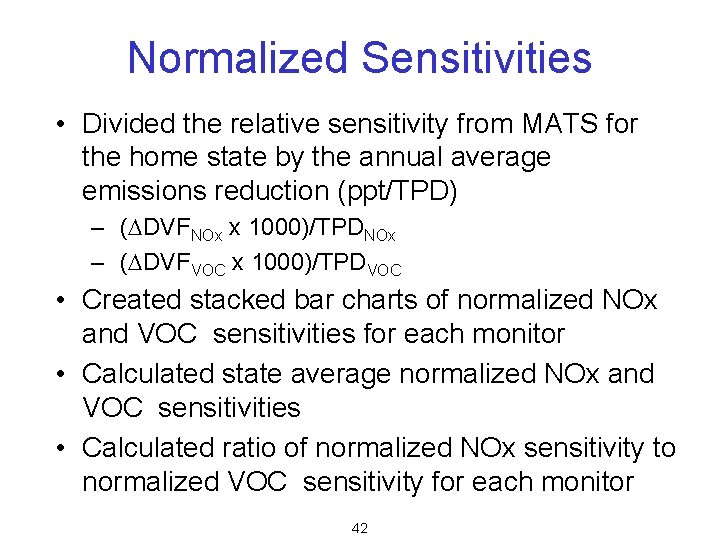
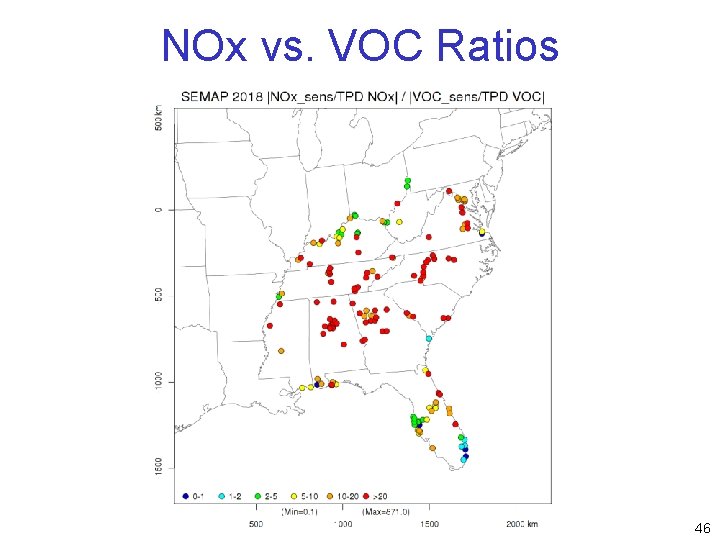
Normalized Sensitivities • Divided the relative sensitivity from MATS for the home state by the annual average emissions reduction (ppt/TPD) – (DDVFNOx x 1000)/TPDNOx – (DDVFVOC x 1000)/TPDVOC • Created stacked bar charts of normalized NOx and VOC sensitivities for each monitor • Calculated state average normalized NOx and VOC sensitivities • Calculated ratio of normalized NOx sensitivity to normalized VOC sensitivity for each monitor 42
Emission Reductions (30%) Alabama Florida Georgia Kentucky Mississippi North Carolina South Carolina Tennessee Virginia West Virginia NOx (TPD) VOC (TPD) 190 378 251 185 156 190 119 223 201 111 146 403 223 133 113 242 112 174 197 53 43
44
45
NOx vs. VOC Ratios 46
Interstate Contributions • Examined state-by-state contributions at downwind sites with DVF > 75 ppb in 2018 • Divided state-by-state 30% NOx contributions from MATS by 0. 3 to obtain 100% NOx contribution from each state – Assumes NOx sensitivities are linear to 100% • Removed contributions from non-SEMAP states and from home states • Identified SEMAP states that contributed more than various thresholds: – 1. 0 ppb – 0. 75 ppb 47
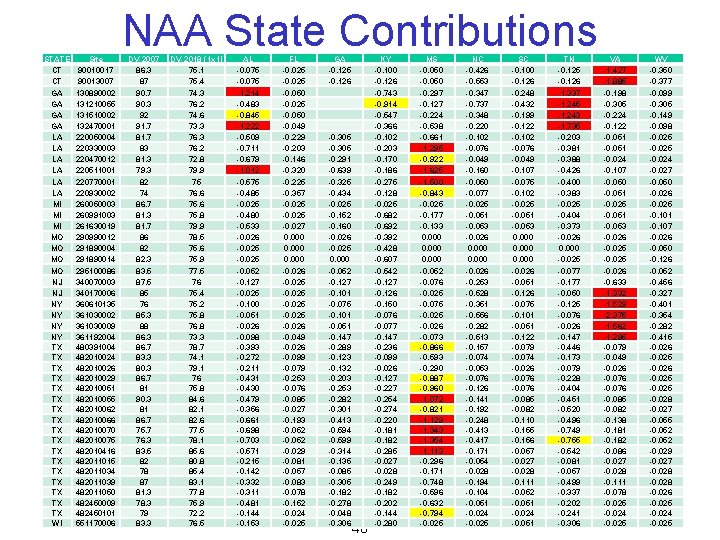
STATE CT CT GA GA LA LA LA MI MI MI MO MO NJ NJ NY NY TX TX TX TX TX WI Site 90010017 90013007 130890002 131210055 131510002 132470001 220050004 220330003 220470012 220511001 220770001 220930002 260050003 260991003 261630019 290990012 291890004 291890014 295100086 340070003 340170006 360610135 361030002 361030009 361192004 480391004 482010026 482010029 482010051 482010055 482010062 482010066 482010070 482010075 482010416 482011015 482011034 482011039 482011050 482450009 482450101 551170006 NAA State Contributions DV-2007 86. 3 87 90. 3 92 91. 7 83 81. 3 79. 3 82 74 86. 7 81. 3 81. 7 86 82 82. 3 83. 5 87. 5 85 76 85. 3 88 86. 3 86. 7 83. 3 80. 3 86. 7 81 90. 3 81 86. 7 75. 7 76. 3 83. 5 82 78 87 81. 3 78. 3 79 83. 3 DV-2018 (1 x 1) 75. 1 75. 4 74. 3 76. 2 74. 6 73. 3 76. 2 72. 8 79. 9 75 76. 6 75. 8 79. 9 78. 5 75. 6 75. 9 77. 5 76 75. 4 75. 2 75. 8 76. 8 73. 3 78. 7 74. 1 79. 1 76 75. 8 84. 6 82. 1 82. 6 77. 5 78. 1 85. 6 80. 8 85. 4 83. 1 77. 8 75. 9 72. 2 76. 5 AL -0. 075 -1. 214 -0. 483 -0. 845 -1. 222 -0. 509 -0. 711 -0. 679 -1. 012 -0. 575 -0. 485 -0. 025 -0. 480 -0. 533 -0. 026 -0. 025 -0. 052 -0. 127 -0. 025 -0. 100 -0. 051 -0. 026 -0. 098 -0. 393 -0. 272 -0. 211 -0. 430 -0. 479 -0. 356 -0. 661 -0. 698 -0. 703 -0. 571 -0. 215 -0. 142 -0. 332 -0. 311 -0. 481 -0. 144 -0. 153 FL -0. 025 -0. 050 -0. 049 -0. 229 -0. 203 -0. 146 -0. 320 -0. 225 -0. 357 -0. 025 -0. 027 0. 000 -0. 026 -0. 025 -0. 026 -0. 049 -0. 026 -0. 099 -0. 079 -0. 253 -0. 076 -0. 085 -0. 027 -0. 193 -0. 052 -0. 029 -0. 081 -0. 057 -0. 083 -0. 078 -0. 152 -0. 024 -0. 025 GA -0. 125 -0. 126 -0. 305 -0. 291 -0. 639 -0. 325 -0. 434 -0. 025 -0. 152 -0. 160 -0. 026 -0. 025 0. 000 -0. 052 -0. 127 -0. 101 -0. 075 -0. 101 -0. 051 -0. 147 -0. 289 -0. 123 -0. 132 -0. 203 -0. 253 -0. 282 -0. 301 -0. 413 -0. 594 -0. 599 -0. 314 -0. 135 -0. 085 -0. 305 -0. 182 -0. 278 -0. 048 -0. 306 48 KY -0. 100 -0. 126 -0. 743 -0. 914 -0. 547 -0. 366 -0. 102 -0. 203 -0. 170 -0. 186 -0. 275 -0. 128 -0. 025 -0. 682 -0. 692 -0. 392 -0. 428 -0. 607 -0. 542 -0. 127 -0. 126 -0. 150 -0. 076 -0. 077 -0. 147 -0. 236 -0. 099 -0. 026 -0. 127 -0. 254 -0. 274 -0. 220 -0. 181 -0. 182 -0. 285 -0. 027 -0. 028 -0. 249 -0. 182 -0. 202 -0. 144 -0. 280 MS -0. 050 -0. 297 -0. 127 -0. 224 -0. 538 -0. 661 -1. 295 -0. 922 -1. 625 -1. 500 -0. 843 -0. 025 -0. 177 -0. 133 0. 000 -0. 052 -0. 076 -0. 025 -0. 075 -0. 026 -0. 073 -0. 866 -0. 593 -0. 290 -0. 887 -0. 960 -1. 072 -0. 821 -1. 129 -1. 343 -1. 354 -1. 113 -0. 296 -0. 171 -0. 748 -0. 596 -0. 632 -0. 794 -0. 025 NC -0. 426 -0. 553 -0. 347 -0. 737 -0. 348 -0. 220 -0. 102 -0. 076 -0. 049 -0. 160 -0. 050 -0. 077 -0. 025 -0. 051 -0. 053 -0. 026 0. 000 -0. 026 -0. 253 -0. 528 -0. 351 -0. 556 -0. 282 -0. 513 -0. 157 -0. 074 -0. 053 -0. 076 -0. 126 -0. 141 -0. 192 -0. 248 -0. 413 -0. 417 -0. 171 -0. 054 -0. 028 -0. 194 -0. 104 -0. 051 -0. 024 -0. 025 SC -0. 100 -0. 126 -0. 248 -0. 432 -0. 199 -0. 122 -0. 102 -0. 076 -0. 049 -0. 107 -0. 075 -0. 102 -0. 025 -0. 051 -0. 053 0. 000 -0. 026 -0. 051 -0. 126 -0. 075 -0. 101 -0. 051 -0. 122 -0. 079 -0. 074 -0. 026 -0. 076 -0. 085 -0. 082 -0. 110 -0. 155 -0. 156 -0. 057 -0. 028 -0. 111 -0. 052 -0. 051 -0. 024 -0. 051 TN -0. 125 -0. 126 -1. 337 -1. 245 -1. 243 -1. 735 -0. 203 -0. 381 -0. 388 -0. 426 -0. 400 -0. 383 -0. 025 -0. 404 -0. 373 -0. 026 0. 000 -0. 025 -0. 077 -0. 177 -0. 050 -0. 125 -0. 076 -0. 026 -0. 147 -0. 446 -0. 173 -0. 079 -0. 228 -0. 404 -0. 451 -0. 520 -0. 496 -0. 749 -0. 755 -0. 542 -0. 081 -0. 057 -0. 499 -0. 337 -0. 202 -0. 241 -0. 306 VA -1. 427 -1. 885 -0. 198 -0. 305 -0. 224 -0. 122 -0. 051 -0. 024 -0. 107 -0. 050 -0. 051 -0. 025 -0. 051 -0. 053 -0. 026 -0. 025 -0. 026 -0. 633 -1. 332 -1. 529 -2. 375 -1. 562 -1. 295 -0. 079 -0. 049 -0. 026 -0. 076 -0. 085 -0. 082 -0. 138 -0. 181 -0. 182 -0. 086 -0. 027 -0. 028 -0. 111 -0. 078 -0. 025 -0. 024 -0. 025 WV -0. 350 -0. 377 -0. 099 -0. 305 -0. 149 -0. 098 -0. 025 -0. 024 -0. 027 -0. 050 -0. 026 -0. 025 -0. 101 -0. 107 -0. 026 -0. 050 -0. 126 -0. 052 -0. 456 -0. 327 -0. 401 -0. 354 -0. 282 -0. 415 -0. 026 -0. 025 -0. 028 -0. 027 -0. 055 -0. 052 -0. 029 -0. 027 -0. 028 -0. 026 -0. 025 -0. 024 -0. 025
SEMAP Next Steps • Examine SEMAP 2018 projections for PM 2. 5 and Regional Haze • Replicate EPA 2011 and 2018 modeling – May adjust 2018 EGUs based on ERTAC model – May replace SMOKE-MOVES emissions with inventory mode MOVES – May adjust VOC emissions from fires – May perform NOx emission sensitivities • Create 2028 emission inventory and perform 2028 modeling for Regional Haze 49
SO 2 SIP Modeling Update
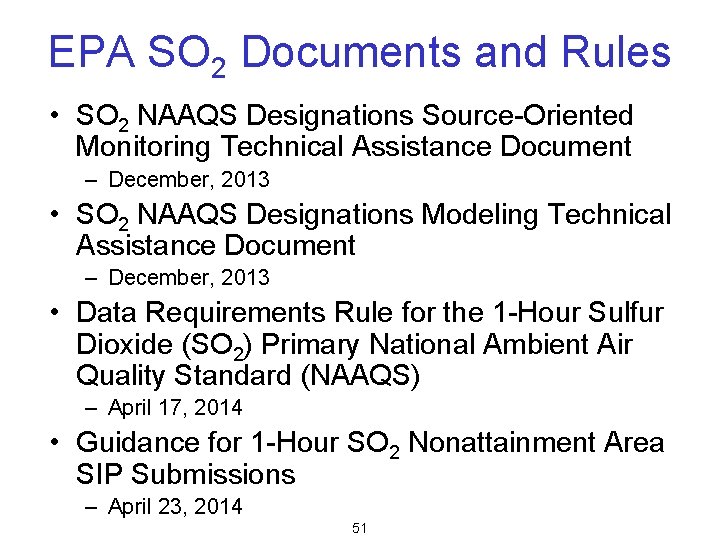
EPA SO 2 Documents and Rules • SO 2 NAAQS Designations Source-Oriented Monitoring Technical Assistance Document – December, 2013 • SO 2 NAAQS Designations Modeling Technical Assistance Document – December, 2013 • Data Requirements Rule for the 1 -Hour Sulfur Dioxide (SO 2) Primary National Ambient Air Quality Standard (NAAQS) – April 17, 2014 • Guidance for 1 -Hour SO 2 Nonattainment Area SIP Submissions – April 23, 2014 51
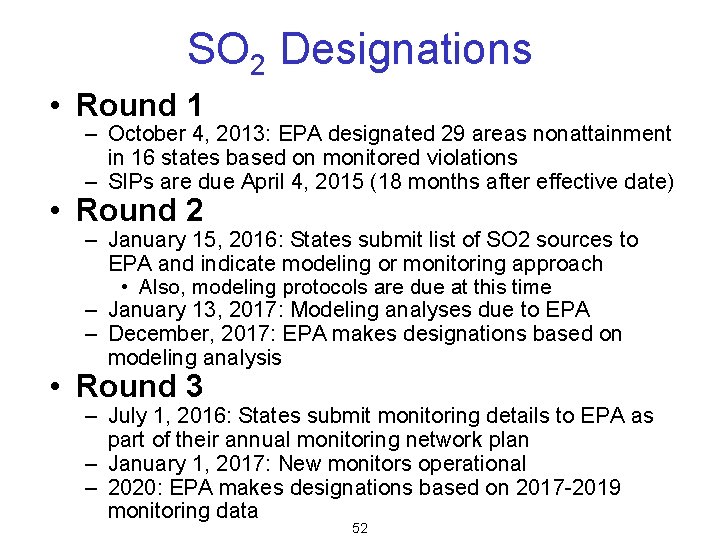
SO 2 Designations • Round 1 – October 4, 2013: EPA designated 29 areas nonattainment in 16 states based on monitored violations – SIPs are due April 4, 2015 (18 months after effective date) • Round 2 – January 15, 2016: States submit list of SO 2 sources to EPA and indicate modeling or monitoring approach • Also, modeling protocols are due at this time – January 13, 2017: Modeling analyses due to EPA – December, 2017: EPA makes designations based on modeling analysis • Round 3 – July 1, 2016: States submit monitoring details to EPA as part of their annual monitoring network plan – January 1, 2017: New monitors operational – 2020: EPA makes designations based on 2017 -2019 monitoring data 52
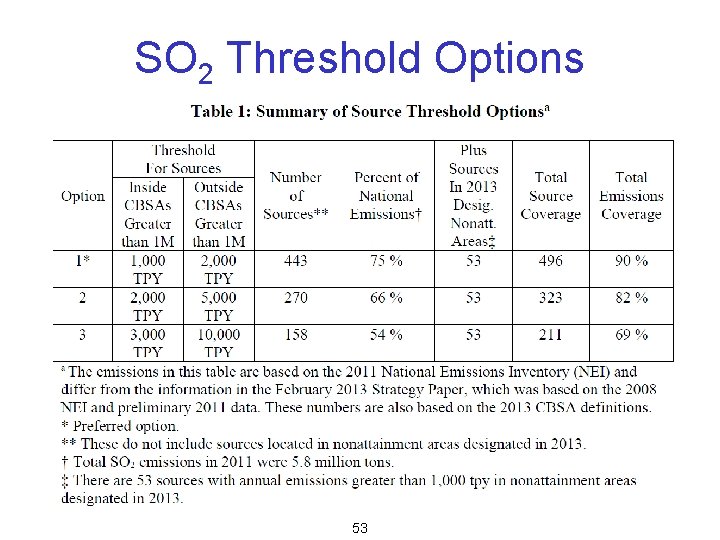
SO 2 Threshold Options 53
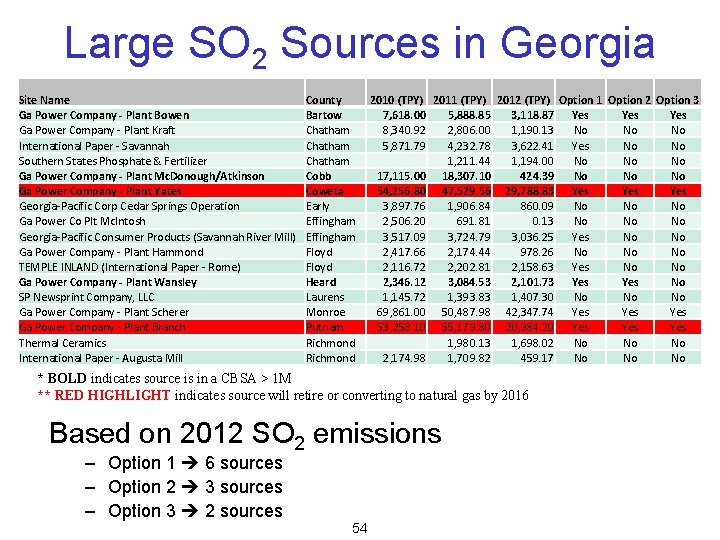
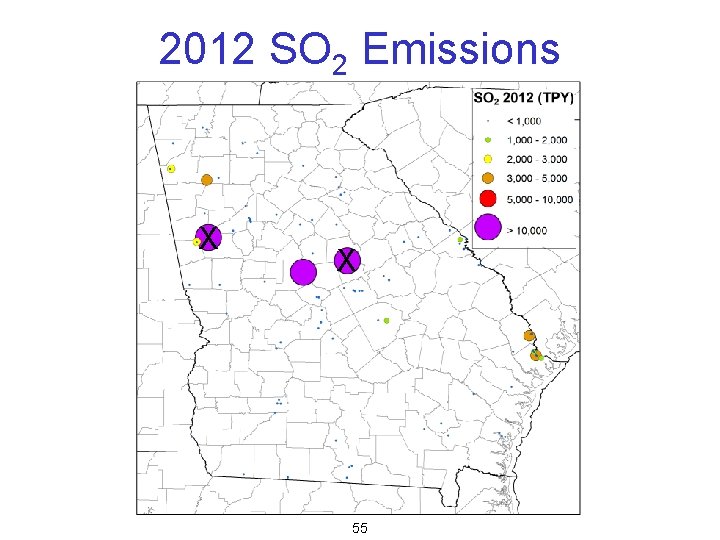
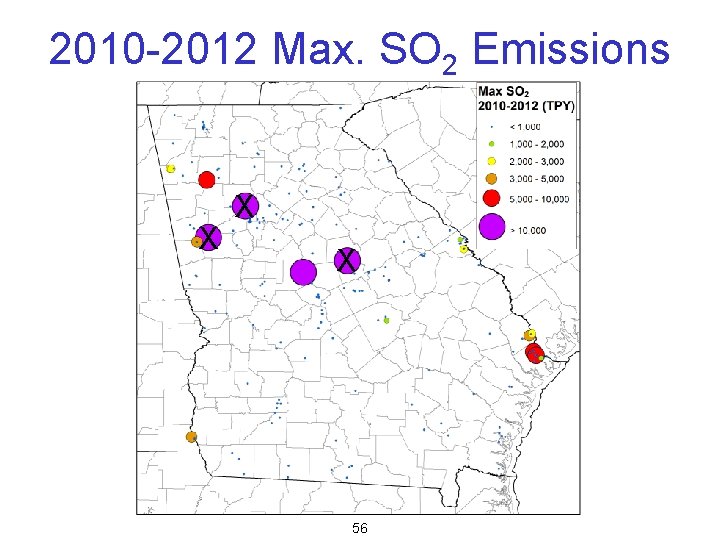
Large SO 2 Sources in Georgia Site Name Ga Power Company - Plant Bowen Ga Power Company - Plant Kraft International Paper - Savannah Southern States Phosphate & Fertilizer Ga Power Company - Plant Mc. Donough/Atkinson Ga Power Company - Plant Yates Georgia-Pacific Corp Cedar Springs Operation Ga Power Co Plt Mc. Intosh Georgia-Pacific Consumer Products (Savannah River Mill) Ga Power Company - Plant Hammond TEMPLE INLAND (International Paper - Rome) Ga Power Company - Plant Wansley SP Newsprint Company, LLC Ga Power Company - Plant Scherer Ga Power Company - Plant Branch Thermal Ceramics International Paper - Augusta Mill County Bartow Chatham Cobb Coweta Early Effingham Floyd Heard Laurens Monroe Putnam Richmond 2010 (TPY) 2011 (TPY) 2012 (TPY) Option 1 Option 2 Option 3 7, 618. 00 5, 888. 85 3, 118. 87 Yes Yes 8, 340. 92 2, 806. 00 1, 190. 13 No No No 5, 871. 79 4, 232. 78 3, 622. 41 Yes No No 1, 211. 44 1, 194. 00 No No No 17, 115. 00 18, 307. 10 424. 39 No No No 54, 256. 80 47, 529. 56 29, 788. 83 Yes Yes 3, 897. 76 1, 906. 84 860. 09 No No No 2, 506. 20 691. 81 0. 13 No No No 3, 517. 09 3, 724. 79 3, 036. 25 Yes No No 2, 417. 66 2, 174. 44 978. 26 No No No 2, 116. 72 2, 202. 81 2, 158. 63 Yes No No 2, 346. 12 3, 084. 53 2, 101. 73 Yes No 1, 145. 72 1, 393. 83 1, 407. 30 No No No 69, 861. 00 50, 487. 98 42, 347. 74 Yes Yes 53, 258. 10 55, 179. 80 20, 984. 20 Yes Yes 1, 980. 13 1, 698. 02 No No No 2, 174. 98 1, 709. 82 459. 17 No No No * BOLD indicates source is in a CBSA > 1 M ** RED HIGHLIGHT indicates source will retire or converting to natural gas by 2016 Based on 2012 SO 2 emissions – Option 1 6 sources – Option 2 3 sources – Option 3 2 sources 54
2012 SO 2 Emissions X X 55
2010 -2012 Max. SO 2 Emissions X X X 56
Contact Information Jim Boylan, Ph. D. Georgia Dept. of Natural Resources 4244 International Parkway, Suite 120 Atlanta, GA 30354 James. Boylan@dnr. state. ga. us 404 -362 -4851