
FY 15 Financial Results By Dr Marilyn Fowle
FY 15 Financial Results By Dr. Marilyn Fowle’ November 12, 2015
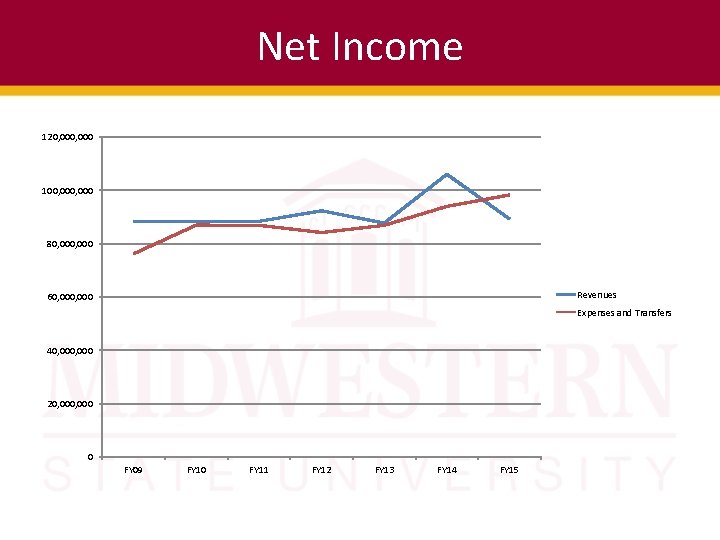
Net Income 120, 000 100, 000 80, 000 Revenues 60, 000 Expenses and Transfers 40, 000 20, 000 0 FY 09 FY 10 FY 11 FY 12 FY 13 FY 14 FY 15
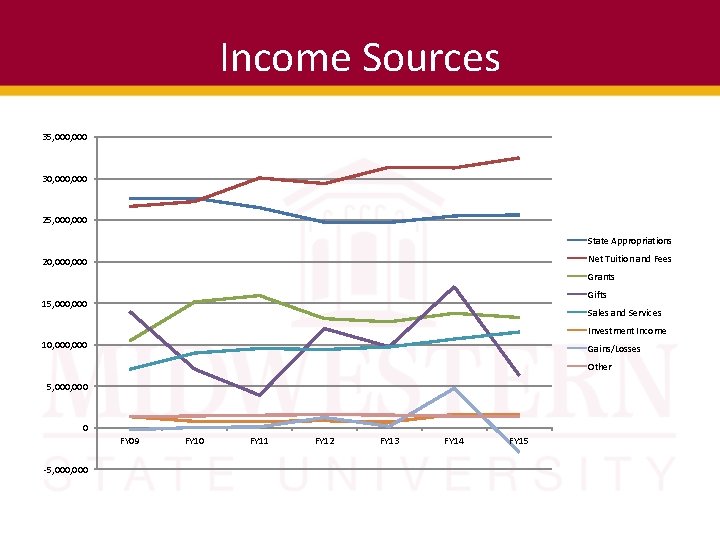
Income Sources 35, 000 30, 000 25, 000 State Appropriations Net Tuition and Fees 20, 000 Grants Gifts 15, 000 Sales and Services Investment Income 10, 000 Gains/Losses Other 5, 000 0 FY 09 -5, 000 FY 10 FY 11 FY 12 FY 13 FY 14 FY 15
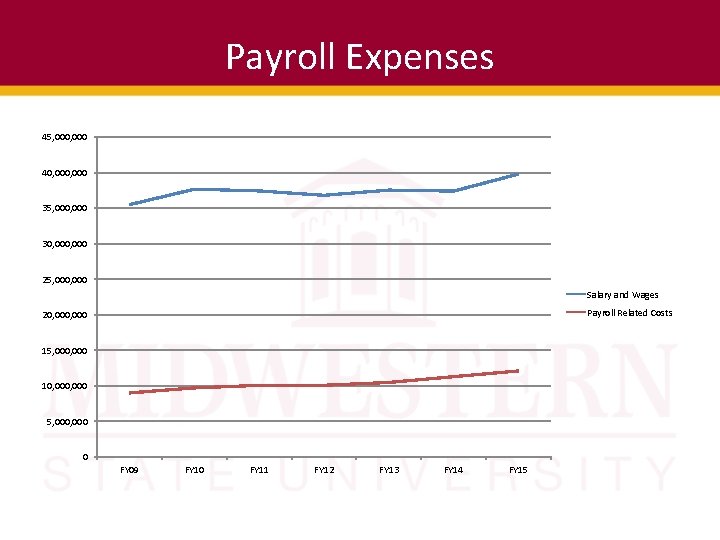
Payroll Expenses 45, 000 40, 000 35, 000 30, 000 25, 000 Salary and Wages Payroll Related Costs 20, 000 15, 000 10, 000 5, 000 0 FY 09 FY 10 FY 11 FY 12 FY 13 FY 14 FY 15
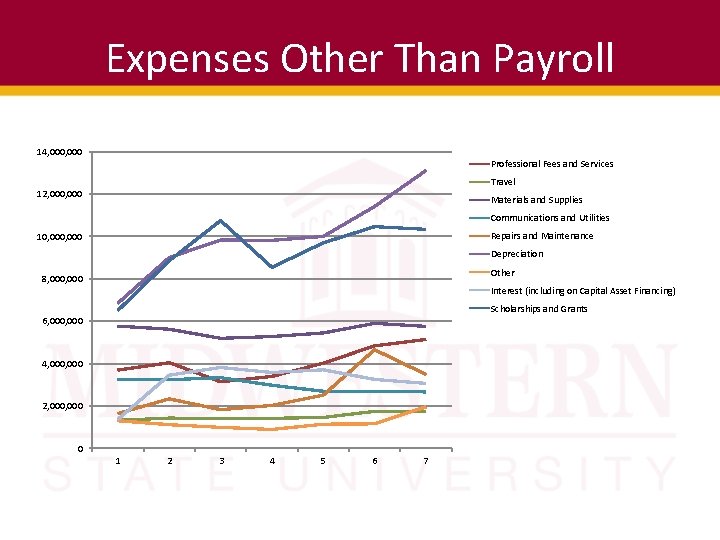
Expenses Other Than Payroll 14, 000 Professional Fees and Services Travel 12, 000 Materials and Supplies Communications and Utilities Repairs and Maintenance 10, 000 Depreciation Other 8, 000 Interest (including on Capital Asset Financing) Scholarships and Grants 6, 000 4, 000 2, 000 0 1 2 3 4 5 6 7
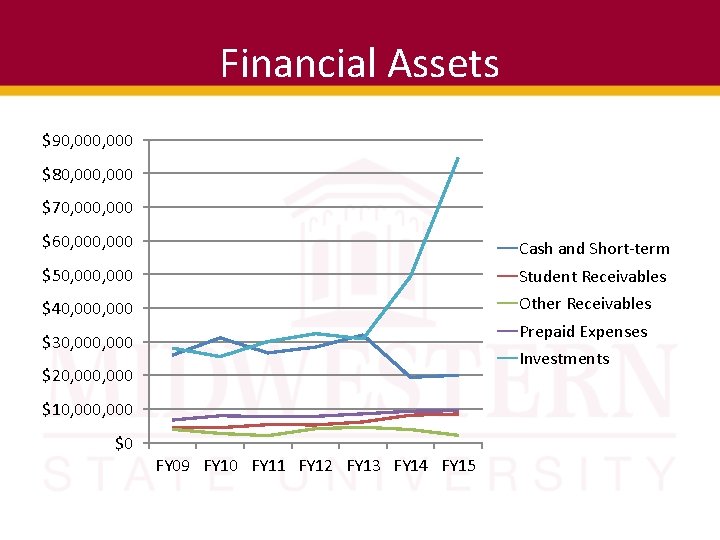
Financial Assets $90, 000 $80, 000 $70, 000 $60, 000 Cash and Short-term $50, 000 Student Receivables $40, 000 Other Receivables Prepaid Expenses $30, 000 Investments $20, 000 $10, 000 $0 FY 09 FY 10 FY 11 FY 12 FY 13 FY 14 FY 15
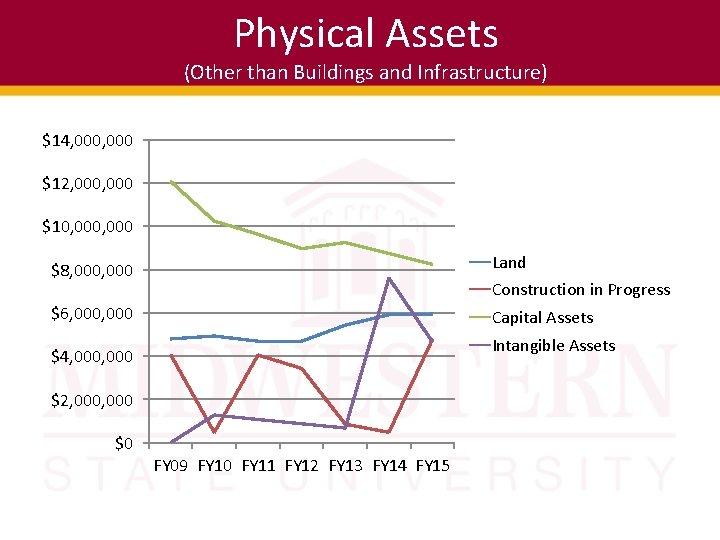
Physical Assets (Other than Buildings and Infrastructure) $14, 000 $12, 000 $10, 000 $8, 000 Land $6, 000 Capital Assets Construction in Progress Intangible Assets $4, 000 $2, 000 $0 FY 09 FY 10 FY 11 FY 12 FY 13 FY 14 FY 15
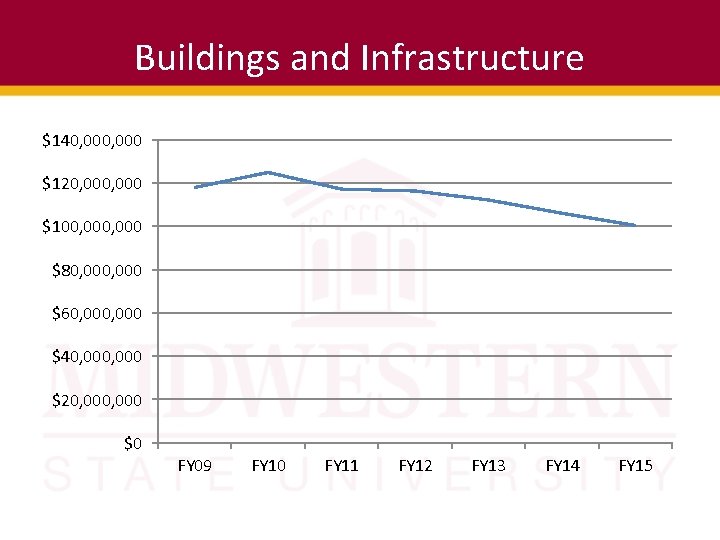
Buildings and Infrastructure $140, 000 $120, 000 $100, 000 $80, 000 $60, 000 $40, 000 $20, 000 $0 FY 09 FY 10 FY 11 FY 12 FY 13 FY 14 FY 15
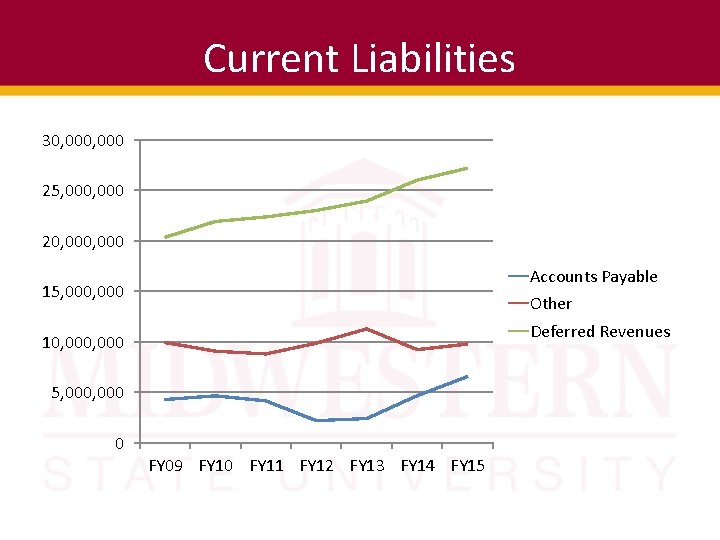
Current Liabilities 30, 000 25, 000 20, 000 Accounts Payable 15, 000 Other Deferred Revenues 10, 000 5, 000 0 FY 09 FY 10 FY 11 FY 12 FY 13 FY 14 FY 15
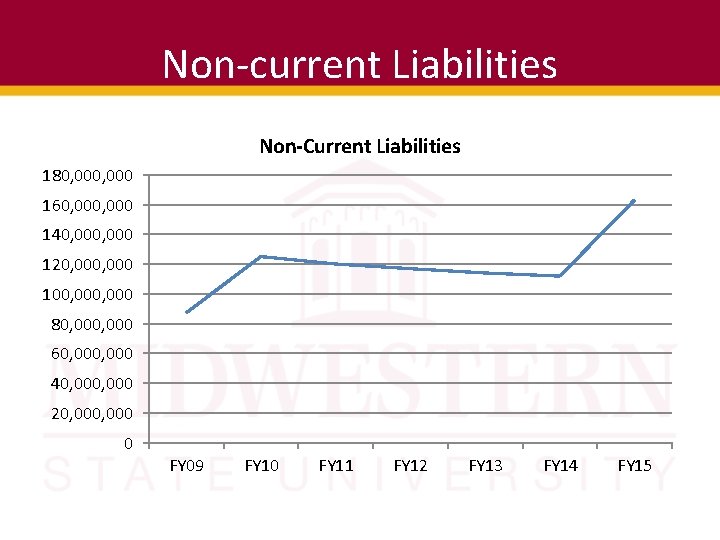
Non-current Liabilities Non-Current Liabilities 180, 000 160, 000 140, 000 120, 000 100, 000 80, 000 60, 000 40, 000 20, 000 0 FY 09 FY 10 FY 11 FY 12 FY 13 FY 14 FY 15
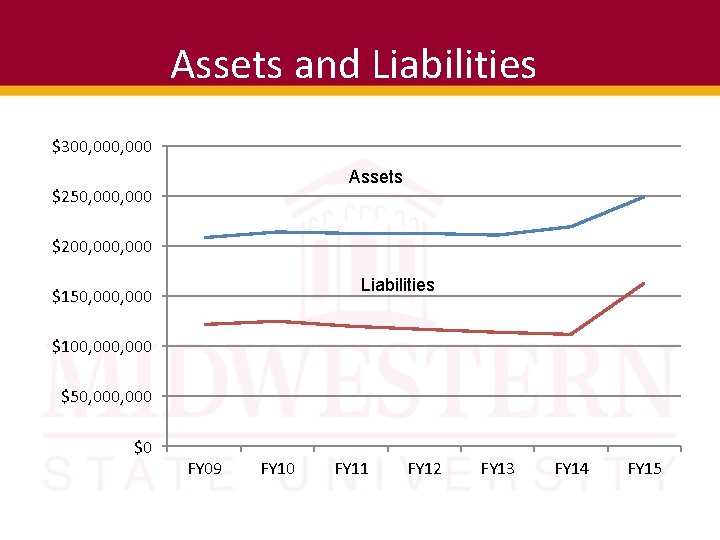
Assets and Liabilities $300, 000 Assets $250, 000 $200, 000 Liabilities $150, 000 $100, 000 $50, 000 $0 FY 09 FY 10 FY 11 FY 12 FY 13 FY 14 FY 15
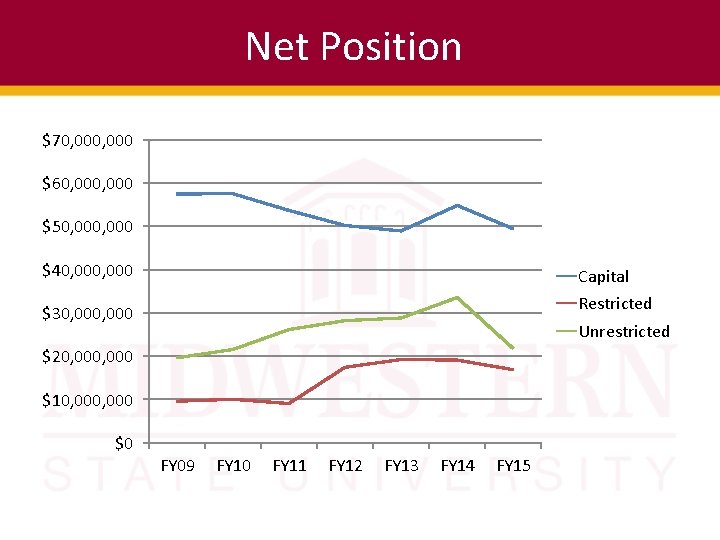
Net Position $70, 000 $60, 000 $50, 000 $40, 000 Capital Restricted $30, 000 Unrestricted $20, 000 $10, 000 $0 FY 09 FY 10 FY 11 FY 12 FY 13 FY 14 FY 15
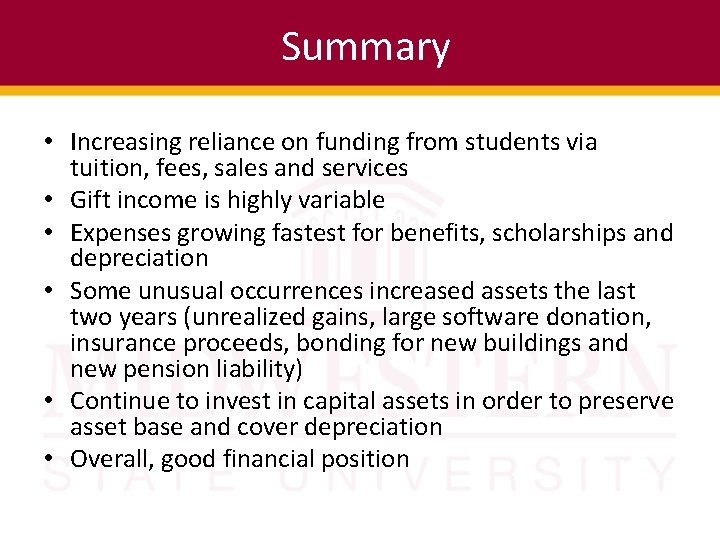
Summary • Increasing reliance on funding from students via tuition, fees, sales and services • Gift income is highly variable • Expenses growing fastest for benefits, scholarships and depreciation • Some unusual occurrences increased assets the last two years (unrealized gains, large software donation, insurance proceeds, bonding for new buildings and new pension liability) • Continue to invest in capital assets in order to preserve asset base and cover depreciation • Overall, good financial position
- Slides: 13