Futures Swaps and Risk Management Foreign Exchange Futures


- Slides: 35
Futures, Swaps, and Risk Management
Foreign Exchange Futures • Exchanges rates between currencies vary – Exporters • The forward market in foreign exchanges – Informal – Banks and brokers • Futures markets – Chicago Mercantile (International Monetary Market) – London International Financial Futures Exchange – Mid. America Commodity Exchange • Active forward market
Figure 23. 2 Foreign Exchange Futures
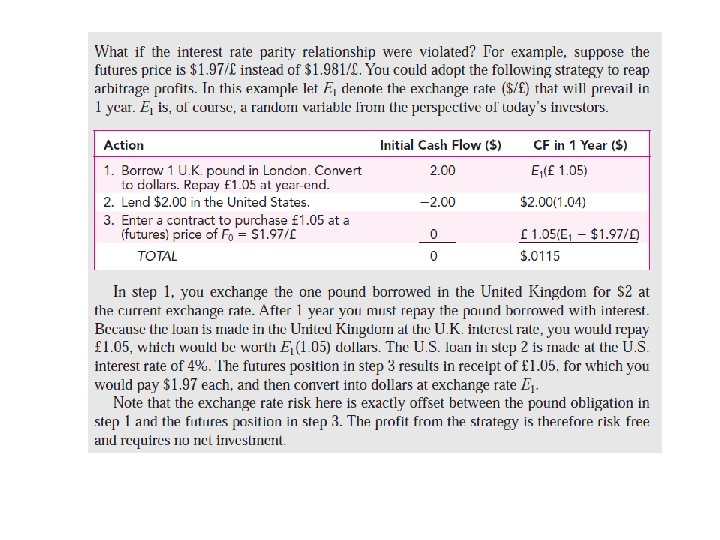
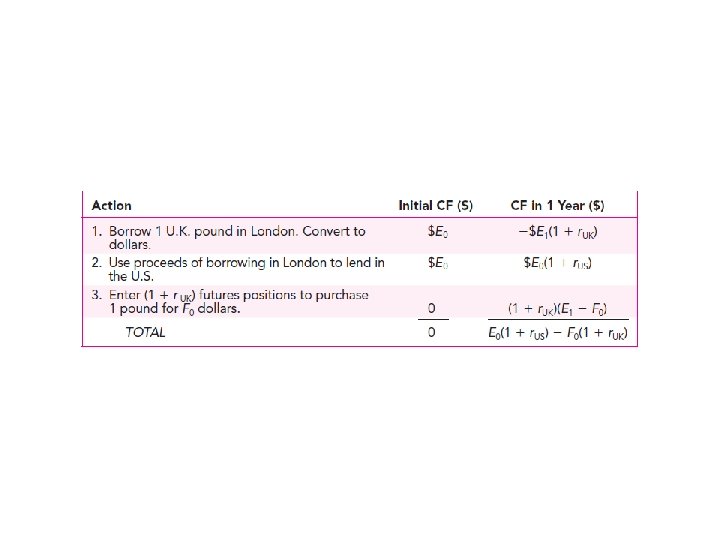
Pricing on Foreign Exchange Futures SPOT-FUTURE EXCHANEG RATE RELATION Interest rate parity theorem Developed using the US Dollar and British Pound where F 0 is the forward price E 0 is the current exchange rate
Text Pricing Example rus = 5% T = 1 yr ruk = 6% E 0 = $1. 60 per pound If the futures price varies from $1. 58 per pound arbitrage opportunities will be present.
Direct versus Indirect Quotes • A dolar per pound – Direct exchange rate quote • A unit of foreign currency per dollar – Indirect exchange rate quote
Hedging Foreign Exchange Risk A US firm wants to protect against a decline in profit that would result from a decline in the pound • Estimated profit loss of $200, 000 if the pound declines by $. 10 • Short or sell pounds for future delivery to avoid the exposure
Hedge Ratio for Foreign Exchange Example Hedge Ratio in pounds $200, 000 per $. 10 change in the pound/dollar exchange rate $. 10 profit per pound delivered per $. 10 in exchange rate = 2, 000 pounds to be delivered Hedge Ratio in contacts Each contract is for 62, 500 pounds or $6, 250 per a $. 10 change $200, 000 / $6, 250 = 32 contracts
Figure 23. 3 Profits as a Function of the Exchange Rate
Stock Index Contracts • Available on both domestic and international stocks • Advantages over direct stock purchase – lower transaction costs – better for timing or allocation strategies – takes less time to acquire the portfolio
Table 23. 1 Major Stock-Index Futures
Table 23. 2 Correlations among Major U. S. Stock Market Indexes
Creating Synthetic Positions with Futures • Synthetic stock purchase – Purchase of the stock index instead of actual shares of stock • Creation of a synthetic T-bill plus index futures that duplicates the payoff of the stock index contract
Synthetic Position Using Stock. Index Futures
Index Arbitrage Exploiting mispricing between underlying stocks and the futures index contract • Futures Price too high - short the future and buy the underlying stocks • Futures price too low - long the future and short sell the underlying stocks
Index Arbitrage and Program Trading This is difficult to implement in practice • Transactions costs are often too large • Trades cannot be done simultaneously Development of Program Trading • Used by arbitrageurs to perform index arbitrage • Permits acquisition of securities quickly
Hedging Systematic Risk To protect against a decline in level stock prices, short the appropriate number of futures index contracts • Less costly and quicker to use the index contracts • Use the beta for the portfolio to determine the hedge ratio
Hedging Systematic Risk: Text Example Portfolio Beta =. 8 S&P 500 = 1, 000 Decrease S&P falls to 975 = 2. 5% Portfolio Value = $30 million Project loss if market declines by 2. 5% = (. 8) (2. 5) = 2% 2% of $30 million = $600, 000 Each S&P 500 index contract will change $6, 250 for a 2. 5% change in the index
Hedge Ratio: Text Example H= = Change in the portfolio value Profit on one futures contract $600, 000 $6, 250 = 96 contracts short
Figure 23. 4 Predicted Value of the Portfolio as a Function of the Market Index
Uses of Interest Rate Hedges • Owners of fixed-income portfolios protecting against a rise in rates • Corporations planning to issue debt securities protecting against a rise in rates • Investor hedging against a decline in rates for a planned future investment • Exposure for a fixed-income portfolio is proportional to modified duration
Hedging Interest Rate Risk: Text Example Portfolio value Modified duration = $10 million = 9 years If rates rise by 10 basis points (. 1%) Change in value = ( 9 ) (. 1%) =. 9% or $90, 000 Present value of a basis point (PVBP) = $90, 000 / 10 = $9, 000
Hedge Ratio: Text Example H= = PVBP for the portfolio PVBP for the hedge vehicle $9, 000 $90 = 100 contracts
Figure 23. 5 Yield Spread between 10 -Year Treasury and Baa-Rated Corporate Bonds
Swaps • Interest rate swap • Foreign exchange swap • Credit risk on swaps
Figure 23. 6 Interest Rate Swap
Figure 23. 7 Interest Rate Futures
Pricing on Swap Contracts Swaps are essentially a series of forward contracts. One difference is that the swap is usually structured with the same payment each period while the forward rate would be different each period. Using a foreign exchange swap as an example, the swap pricing would be described by the following formula.
Figure 23. 8 Forward Contracts versus Swaps
Commodity Futures Pricing General principles that apply to stock apply to commodities. Carrying costs are more for commodities. Spoilage is a concern. Where; F 0 = futures price P 0 = cash price of the asset C = Carrying cost c = C/P 0
Figure 23. 9 Typical Agricultural Price Pattern over the Season
Table 23. 3 Commodity Betas