
Funding the NSP in South Africa Assessing alignment
- Slides: 17
Funding the NSP in South Africa: Assessing alignment of partners’ support to the National Strategy through past expenditure trend analysis Nthabiseng Khoza, National Department of Health, Government of South Africa 10 th International AIDS Economics Network Preconference Amsterdam, 20 July 2018 Abt Associates Inc. In collaboration with: Broad Branch Associates | Development Alternatives Inc. (DAI) | Futures Institute | Johns Hopkins Bloomberg School of Public Health (JHSPH) | Results for Development Institute (R 4 D) | RTI International | Training
Acknowledgements Analytic al team (FIN-CAP) NDOH (HIV CG team) With data, advice, and funding* from: v Department of Health v National Department of Basic Education v National Department of Social Development v National Treasury v South African National AIDS Council v Global Fund 2
Outline for rest of presentation 1. Motivation & methods 2. Selected findings 3. Key takeaways and reflections 3
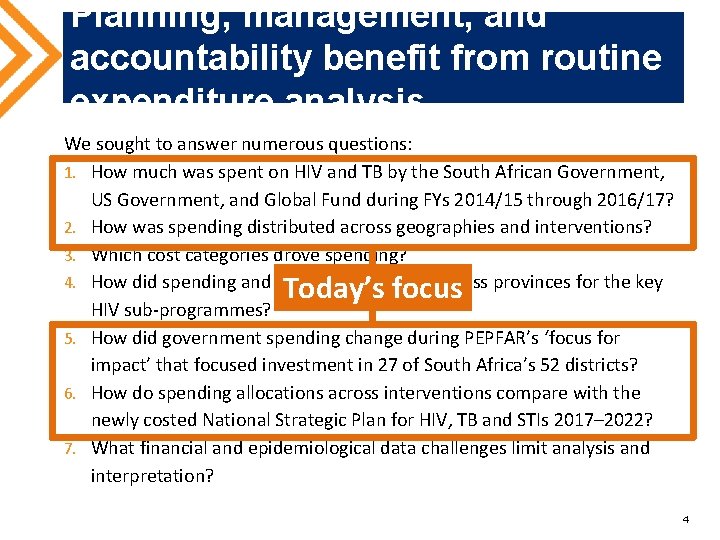
Planning, management, and accountability benefit from routine expenditure analysis We sought to answer numerous questions: 1. How much was spent on HIV and TB by the South African Government, US Government, and Global Fund during FYs 2014/15 through 2016/17? 2. How was spending distributed across geographies and interventions? 3. Which cost categories drove spending? 4. How did spending and outcomes compare across provinces for the key HIV sub-programmes? 5. How did government spending change during PEPFAR’s ‘focus for impact’ that focused investment in 27 of South Africa’s 52 districts? 6. How do spending allocations across interventions compare with the newly costed National Strategic Plan for HIV, TB and STIs 2017– 2022? 7. What financial and epidemiological data challenges limit analysis and interpretation? Today’s focus 4
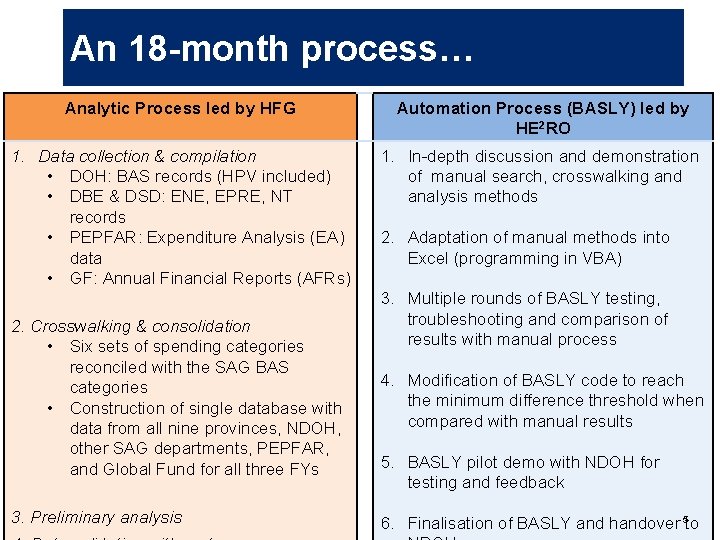
An 18 -month process… Analytic Process led by HFG Automation Process (BASLY) led by HE 2 RO 1. Data collection & compilation • DOH: BAS records (HPV included) • DBE & DSD: ENE, EPRE, NT records • PEPFAR: Expenditure Analysis (EA) data • GF: Annual Financial Reports (AFRs) 1. In-depth discussion and demonstration of manual search, crosswalking and analysis methods 2. Crosswalking & consolidation • Six sets of spending categories reconciled with the SAG BAS categories • Construction of single database with data from all nine provinces, NDOH, other SAG departments, PEPFAR, and Global Fund for all three FYs 3. Preliminary analysis 2. Adaptation of manual methods into Excel (programming in VBA) 3. Multiple rounds of BASLY testing, troubleshooting and comparison of results with manual process 4. Modification of BASLY code to reach the minimum difference threshold when compared with manual results 5. BASLY pilot demo with NDOH for testing and feedback 5 6. Finalisation of BASLY and handover to
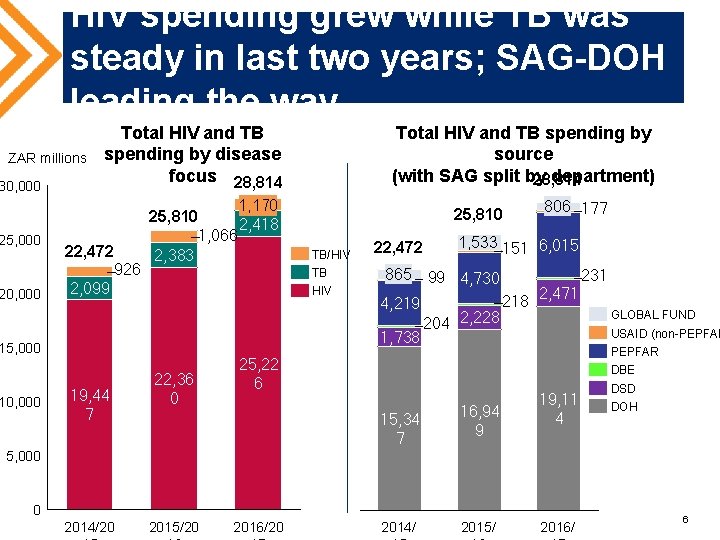
HIV spending grew while TB was steady in last two years; SAG-DOH leading the way ZAR millions 30, 000 25, 000 20, 000 22, 472 926 2, 099 1, 170 25, 810 2, 418 1, 066 2, 383 25, 810 TB/HIV TB HIV 22, 472 4, 219 19, 44 7 22, 36 0 806 177 1, 533 151 6, 015 865 99 4, 730 1, 738 15, 000 10, 000 Total HIV and TB spending by source (with SAG split by department) 28, 814 Total HIV and TB spending by disease focus 28, 814 204 2, 228 218 2, 471 231 GLOBAL FUND USAID (non-PEPFAR 25, 22 6 DBE 15, 34 7 16, 94 9 19, 11 4 DSD DOH 5, 000 0 2014/20 2015/20 2016/20 2014/ 2015/ 2016/ 6
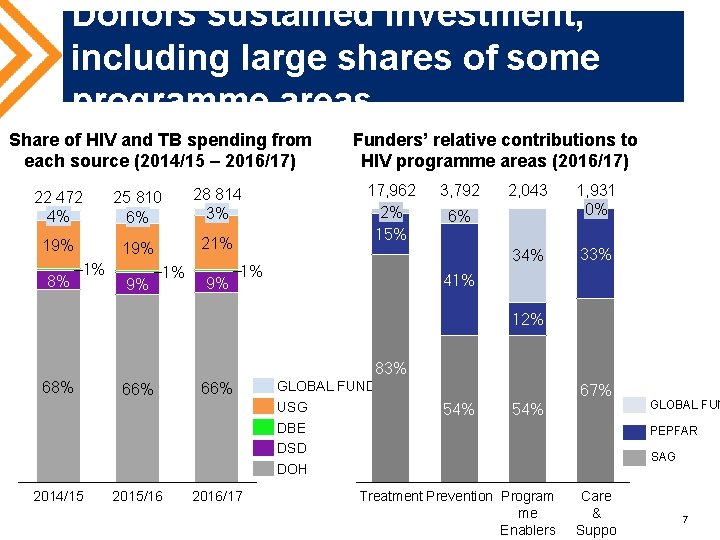
Donors sustained investment, including large shares of some programme areas Share of HIV and TB spending from each source (2014/15 – 2016/17) 22 472 4% 25 810 6% 28 814 3% 19% 21% 8% 1% 9% Funders’ relative contributions to HIV programme areas (2016/17) 17, 962 2% 15% 1% 3, 792 2, 043 1, 931 0% 34% 33% 6% 41% 12% 83% 68% 2014/15 66% 2015/16 66% 2016/17 GLOBAL FUND USG DBE DSD DOH 67% 54% Treatment Prevention Program me Enablers GLOBAL FUN PEPFAR SAG Care & Suppo 7
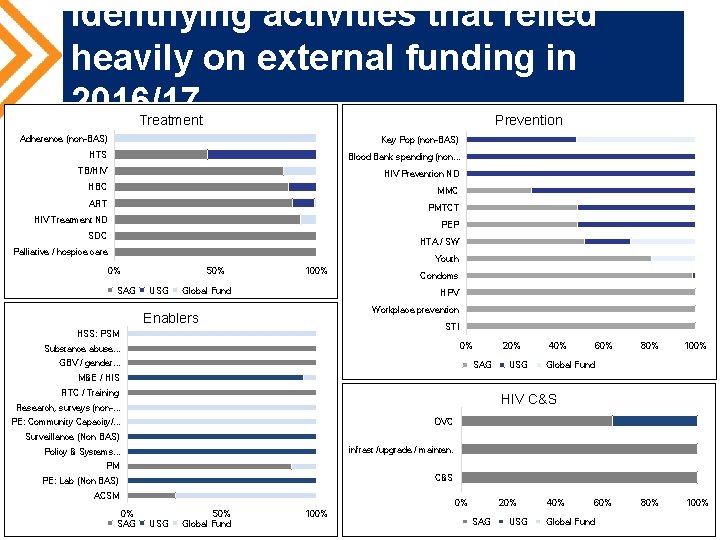
Identifying activities that relied heavily on external funding in 2016/17 Treatment Prevention Adherence (non-BAS) Key Pop (non-BAS) HTS Blood Bank spending (non. . . TB/HIV Prevention ND HBC MMC ART PMTCT HIV Treatment ND PEP SDC HTA / SW Palliative / hospice care Youth 0% SAG 50% USG 100% Global Fund Condoms HPV Workplace prevention Enablers STI HSS: PSM 0% Substance abuse. . . GBV / gender. . . SAG 20% USG 40% 60% 80% 100% Global Fund M&E / HIS RTC / Training HIV C&S Research, surveys (non-. . . OVC PE: Community Capacity/. . . Surveillance (Non BAS) infrast /upgrade / mainten. Policy & Systems. . . PM C&S PE: Lab (Non BAS) ACSM 0% SAG 0% USG 50% Global Fund 100% 20% SAG USG 40% 60% Global Fund 8
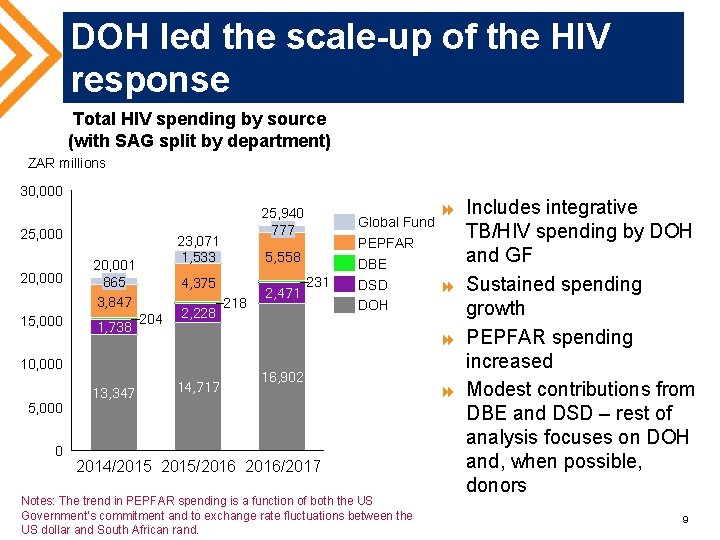
DOH led the scale-up of the HIV response Total HIV spending by source (with SAG split by department) ZAR millions 30, 000 25, 000 20, 000 15, 000 23, 071 1, 533 20, 001 865 3, 847 1, 738 5, 000 0 5, 558 4, 375 204 2, 228 10, 000 13, 347 25, 940 777 14, 717 218 2, 471 231 Global Fund PEPFAR DBE DSD DOH 16, 902 2014/2015/2016/2017 Notes: The trend in PEPFAR spending is a function of both the US Government’s commitment and to exchange rate fluctuations between the US dollar and South African rand. 8 Includes integrative TB/HIV spending by DOH and GF 8 Sustained spending growth 8 PEPFAR spending increased 8 Modest contributions from DBE and DSD – rest of analysis focuses on DOH and, when possible, donors 9
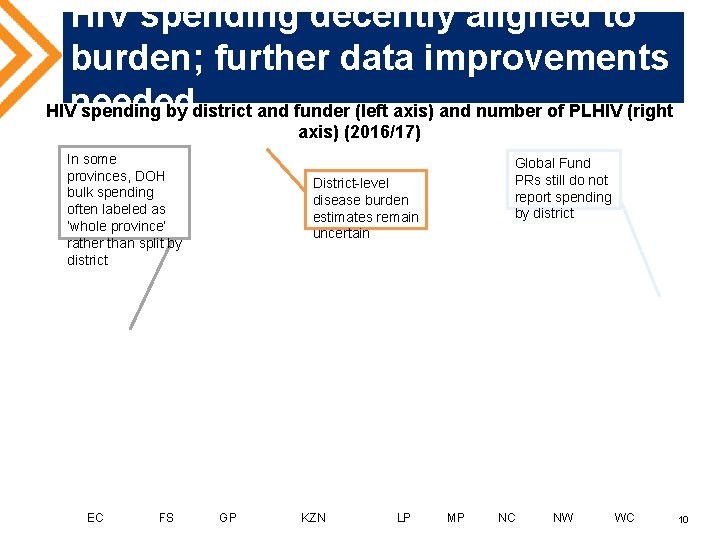
HIV spending decently aligned to burden; further data improvements HIVneeded spending by district and funder (left axis) and number of PLHIV (right axis) (2016/17) In some provinces, DOH bulk spending often labeled as ‘whole province’ rather than split by district EC FS Global Fund PRs still do not report spending by district District-level disease burden estimates remain uncertain GP KZN LP MP NC NW WC 10
PEPFAR spending (mostly) matched stated geographic priorities Change in DOH and PEPFAR spending in PEPFAR priority districts between 2015/16 and 2016/17 11
Government often (but not always) filled in where PEPFAR scaled down investment Change in DOH and PEPFAR spending in PEPFAR transition districts between 2015/16 and 2016/17 PEPFAR change in spending DOH change in spending 12
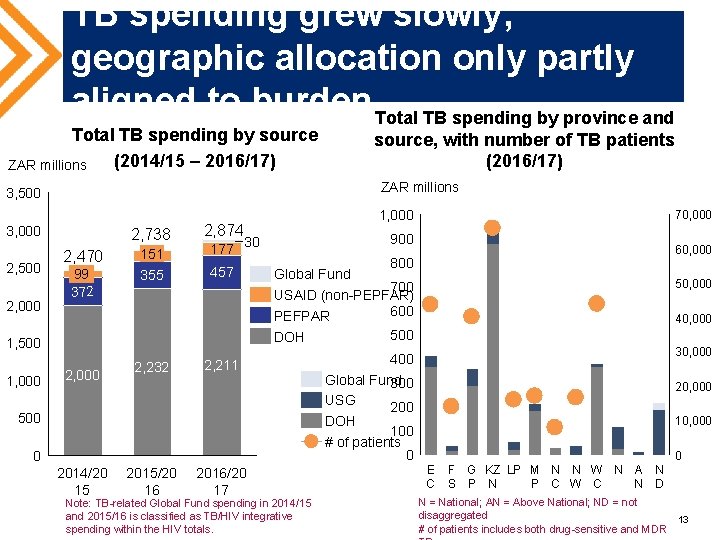
TB spending grew slowly; geographic allocation only partly aligned to burden Total TB spending by province and Total TB spending by source (2014/15 – 2016/17) ZAR millions 3, 500 3, 000 2, 500 2, 000 2, 738 2, 470 151 177 30 99 372 355 457 2, 000 2, 232 1, 000 2, 874 1, 500 1, 000 source, with number of TB patients (2016/17) 900 2, 211 0 2015/20 16 2016/20 17 60, 000 800 Global Fund 700 USAID (non-PEPFAR) 600 PEFPAR 500 DOH 500 2014/20 15 70, 000 Note: TB-related Global Fund spending in 2014/15 and 2015/16 is classified as TB/HIV integrative spending within the HIV totals. 400 Global Fund 300 USG 200 DOH 100 # of patients 0 50, 000 40, 000 30, 000 20, 000 10, 000 0 E C F G KZ LP M N N W N A N S P N P C W C N D N = National; AN = Above National; ND = not disaggregated 13 # of patients includes both drug-sensitive and MDR
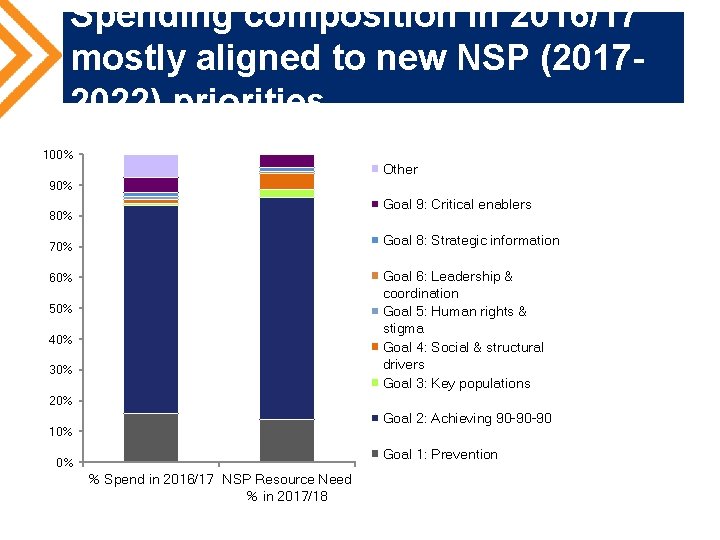
Spending composition in 2016/17 mostly aligned to new NSP (20172022) priorities 100% Other 90% Goal 9: Critical enablers 80% Goal 8: Strategic information 70% Goal 6: Leadership & coordination Goal 5: Human rights & stigma Goal 4: Social & structural drivers Goal 3: Key populations 60% 50% 40% 30% 20% Goal 2: Achieving 90 -90 -90 10% Goal 1: Prevention 0% % Spend in 2016/17 NSP Resource Need % in 2017/18
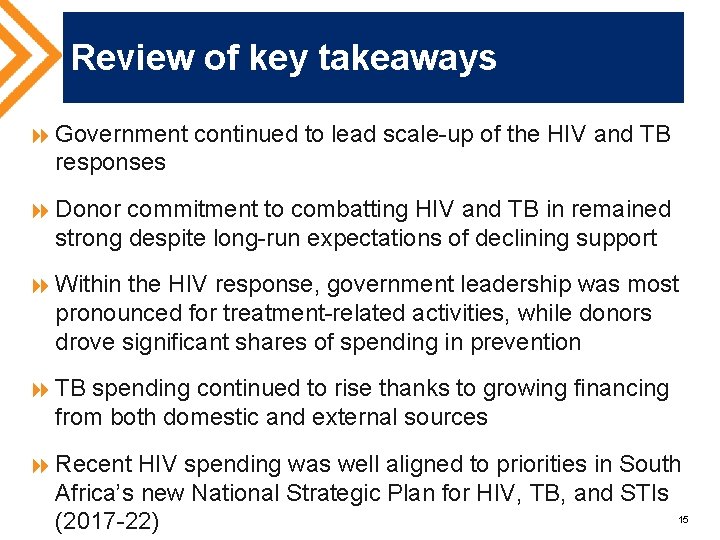
Review of key takeaways 8 Government continued to lead scale-up of the HIV and TB responses 8 Donor commitment to combatting HIV and TB in remained strong despite long-run expectations of declining support 8 Within the HIV response, government leadership was most pronounced for treatment-related activities, while donors drove significant shares of spending in prevention 8 TB spending continued to rise thanks to growing financing from both domestic and external sources 8 Recent HIV spending was well aligned to priorities in South Africa’s new National Strategic Plan for HIV, TB, and STIs 15 (2017 -22)
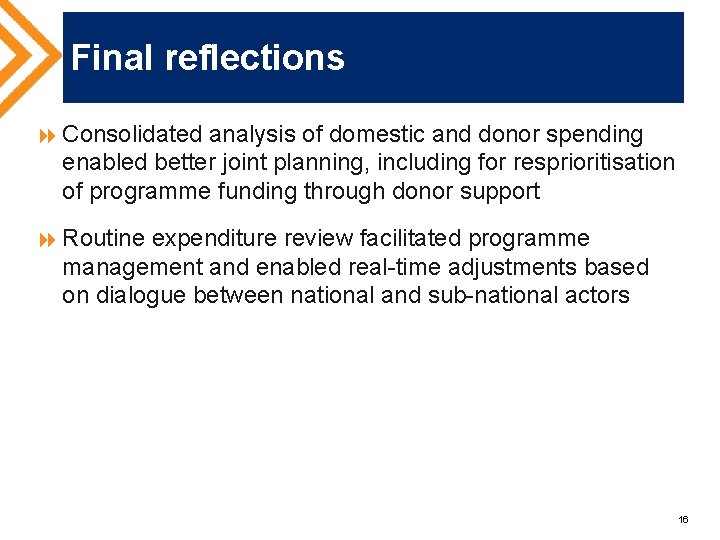
Final reflections 8 Consolidated analysis of domestic and donor spending enabled better joint planning, including for resprioritisation of programme funding through donor support 8 Routine expenditure review facilitated programme management and enabled real-time adjustments based on dialogue between national and sub-national actors 16
Thank you Contacts NDOH Nthabiseng Khoza – petrus. khoza@health. gov. za HFG Teresa Guthrie – guthriehealthfinancingconsult@gmail. com CEGAA Nhlanhla Ndlovu – nhla@cegaa. org 2 HE RO Gesine Meyer-Rath – gesine@bu. edu Abt Associates Inc. In collaboration with: Broad Branch Associates | Development Alternatives Inc. (DAI) | Futures Institute | Johns Hopkins Bloomberg School of Public Health (JHSPH) | Results for Development Institute (R 4 D) | RTI International | Training