Funding of RD 200607 200708 200809 200910 201011


 • Demographic drop-off For 2010 Number enrolled Number of graduates")
- Slides: 7
Funding of R&D 2006/07 2007/08 2008/09 2009/10 2010/11 16. 521 18. 624 21. 041 20. 955 20. 254 GERD (% of GDP) 0. 95 0. 93 0. 92 0. 87 0. 76 Public sector R&D spend 7. 065 7. 662 8. 468 9. 629 10. 032 9. 243 10. 738 12. 332 11. 139 10. 059 0. 21 0. 18 0. 14 0. 12 42. 8 41. 1 40. 2 45. 9 49. 6 55. 9 57. 7 58. 6 53. 2 49. 7 GERD (Rb) Private sector R&D spend (Rb) (including SOE) Public sector R&D spend (% of government budget) Public sector R&D spend (% of GERD) Private sector R&D spend (% of GERD)*
Human capital provision Headcount of R&D 2006/07 2007/08 2008/09 2009/10 2010/11 58 706 59 334 58 895 59 494 55 531 6 973 7 756 8 143 8 498 7 456 5 998 6 686 6 729 7 305 6 561 942 1 032 1 368 1 143 839 39. 7 40. 3 39. 7 40. 8 42 1. 5 1. 4 personnel Researchers (headcount of Ph. Ds) Public sector researchers (headcount of Ph. Ds) Private sector researchers (headcount of Ph. Ds) Female researchers (% of all researchers)# Total FTE researchers per 1000 employees
Research output 14000 12311 12000 11167 1006510085 9199 10000 8323 8000 6000 7121 5645 5378 5118 5101 5137 4948 5074 5166 5994 6280 4000 2000 0 1996 1997 1998 1999 2000 2001 2002 2003 2004 2005 2006 2007 2008 2009 2010 2011 2012
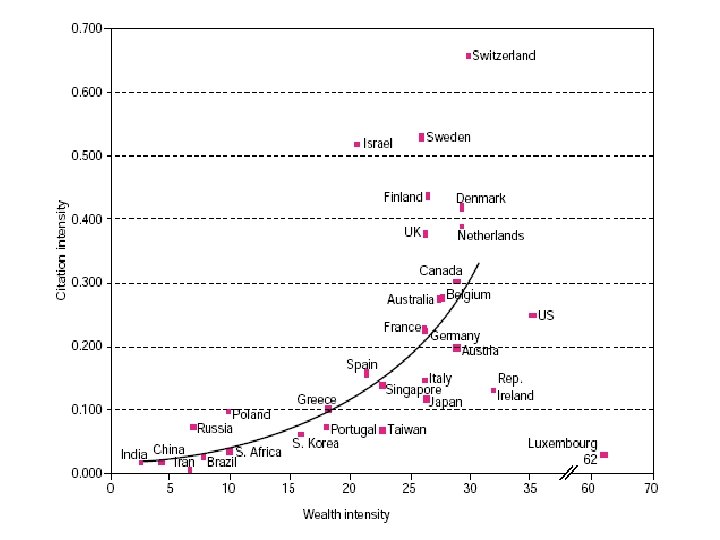
Impact of research output
Ph. D grads / million population 35 30 25 20 15 10 5 0 2002/03 2003/04 2004/05 2005/06 2006/07 2007/08 2008/09 2009/10 2010/11 2011/12 2012/13 Series 1 21, 69 22, 8 23, 61 25, 14 22, 99 26, 32 24, 15 27, 89 28, 42 31, 15 32, 56
High-level HCD challenges (2) • Demographic drop-off For 2010 Number enrolled Number of graduates % of black enrolled % of female enrolled U/B 440 000 61 000 73 57 H 57 000 20 500 79 63 M 46 000 4 600 65 48 D 11 600 1 400 58 42 U/B H M D Number enrolled 781 711 85 500 49 560 13 965 Number of graduates 120 394 33 284 10 331 1 878 % of black enrolled 83 78 66 60 % of female enrolled 58 63 48 43 For 2012 Presentation www. dst. gov. za 7