
Fundamentals of Investing An Introduction to Public REITS

Fundamentals of Investing: An Introduction to Public REITS Tom Budinger adelante Capital Sunday, November 25, 2018 Adelante Capital Management LLC 555 12 th Street, Suite 2100 Oakland, CA 94607 Tel: (510) 986 -2100 Fax: (510) 268 -0663 www. adelante. com
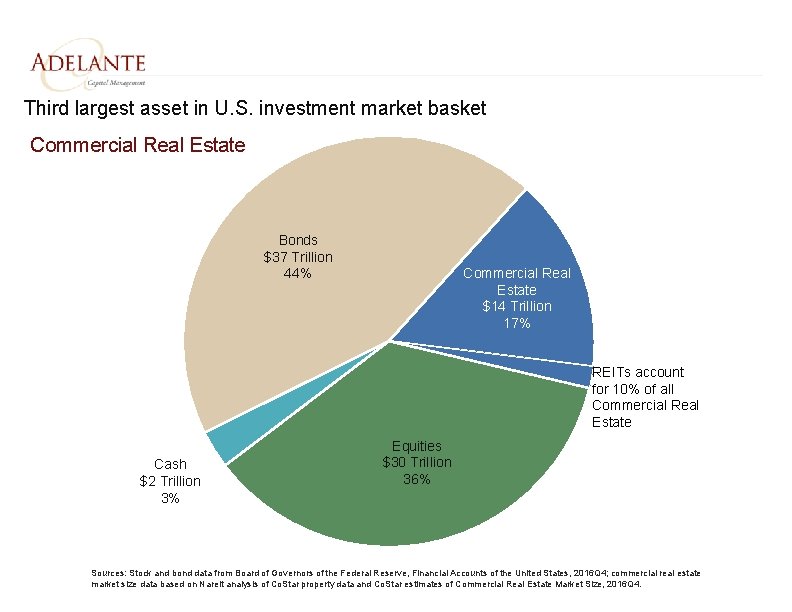
Third largest asset in U. S. investment market basket Commercial Real Estate Bonds $37 Trillion 44% Commercial Real Estate $14 Trillion 17% REITs account for 10% of all Commercial Real Estate Cash $2 Trillion 3% Equities $30 Trillion 36% Sources: Stock and bond data from Board of Governors of the Federal Reserve, Financial Accounts of the United States, 2016 Q 4; commercial real estate market size data based on Nareit analysis of Co. Star property data and Co. Star estimates of Commercial Real Estate Market Size, 2016 Q 4.
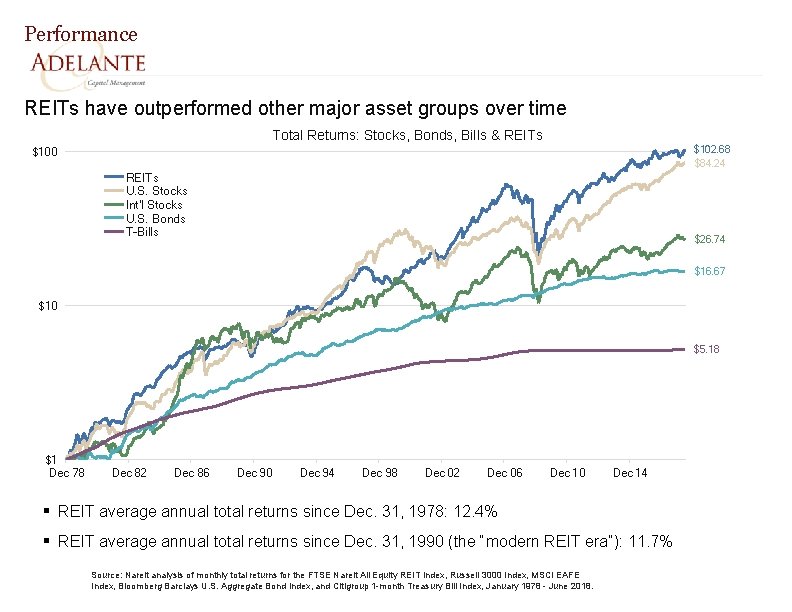
Performance REITs have outperformed other major asset groups over time Total Returns: Stocks, Bonds, Bills & REITs $102. 68 $84. 24 $100 REITs U. S. Stocks Int'l Stocks U. S. Bonds T-Bills $26. 74 $16. 67 $10 $5. 18 $1 Dec 78 ▪ ▪ Dec 82 Dec 86 Dec 90 Dec 94 Dec 98 Dec 02 Dec 06 Dec 10 Dec 14 REIT average annual total returns since Dec. 31, 1978: 12. 4% REIT average annual total returns since Dec. 31, 1990 (the “modern REIT era”): 11. 7% Source: Nareit analysis of monthly total returns for the FTSE Nareit All Equity REIT Index, Russell 3000 Index, MSCI EAFE Index, Bloomberg Barclays U. S. Aggregate Bond Index, and Citigroup 1 -month Treasury Bill Index, January 1978 - June 2018.
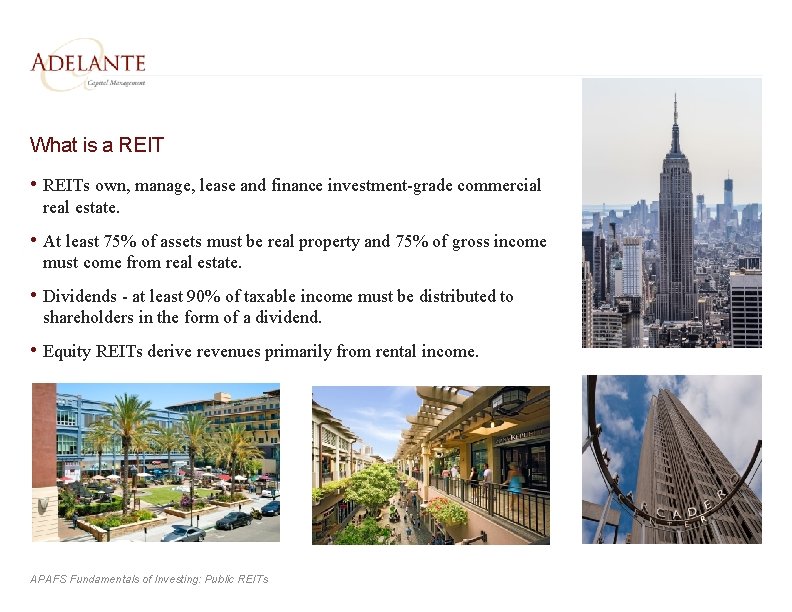
What is a REIT • REITs own, manage, lease and finance investment-grade commercial real estate. • At least 75% of assets must be real property and 75% of gross income must come from real estate. • Dividends - at least 90% of taxable income must be distributed to shareholders in the form of a dividend. • Equity REITs derive revenues primarily from rental income. APAFS Fundamentals of Investing: Public REITs
REITs First Authorized in the U. S. in 1960 • Provide disciplined, market-based financing of real estate through liquid, transparent public markets • Increase equity and reduce debt in the financing of real estate to make the industry more stable • Provide all citizens with access to real estate investment to help build financial security, manage wealth and save for retirement • Provide a means for investing in real estate in the same manner investors typically invest in other industries through listed corporate equities
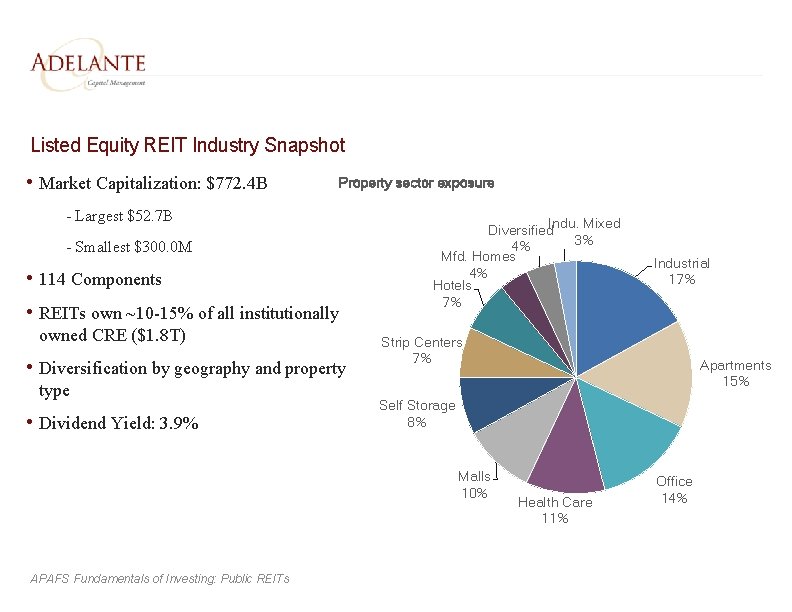
Listed Equity REIT Industry Snapshot • Market Capitalization: $772. 4 B Property sector exposure - Largest $52. 7 B - Smallest $300. 0 M • 114 Components • REITs own ~10 -15% of all institutionally owned CRE ($1. 8 T) • Diversification by geography and property type • Dividend Yield: 3. 9% Diversified. Indu. Mixed 3% 4% Mfd. Homes 4% Hotels 7% Strip Centers 7% Apartments 15% Self Storage 8% Malls 10% APAFS Fundamentals of Investing: Public REITs Industrial 17% Health Care 11% Office 14%
Listed Equity REIT Advantages • Efficient access to commercial real estate • Attractive relative long-term investment performance • Source of dividend income • Transparency and simplicity • Diversification benefits • Liquidity • Strong, investor-aligned corporate governance • Inflation hedge (real assets) APAFS Fundamentals of Investing: Public REITs
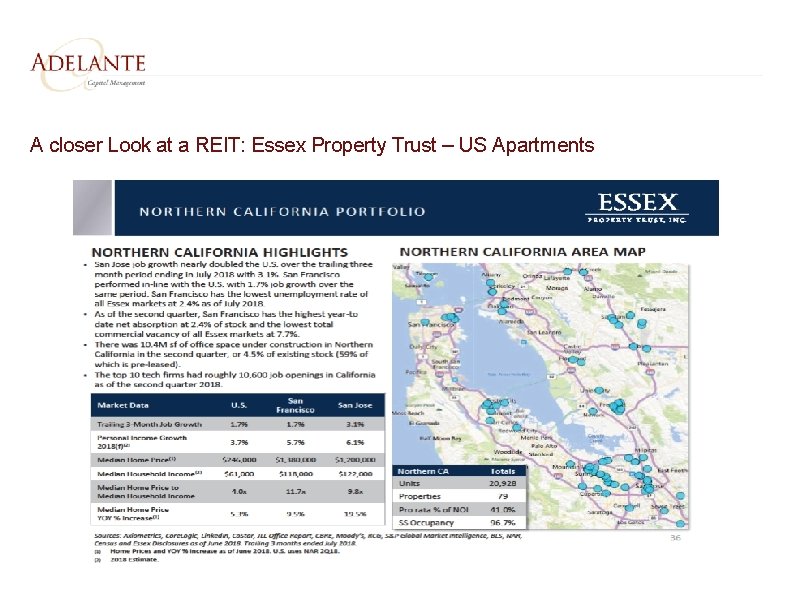
A closer Look at a REIT: Essex Property Trust – US Apartments
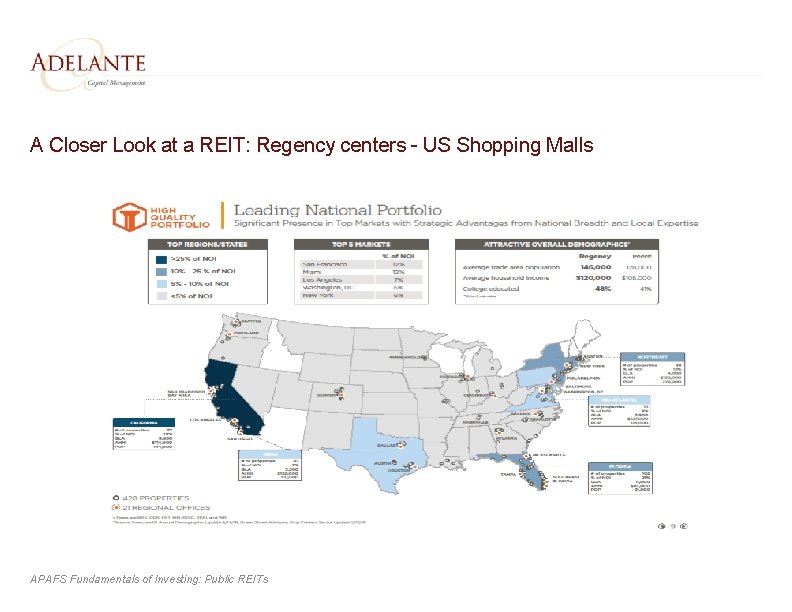
A Closer Look at a REIT: Regency centers - US Shopping Malls APAFS Fundamentals of Investing: Public REITs
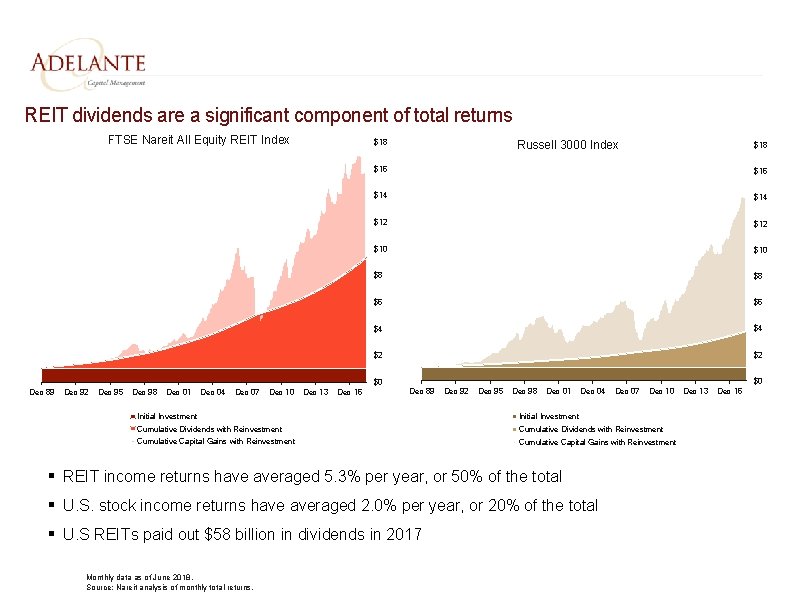
REIT dividends are a significant component of total returns FTSE Nareit All Equity REIT Index $18 ▪ ▪ ▪ Dec 92 Dec 95 Dec 98 Dec 01 Dec 04 Dec 07 Dec 10 Dec 13 Dec 16 $18 $16 $14 $12 $10 $8 $8 $6 $6 $4 $4 $2 $2 $0 Dec 89 Russell 3000 Index $0 Dec 89 Dec 92 Dec 95 Dec 98 Dec 01 Dec 04 Dec 07 Dec 10 Initial Investment Cumulative Dividends with Reinvestment Cumulative Capital Gains with Reinvestment REIT income returns have averaged 5. 3% per year, or 50% of the total U. S. stock income returns have averaged 2. 0% per year, or 20% of the total U. S REITs paid out $58 billion in dividends in 2017 Monthly data as of June 2018. Source: Nareit analysis of monthly total returns. Dec 13 Dec 16
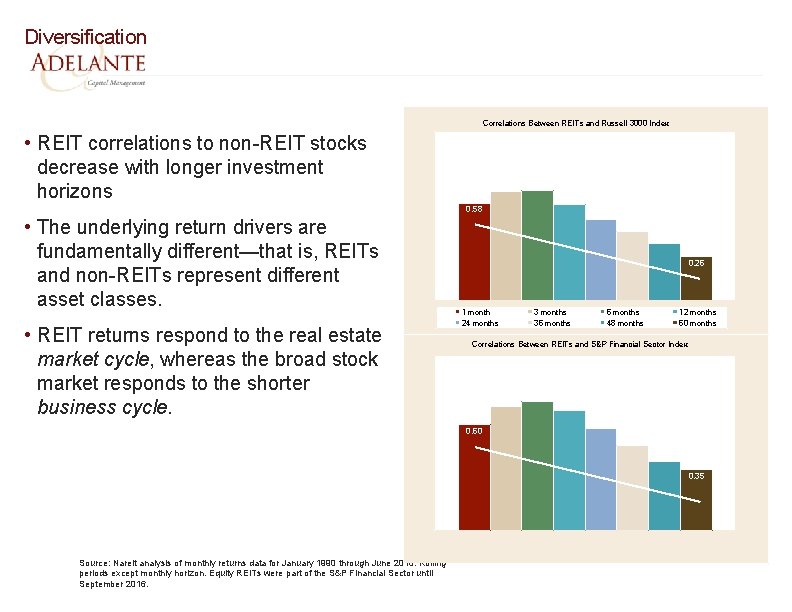
Diversification Correlations Between REITs and Russell 3000 Index • REIT correlations to non-REIT stocks decrease with longer investment horizons • The underlying return drivers are fundamentally different—that is, REITs and non-REITs represent different asset classes. • REIT returns respond to the real estate market cycle, whereas the broad stock market responds to the shorter business cycle. 0. 58 0. 26 1 month 24 months 36 months 48 months 12 months 60 months Correlations Between REITs and S&P Financial Sector Index 0. 60 0. 35 Source: Nareit analysis of monthly returns data for January 1990 through June 2018. Rolling periods except monthly horizon. Equity REITs were part of the S&P Financial Sector until September 2016.
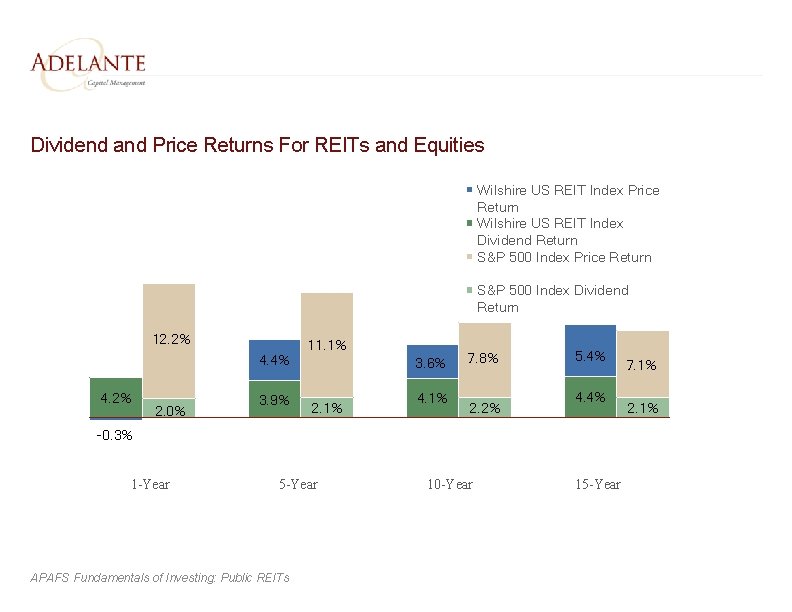
Dividend and Price Returns For REITs and Equities Wilshire US REIT Index Price Return Wilshire US REIT Index Dividend Return S&P 500 Index Price Return S&P 500 Index Dividend Return 12. 2% 4. 4% 4. 2% 2. 0% 3. 9% 11. 1% 3. 6% 2. 1% 4. 1% 7. 8% 2. 2% 5. 4% 4. 4% -0. 3% 1 -Year 5 -Year APAFS Fundamentals of Investing: Public REITs 10 -Year 15 -Year 7. 1% 2. 1%
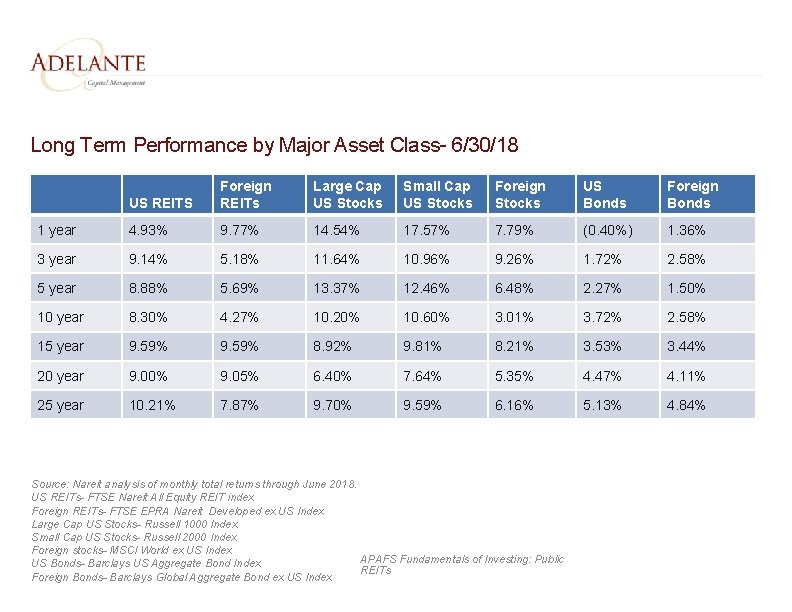
Long Term Performance by Major Asset Class- 6/30/18 US REITS Foreign REITs Large Cap US Stocks Small Cap US Stocks Foreign Stocks US Bonds Foreign Bonds 1 year 4. 93% 9. 77% 14. 54% 17. 57% 7. 79% (0. 40%) 1. 36% 3 year 9. 14% 5. 18% 11. 64% 10. 96% 9. 26% 1. 72% 2. 58% 5 year 8. 88% 5. 69% 13. 37% 12. 46% 6. 48% 2. 27% 1. 50% 10 year 8. 30% 4. 27% 10. 20% 10. 60% 3. 01% 3. 72% 2. 58% 15 year 9. 59% 8. 92% 9. 81% 8. 21% 3. 53% 3. 44% 20 year 9. 00% 9. 05% 6. 40% 7. 64% 5. 35% 4. 47% 4. 11% 25 year 10. 21% 7. 87% 9. 70% 9. 59% 6. 16% 5. 13% 4. 84% Source: Nareit analysis of monthly total returns through June 2018. US REITs- FTSE Nareit All Equity REIT index Foreign REITs- FTSE EPRA Nareit Developed ex US Index Large Cap US Stocks- Russell 1000 Index Small Cap US Stocks- Russell 2000 Index Foreign stocks- MSCI World ex US Index APAFS Fundamentals of Investing: Public US Bonds- Barclays US Aggregate Bond Index REITs Foreign Bonds- Barclays Global Aggregate Bond ex US Index
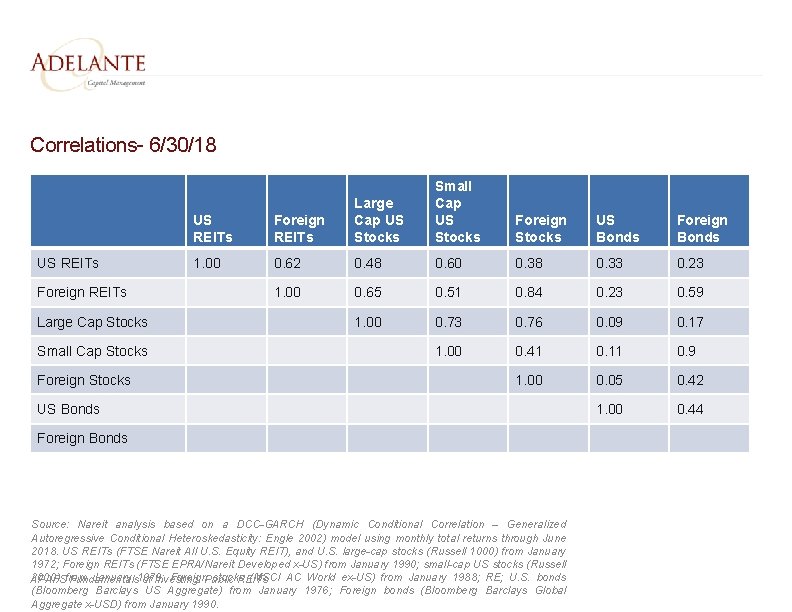
Correlations- 6/30/18 US REITs Foreign REITs Large Cap Stocks Small Cap Stocks Foreign Stocks Small Cap US Stocks Foreign Stocks US Bonds Foreign Bonds US REITs Foreign REITs Large Cap US Stocks 1. 00 0. 62 0. 48 0. 60 0. 38 0. 33 0. 23 1. 00 0. 65 0. 51 0. 84 0. 23 0. 59 1. 00 0. 73 0. 76 0. 09 0. 17 1. 00 0. 41 0. 11 0. 9 1. 00 0. 05 0. 42 1. 00 0. 44 US Bonds Foreign Bonds Source: Nareit analysis based on a DCC-GARCH (Dynamic Conditional Correlation – Generalized Autoregressive Conditional Heteroskedasticity: Engle 2002) model using monthly total returns through June 2018. US REITs (FTSE Nareit All U. S. Equity REIT), and U. S. large-cap stocks (Russell 1000) from January 1972; Foreign REITs (FTSE EPRA/Nareit Developed x-US) from January 1990; small-cap US stocks (Russell 2000) from January 1979; Foreign stocks (MSCI AC World ex-US) from January 1988; RE; U. S. bonds APAFS Fundamentals of Investing: Public REITs (Bloomberg Barclays US Aggregate) from January 1976; Foreign bonds (Bloomberg Barclays Global Aggregate x-USD) from January 1990.
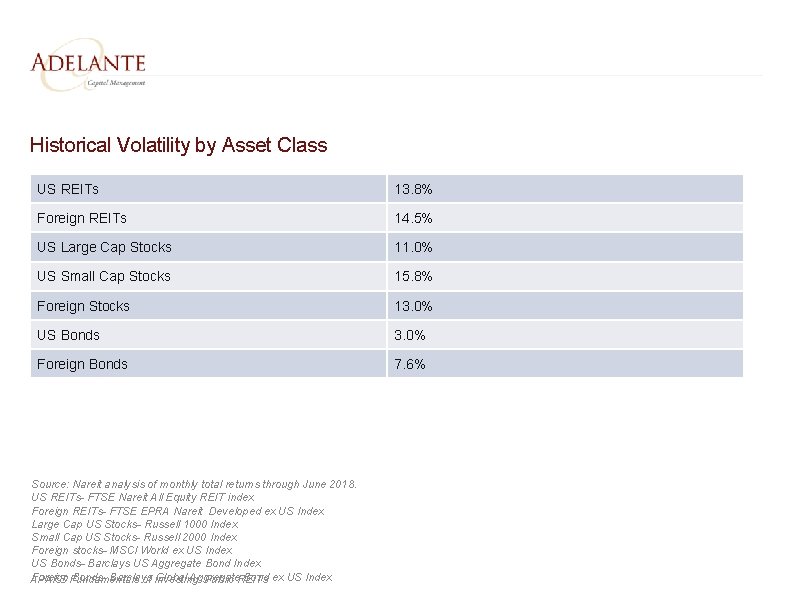
Historical Volatility by Asset Class US REITs 13. 8% Foreign REITs 14. 5% US Large Cap Stocks 11. 0% US Small Cap Stocks 15. 8% Foreign Stocks 13. 0% US Bonds 3. 0% Foreign Bonds 7. 6% Source: Nareit analysis of monthly total returns through June 2018. US REITs- FTSE Nareit All Equity REIT index Foreign REITs- FTSE EPRA Nareit Developed ex US Index Large Cap US Stocks- Russell 1000 Index Small Cap US Stocks- Russell 2000 Index Foreign stocks- MSCI World ex US Index US Bonds- Barclays US Aggregate Bond Index Foreign Bonds- Barclays Global Aggregate Bond ex US Index APAFS Fundamentals of Investing: Public REITs
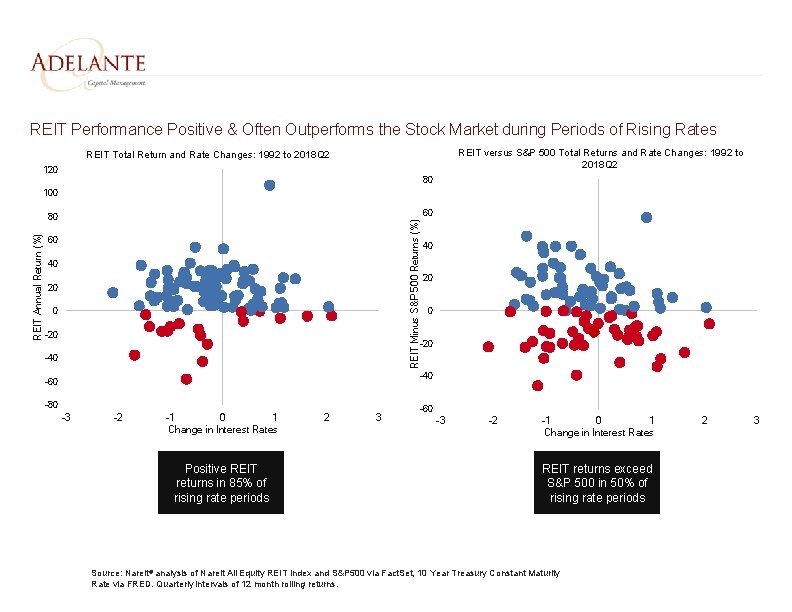
REIT Performance Positive & Often Outperforms the Stock Market during Periods of Rising Rates REIT versus S&P 500 Total Returns and Rate Changes: 1992 to 2018 Q 2 REIT Total Return and Rate Changes: 1992 to 2018 Q 2 120 80 100 60 REIT Minus S&P 500 Returns (%) REIT Annual Return (%) 80 60 40 20 0 -20 -40 -60 -80 -3 -2 -1 0 1 Change in Interest Rates Positive REIT returns in 85% of rising rate periods 2 3 -60 -3 -2 -1 0 1 Change in Interest Rates REIT returns exceed S&P 500 in 50% of rising rate periods Source: Nareit® analysis of Nareit All Equity REIT Index and S&P 500 via Fact. Set, 10 Year Treasury Constant Maturity Rate via FRED. Quarterly intervals of 12 month rolling returns. 2 3
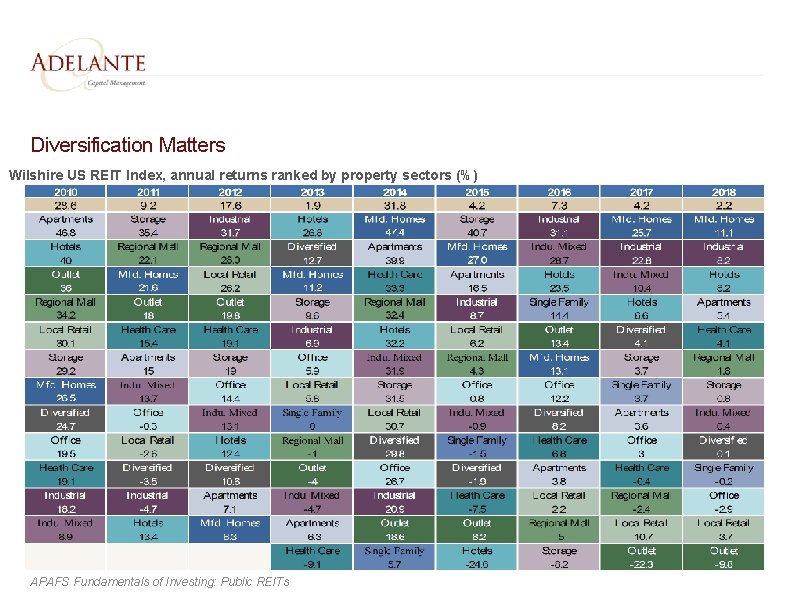
Diversification Matters Wilshire US REIT Index, annual returns ranked by property sectors (%) APAFS Fundamentals of Investing: Public REITs
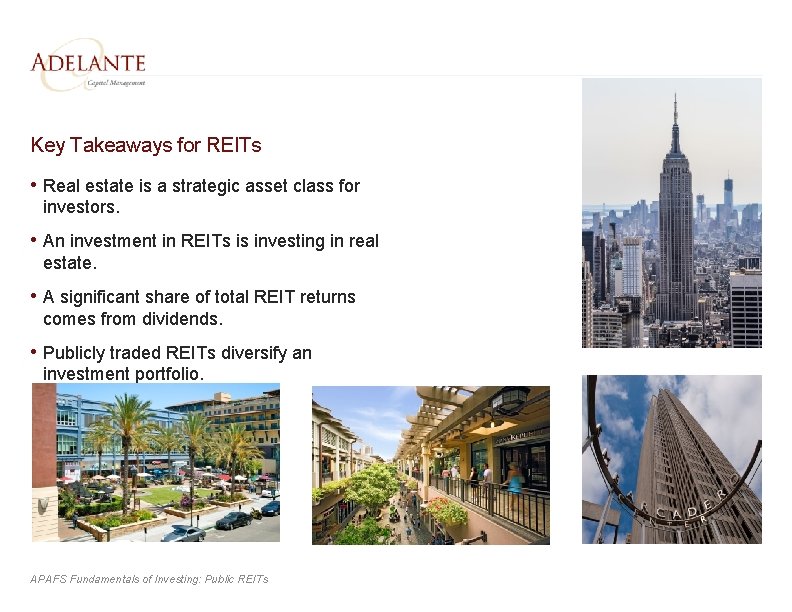
Key Takeaways for REITs • Real estate is a strategic asset class for investors. • An investment in REITs is investing in real estate. • A significant share of total REIT returns comes from dividends. • Publicly traded REITs diversify an investment portfolio. APAFS Fundamentals of Investing: Public REITs
Appendix
Our Themes & Risks for 2018 Themes • Unintended consequences – durability of property cash flows overlooked. • NEXTGen sectors – secular growth not experiencing new supply pressures. • Retail re-alignment – despite record store closings, tenant demand remains targeted. • Higher home prices – new supply has tempered apartment rent growth, yet reduced inventory driving prices higher. • Flat yield curve – unanticipated inflation has yet to drive long rates higher. • Amazon HQ 2 – the jury is still out on the true benefits for the winner. Risks • Dividend yields – too low and total return expectations not compelling for ‘why now’ investors. • Growth bias persists – benefits from reduced regulations and repatriation propels growth over value. • Fed transition - communication, interpretation and reaction. • Fewer property transactions – ‘wait and see’ & ‘bid-ask spread’ debates emerge. APAFS Fundamentals of Investing: Public REITs • SALT limitations – does sentiment turn to migration from high tax jurisdictions?
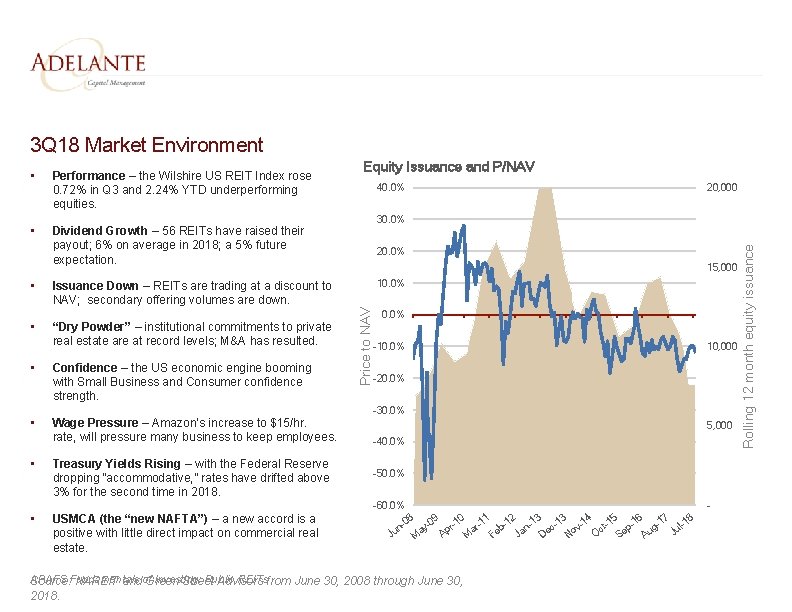
3 Q 18 Market Environment • Dividend Growth – 56 REITs have raised their payout; 6% on average in 2018; a 5% future expectation. • Issuance Down – REITs are trading at a discount to NAV; secondary offering volumes are down. • “Dry Powder” – institutional commitments to private real estate are at record levels; M&A has resulted. • Confidence – the US economic engine booming with Small Business and Consumer confidence strength. • Wage Pressure – Amazon’s increase to $15/hr. rate, will pressure many business to keep employees. Equity Issuance and P/NAV 40. 0% 20, 000 30. 0% 20. 0% 15, 000 10. 0% -10. 0% 10, 000 -20. 0% -30. 0% • Treasury Yields Rising – with the Federal Reserve dropping “accommodative, ” rates have drifted above 3% for the second time in 2018. • USMCA (the “new NAFTA”) – a new accord is a positive with little direct impact on commercial real estate. 5, 000 -40. 0% -50. 0% -60. 0% 08 09 r-10 r-11 -12 -13 -14 t-15 -16 -17 l-18 v c p g n- ayn b u Ju Ap Ma Oc Se J Ja Fe Au No De M APAFS Fundamentals of Investing: Public REITs Source: NAREIT and Green Street Advisors from June 30, 2008 through June 30, 2018. - Rolling 12 month equity issuance Performance – the Wilshire US REIT Index rose 0. 72% in Q 3 and 2. 24% YTD underperforming equities. Price to NAV •
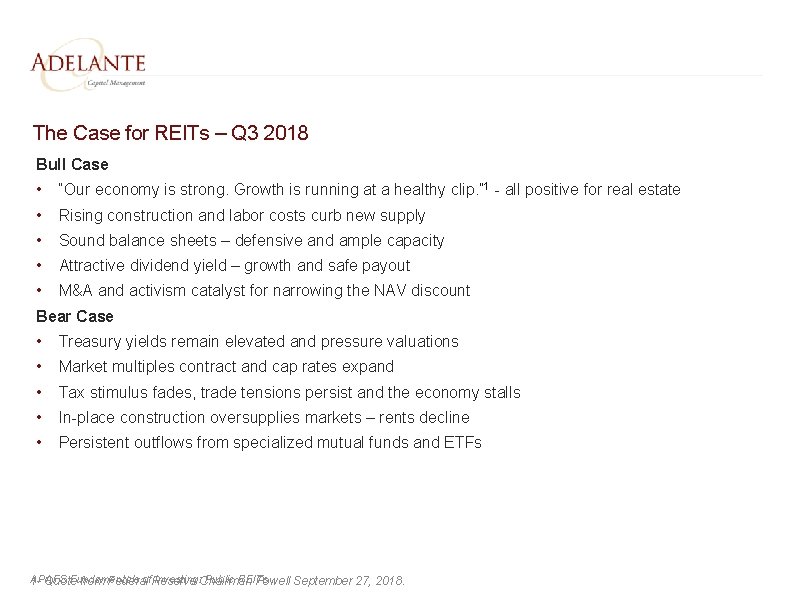
The Case for REITs – Q 3 2018 Bull Case • • • “Our economy is strong. Growth is running at a healthy clip. ” 1 - all positive for real estate Rising construction and labor costs curb new supply Sound balance sheets – defensive and ample capacity Attractive dividend yield – growth and safe payout M&A and activism catalyst for narrowing the NAV discount Bear Case • • • Treasury yields remain elevated and pressure valuations Market multiples contract and cap rates expand Tax stimulus fades, trade tensions persist and the economy stalls In-place construction oversupplies markets – rents decline Persistent outflows from specialized mutual funds and ETFs APAFS Fundamentals of Investing: Public REITs 1 - Quote from Federal Reserve Chairman Powell September 27, 2018.
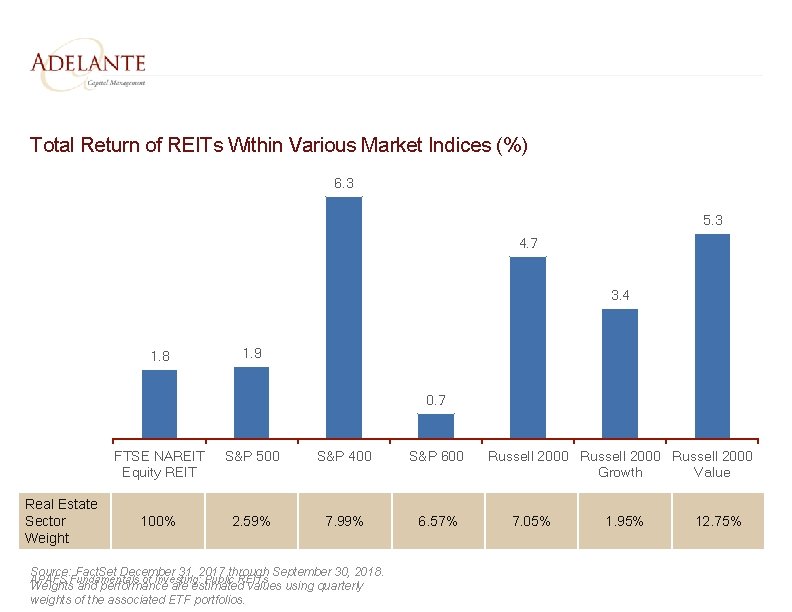
Total Return of REITs Within Various Market Indices (%) 6. 3 5. 3 4. 7 3. 4 1. 8 1. 9 0. 7 Real Estate Sector Weight FTSE NAREIT Equity REIT S&P 500 S&P 400 S&P 600 100% 2. 59% 7. 99% 6. 57% Source: Fact. Set December 31, 2017 through September 30, 2018. APAFS Fundamentals of Investing: Public REITs Weights and performance are estimated values using quarterly weights of the associated ETF portfolios. Russell 2000 Growth Value 7. 05% 1. 95% 12. 75%
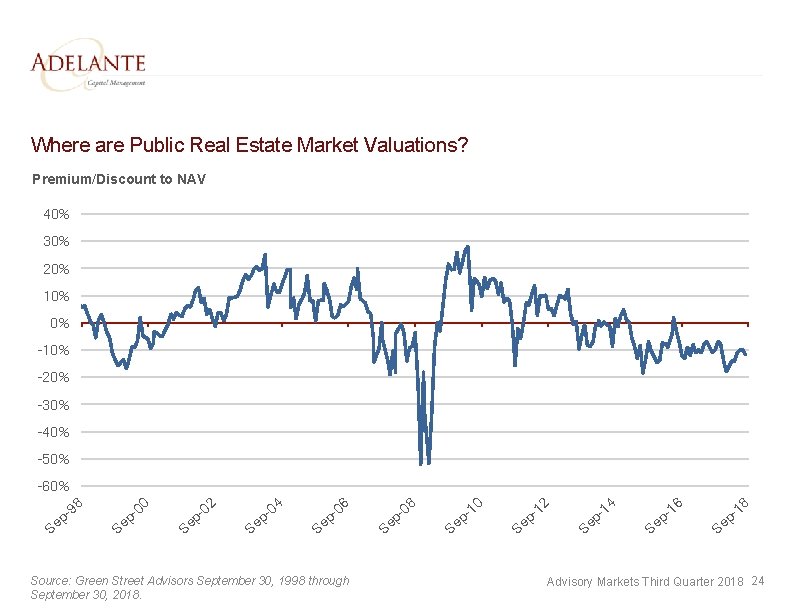
Where are Public Real Estate Market Valuations? Premium/Discount to NAV 40% 30% 20% 10% 0% -10% -20% -30% -40% -50% -60% 98 ep S S 0 -0 p e 02 pe S 04 S ep 06 ep S Source: Green Street Advisors September 30, 1998 through September 30, 2018. 08 S ep 12 10 S ep 14 S ep 16 ep 18 S Advisory Markets Third Quarter 2018 24
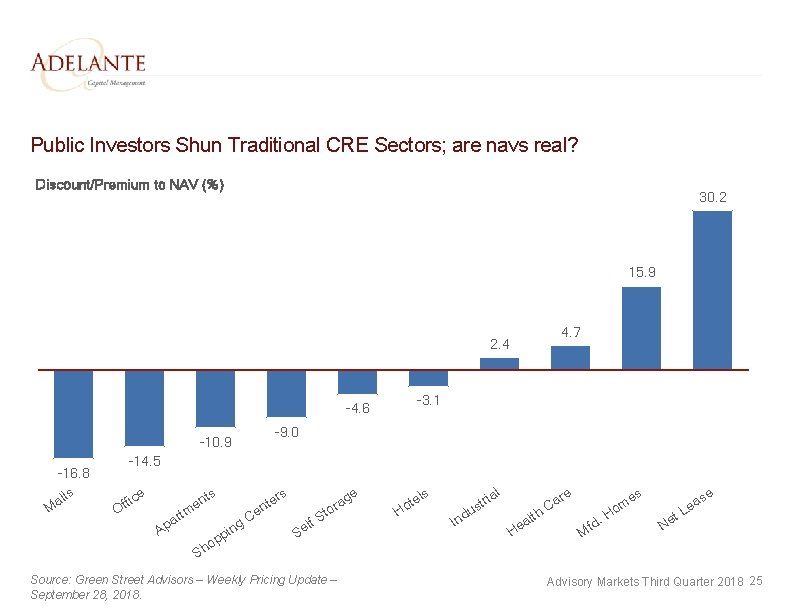
Public Investors Shun Traditional CRE Sectors; are navs real? Discount/Premium to NAV (%) 30. 2 15. 9 4. 7 2. 4 -4. 6 -10. 9 -16. 8 lls a M -3. 1 -9. 0 -14. 5 e fic f O ts en tr m a Ap p ing p ho rs e t n Ce e ag r to S elf S s tel o H ial str u Ind s re a He lt a h. C d. Mf H e om se t Ne a Le S Source: Green Street Advisors – Weekly Pricing Update – September 28, 2018. Advisory Markets Third Quarter 2018 25
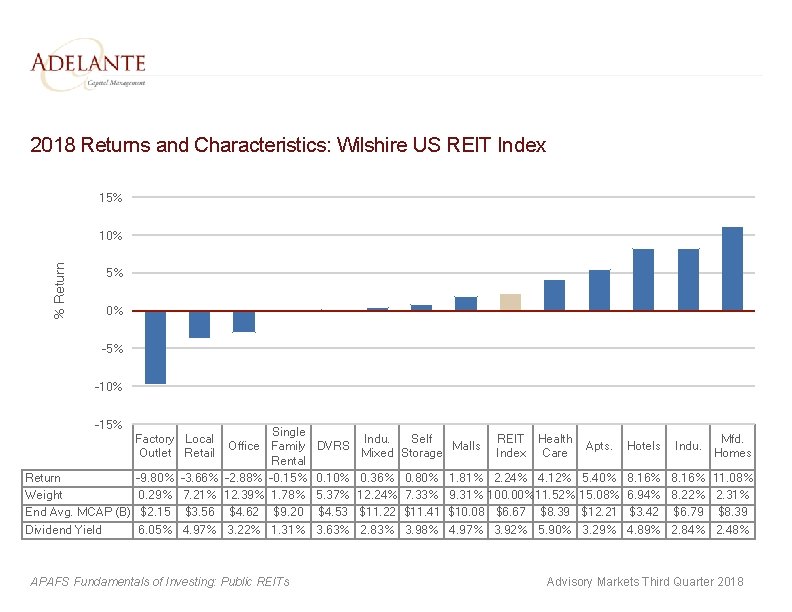
2018 Returns and Characteristics: Wilshire US REIT Index 15% % Return 10% 5% 0% -5% -10% -15% Factory Local Outlet Retail Return Weight End Avg. MCAP (B) Dividend Yield -9. 80% 0. 29% $2. 15 6. 05% -3. 66% 7. 21% $3. 56 4. 97% Office -2. 88% 12. 39% $4. 62 3. 22% Single Family Rental -0. 15% 1. 78% $9. 20 1. 31% APAFS Fundamentals of Investing: Public REITs DVRS 0. 10% 5. 37% $4. 53 3. 63% Indu. Self Malls Mixed Storage 0. 36% 12. 24% $11. 22 2. 83% 0. 80% 7. 33% $11. 41 3. 98% REIT Index Health Care 1. 81% 2. 24% 4. 12% 9. 31% 100. 00%11. 52% $10. 08 $6. 67 $8. 39 4. 97% 3. 92% 5. 90% Apts. 5. 40% 15. 08% $12. 21 3. 29% Hotels Indu. Mfd. Homes 8. 16% 11. 08% 6. 94% 8. 22% 2. 31% $3. 42 $6. 79 $8. 39 4. 89% 2. 84% 2. 48% Advisory Markets Third Quarter 2018
Adelante Capital Management

Distinguishing Characteristics • Investment manager specializing in real estate securities: $1. 8 billion of assets under management. • Value investor – investing based on NAV: – Real estate assets are the key drivers of company performance. – Objective, on-site property research discerns the value of real estate assets. – Comparison of stock price to real estate value is the best way to determine return opportunities for individual companies. • Information edge through: – Property-centric research by sector experts. – Meaningful, long-term relationships with company management – invest like a partner. • High conviction portfolios with concentrated holdings and low turnover. APAFS Fundamentals of Investing: Public REITs
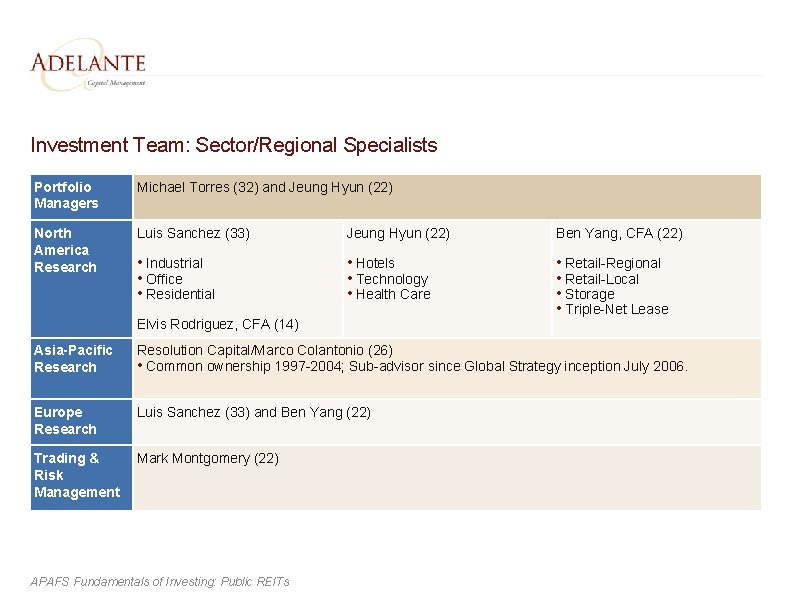
Investment Team: Sector/Regional Specialists Portfolio Managers Michael Torres (32) and Jeung Hyun (22) North America Research Luis Sanchez (33) Jeung Hyun (22) Ben Yang, CFA (22) • Industrial • Office • Residential • Hotels • Technology • Health Care • Retail-Regional • Retail-Local • Storage • Triple-Net Lease Elvis Rodriguez, CFA (14) Asia-Pacific Research Resolution Capital/Marco Colantonio (26) • Common ownership 1997 -2004; Sub-advisor since Global Strategy inception July 2006. Europe Research Luis Sanchez (33) and Ben Yang (22) Trading & Risk Management Mark Montgomery (22) APAFS Fundamentals of Investing: Public REITs
Our Characteristics Create Positive Results • Value Investor – NAV approach. • Repeatable Alpha – disciplined investment process. • Concentrated Portfolios with Low Turnover – long-term investment horizon and high conviction in our portfolio holdings. • Flexibility – firm and strategy sizes allow investment across market capitalization in search of value. APAFS Fundamentals of Investing: Public REITs

Thank You
- Slides: 31