
Fundamentals of Corporate Finance Chapter 17 Short Term

- Slides: 62
Fundamentals of Corporate Finance Chapter 17 Short Term Financial Planning and Management
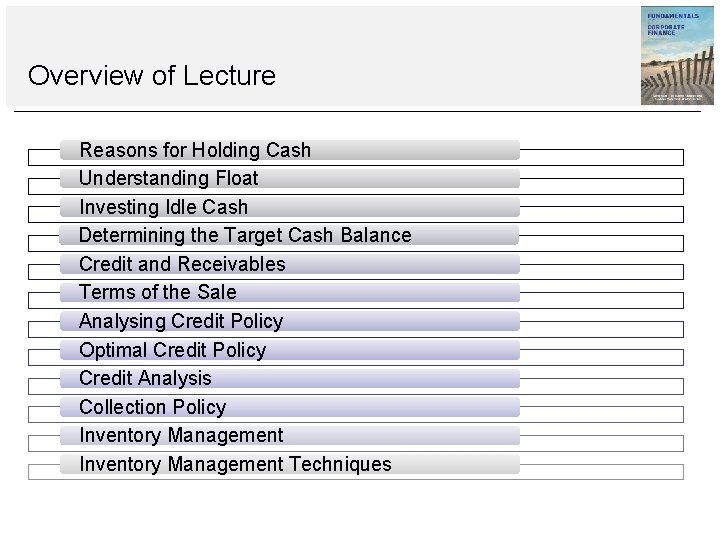
Overview of Lecture Reasons for Holding Cash Understanding Float Investing Idle Cash Determining the Target Cash Balance Credit and Receivables Terms of the Sale Analysing Credit Policy Optimal Credit Policy Credit Analysis Collection Policy Inventory Management Techniques
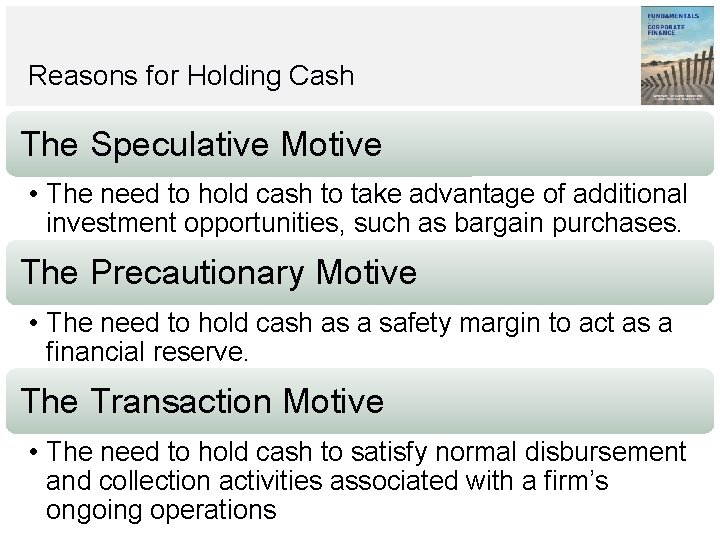
Reasons for Holding Cash The Speculative Motive • The need to hold cash to take advantage of additional investment opportunities, such as bargain purchases. The Precautionary Motive • The need to hold cash as a safety margin to act as a financial reserve. The Transaction Motive • The need to hold cash to satisfy normal disbursement and collection activities associated with a firm’s ongoing operations
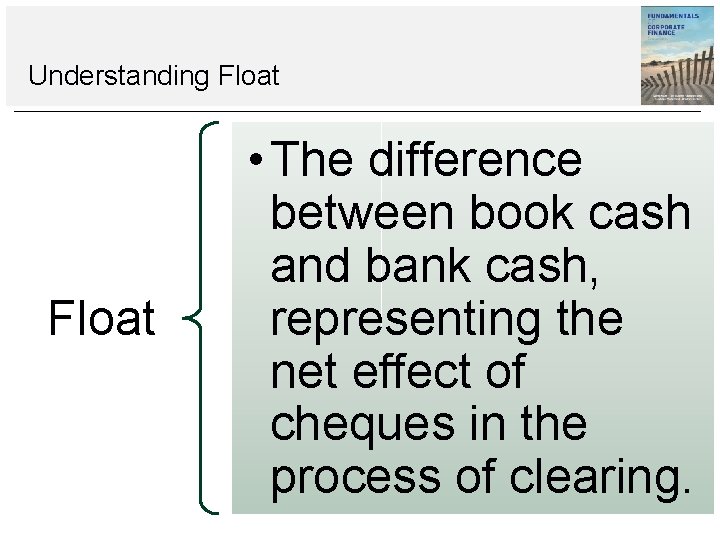
Understanding Float • The difference between book cash and bank cash, representing the net effect of cheques in the process of clearing.
Disbursement Float Cheques written by a firm generate disbursement float, causing a decrease in the firm’s book balance but no change in its available balance. Cheques received by the firm create collection float. Collection float increases book balances but does not immediately change available balances.
Example 17. 1 Staying Afloat Suppose you have € 5, 000 on deposit. One day, you write a cheque for € 1, 000 to pay for books, and you deposit € 2, 000. What are your disbursement, collection, and net floats?
Example 17. 1 Staying Afloat After you write the € 1, 000 cheque, you show a balance of € 4, 000 on your books, but the bank shows € 5, 000 while the cheque is clearing. The difference is a disbursement float of € 1, 000. After you deposit the € 2, 000 cheque, you show a balance of € 6, 000. Your available balance doesn’t rise until the cheque clears. This results in a collection float of € 2, 000. Your net float is the sum of the collection and disbursement floats, or € 1, 000. Overall, you show € 6, 000 on your books. The bank shows a € 7, 000 balance, but only € 5, 000 is available because your deposit has not been cleared. The discrepancy between your available balance and your book balance is the net float ( € 1, 000).
Float Management Float management involves controlling the collection and disbursement of cash. The objective in cash collection is to speed up collections and reduce the lag between the time customers pay their bills and the time the cash becomes available. The objective in cash disbursement is to control payments and minimize the firm’s costs associated with making payments.
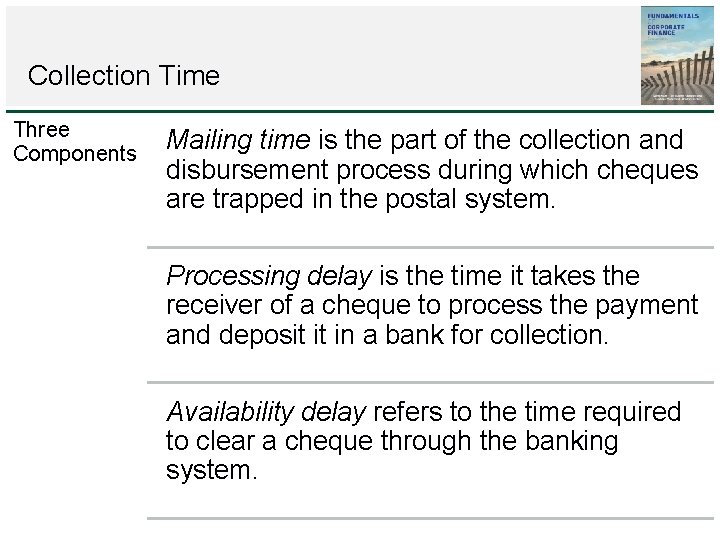
Collection Time Three Components Mailing time is the part of the collection and disbursement process during which cheques are trapped in the postal system. Processing delay is the time it takes the receiver of a cheque to process the payment and deposit it in a bank for collection. Availability delay refers to the time required to clear a cheque through the banking system.
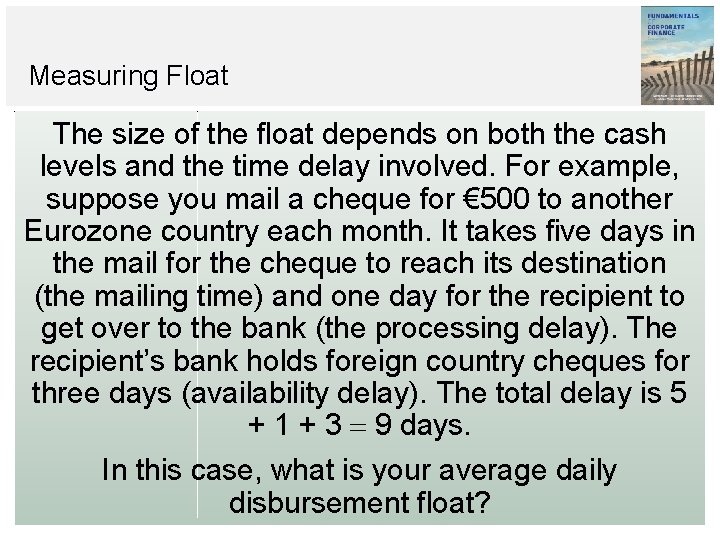
Measuring Float The size of the float depends on both the cash levels and the time delay involved. For example, suppose you mail a cheque for € 500 to another Eurozone country each month. It takes five days in the mail for the cheque to reach its destination (the mailing time) and one day for the recipient to get over to the bank (the processing delay). The recipient’s bank holds foreign country cheques for three days (availability delay). The total delay is 5 + 1 + 3 9 days. In this case, what is your average daily disbursement float?
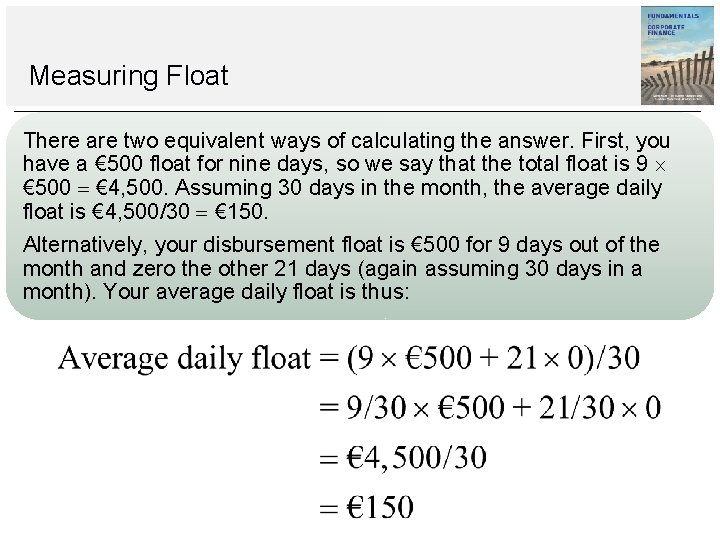
Measuring Float There are two equivalent ways of calculating the answer. First, you have a € 500 float for nine days, so we say that the total float is 9 € 500 € 4, 500. Assuming 30 days in the month, the average daily float is € 4, 500/30 € 150. Alternatively, your disbursement float is € 500 for 9 days out of the month and zero the other 21 days (again assuming 30 days in a month). Your average daily float is thus:
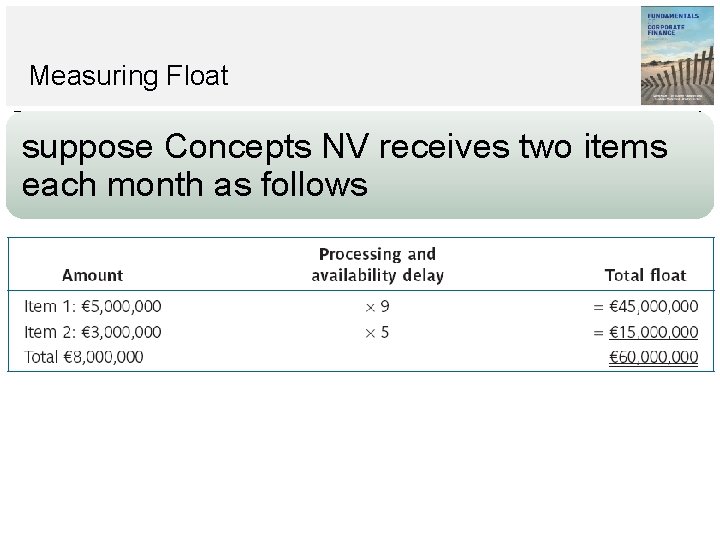
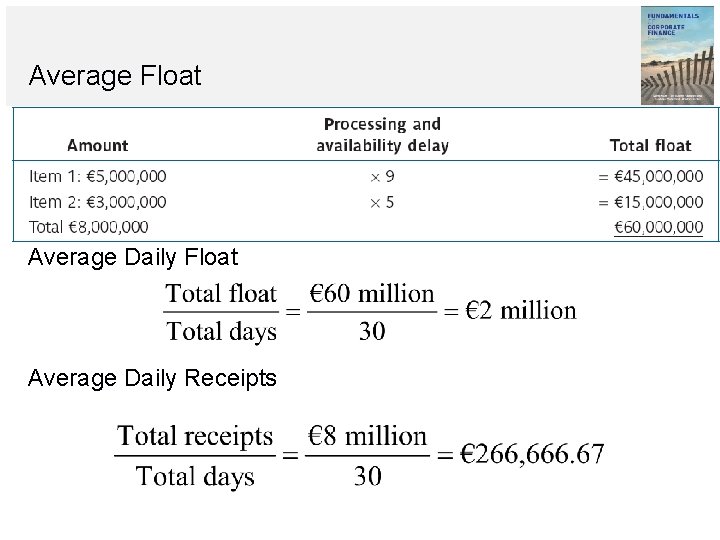
Measuring Float suppose Concepts NV receives two items each month as follows
Average Float Average Daily Receipts
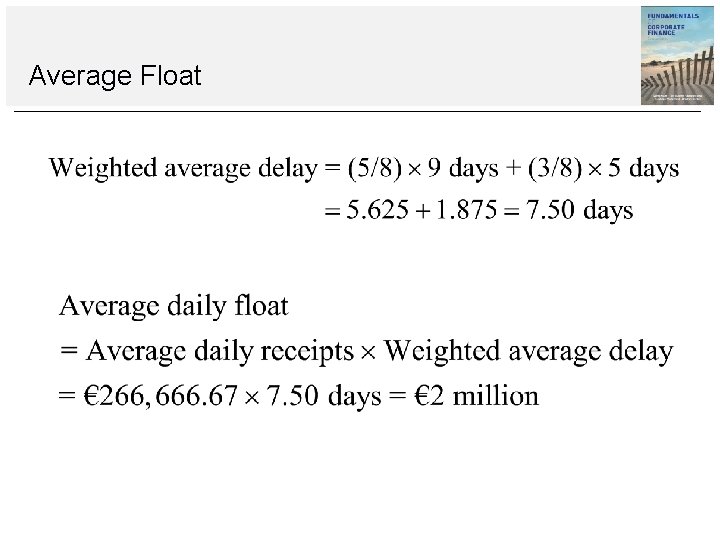
Average Float
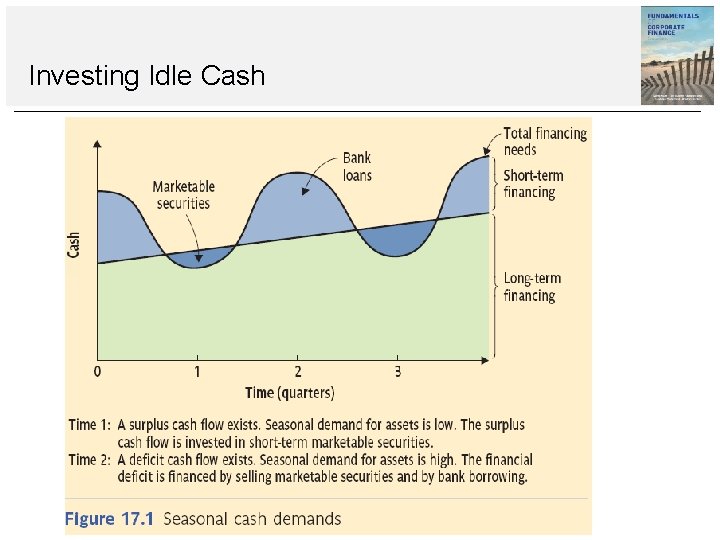
Investing Idle Cash
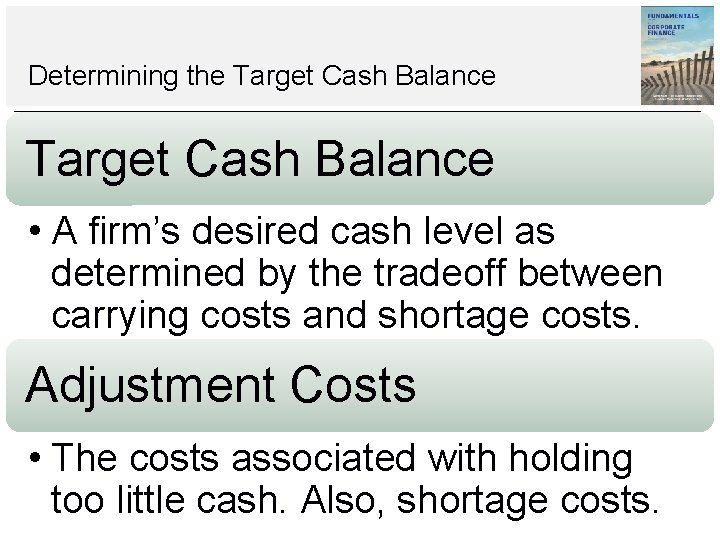
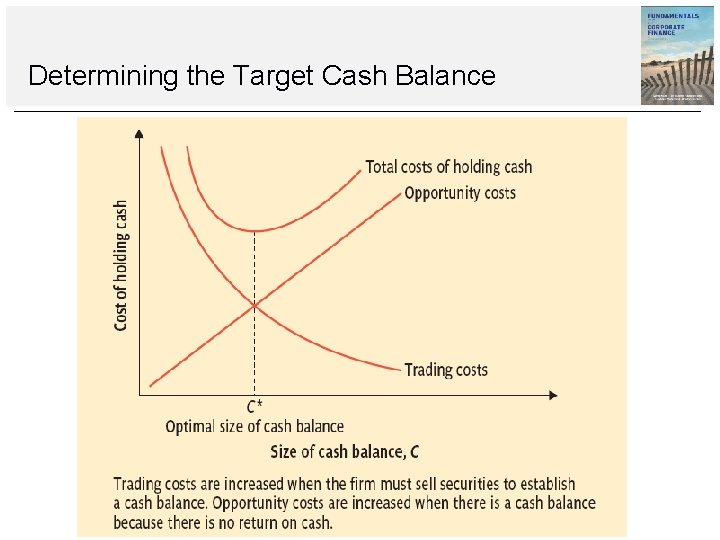
Determining the Target Cash Balance • A firm’s desired cash level as determined by the tradeoff between carrying costs and shortage costs. Adjustment Costs • The costs associated with holding too little cash. Also, shortage costs.
Determining the Target Cash Balance
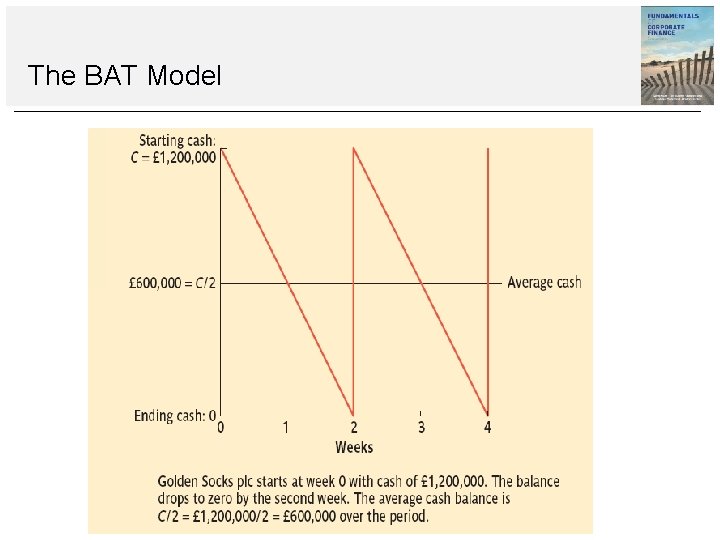
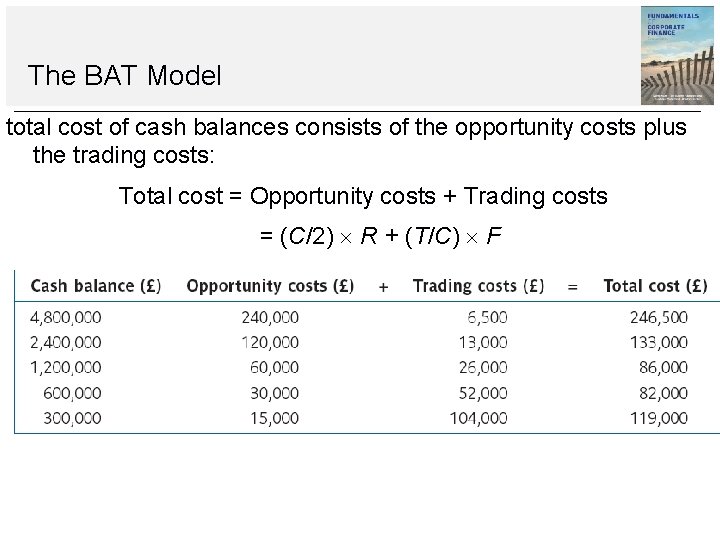
The BAT Model Suppose Golden Socks plc began week 0 with a cash balance of C = £ 1. 2 million, and outflows exceed inflows by £ 600, 000 per week. Its cash balance will drop to zero at the end of week 2, and its average cash balance will be C/2 = £ 1. 2 million/2 = £ 600, 000 over the two-week period. At the end of week 2, Golden Socks must replace its cash either by selling marketable securities or by borrowing.
The BAT Model
The BAT Model Because transaction costs must be incurred whenever cash is replenished (for example, the brokerage costs of selling marketable securities), establishing large initial cash balances will lower the trading costs connected with cash management. However, the larger the average cash balance, the greater the opportunity cost (the return that could have been earned on marketable securities).
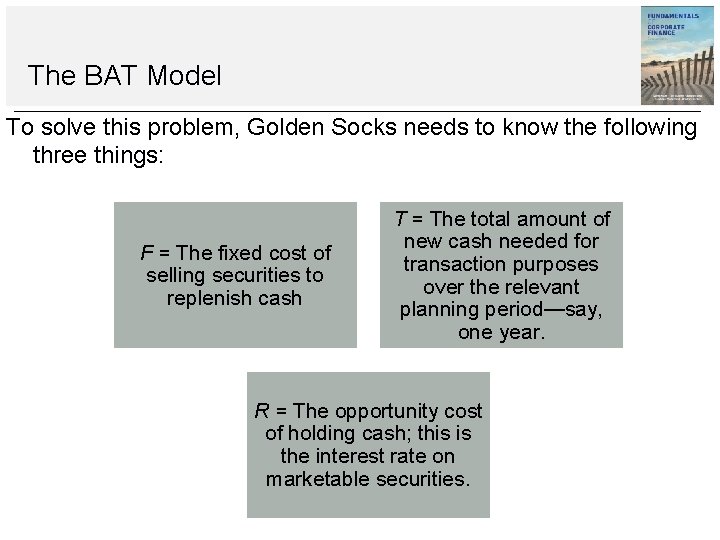
The BAT Model To solve this problem, Golden Socks needs to know the following three things: F = The fixed cost of selling securities to replenish cash T = The total amount of new cash needed for transaction purposes over the relevant planning period—say, one year. R = The opportunity cost of holding cash; this is the interest rate on marketable securities.
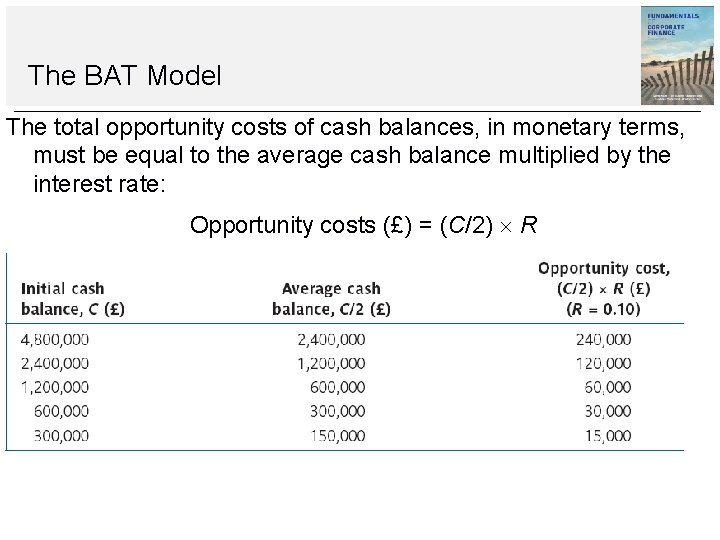
The BAT Model The total opportunity costs of cash balances, in monetary terms, must be equal to the average cash balance multiplied by the interest rate: Opportunity costs (£) = (C/2) R
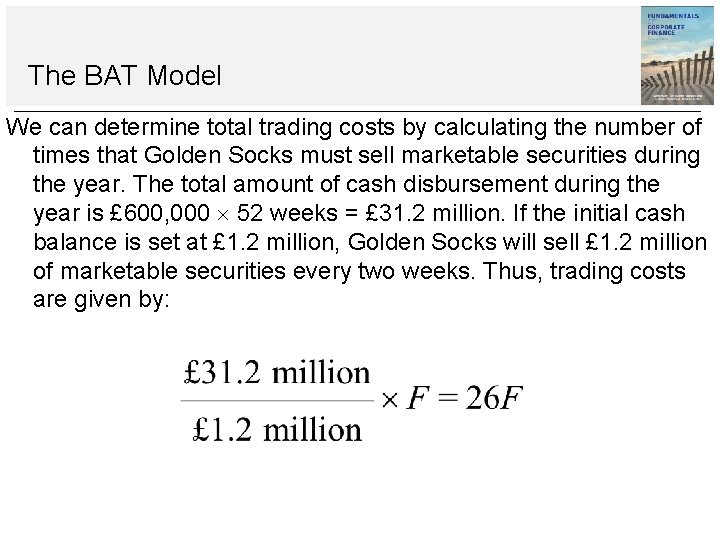
The BAT Model We can determine total trading costs by calculating the number of times that Golden Socks must sell marketable securities during the year. The total amount of cash disbursement during the year is £ 600, 000 52 weeks = £ 31. 2 million. If the initial cash balance is set at £ 1. 2 million, Golden Socks will sell £ 1. 2 million of marketable securities every two weeks. Thus, trading costs are given by:
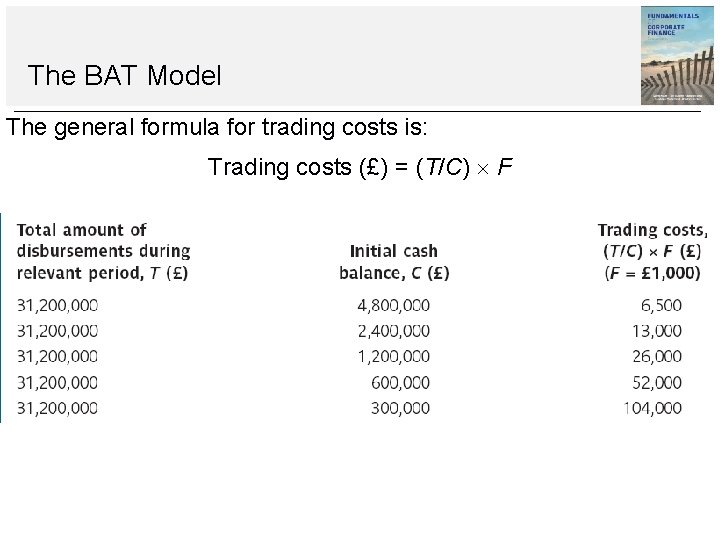
The BAT Model The general formula for trading costs is: Trading costs (£) = (T/C) F
The BAT Model total cost of cash balances consists of the opportunity costs plus the trading costs: Total cost = Opportunity costs + Trading costs = (C/2) R + (T/C) F
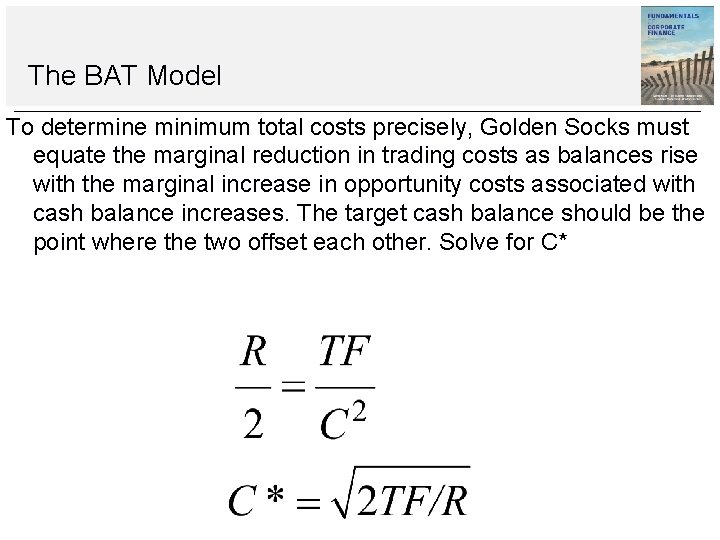
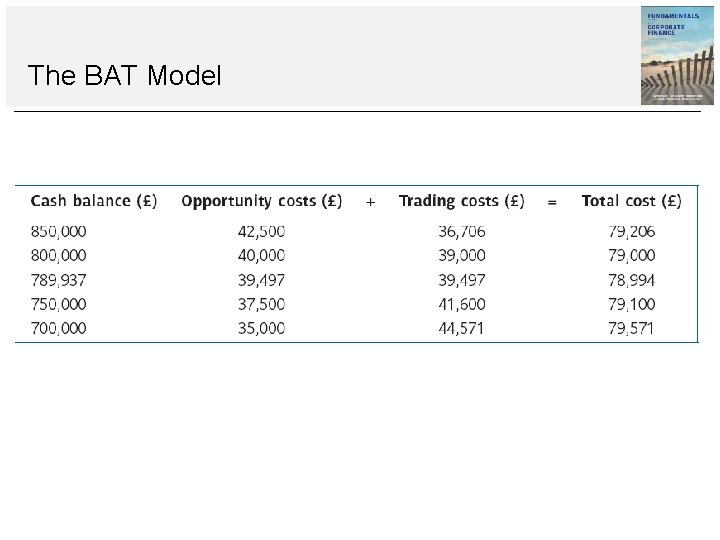
The BAT Model To determine minimum total costs precisely, Golden Socks must equate the marginal reduction in trading costs as balances rise with the marginal increase in opportunity costs associated with cash balance increases. The target cash balance should be the point where the two offset each other. Solve for C*
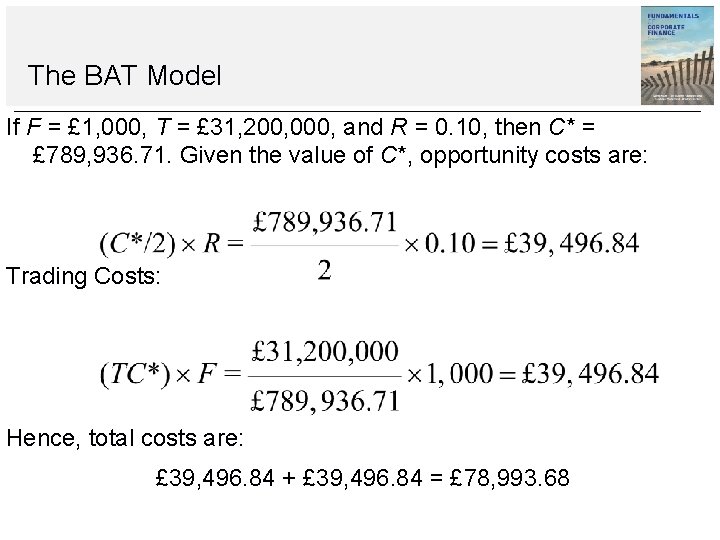
The BAT Model If F = £ 1, 000, T = £ 31, 200, 000, and R = 0. 10, then C* = £ 789, 936. 71. Given the value of C*, opportunity costs are: Trading Costs: Hence, total costs are: £ 39, 496. 84 + £ 39, 496. 84 = £ 78, 993. 68
The BAT Model
Example 17. 2 The BAT Model Vulcan SA has cash outflows of € 100 per day, seven days a week. The interest rate is 5 per cent, and the fixed cost of replenishing cash balances is € 10 per transaction. What is the optimal initial cash balance? What is the total cost?
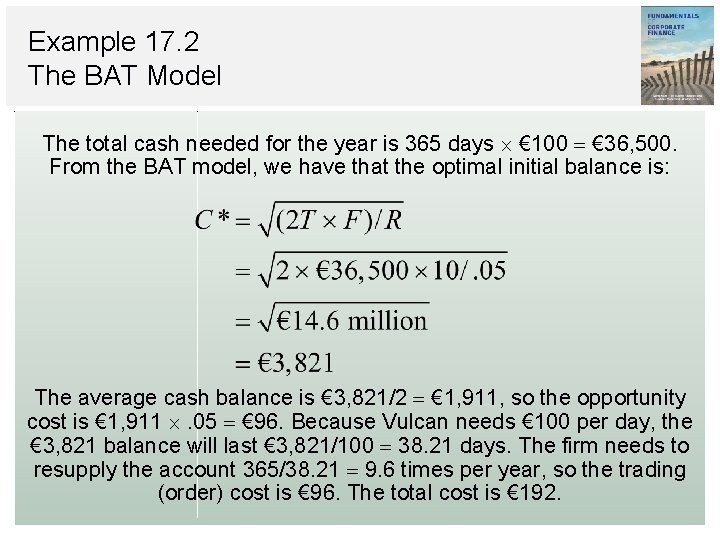
Example 17. 2 The BAT Model The total cash needed for the year is 365 days € 100 € 36, 500. From the BAT model, we have that the optimal initial balance is: The average cash balance is € 3, 821/2 € 1, 911, so the opportunity cost is € 1, 911 . 05 € 96. Because Vulcan needs € 100 per day, the € 3, 821 balance will last € 3, 821/100 38. 21 days. The firm needs to resupply the account 365/38. 21 9. 6 times per year, so the trading (order) cost is € 96. The total cost is € 192.
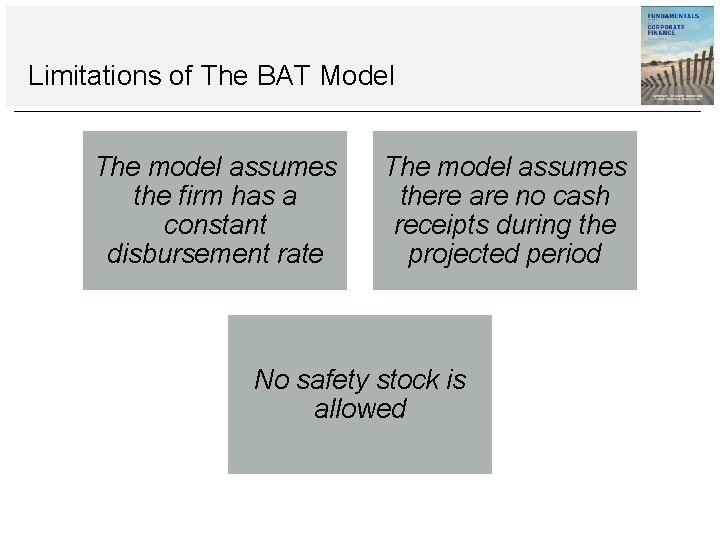
Limitations of The BAT Model The model assumes the firm has a constant disbursement rate The model assumes there are no cash receipts during the projected period No safety stock is allowed
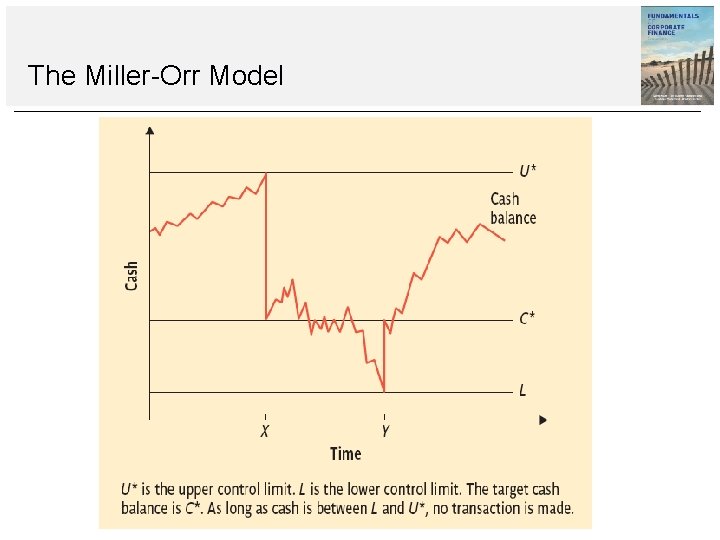
The Miller-Orr Model
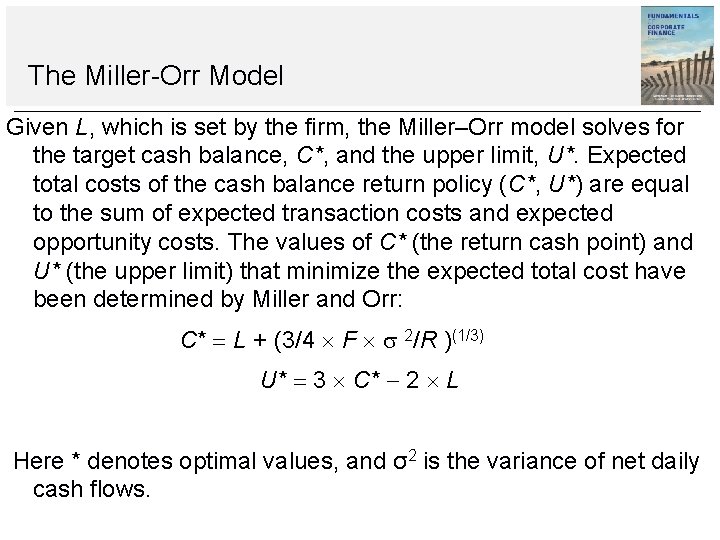
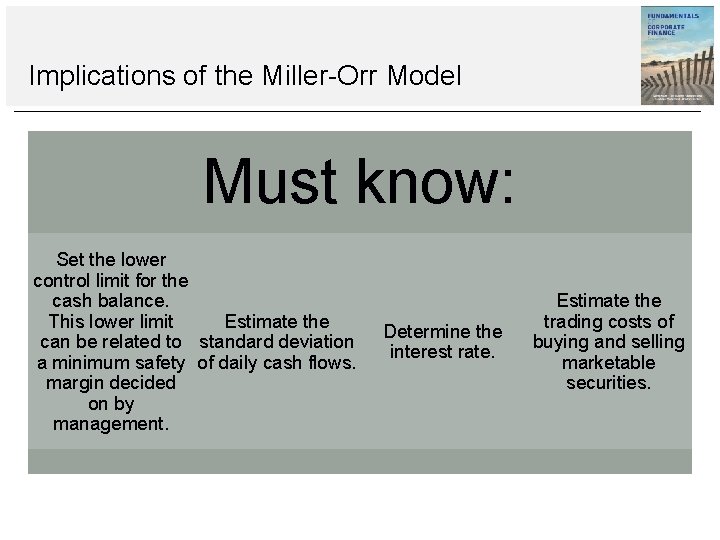
The Miller-Orr Model Given L, which is set by the firm, the Miller–Orr model solves for the target cash balance, C*, and the upper limit, U*. Expected total costs of the cash balance return policy (C*, U*) are equal to the sum of expected transaction costs and expected opportunity costs. The values of C* (the return cash point) and U* (the upper limit) that minimize the expected total cost have been determined by Miller and Orr: C* L + (3/4 F 2/R )(1/3) U* 3 C* 2 L Here * denotes optimal values, and σ2 is the variance of net daily cash flows.
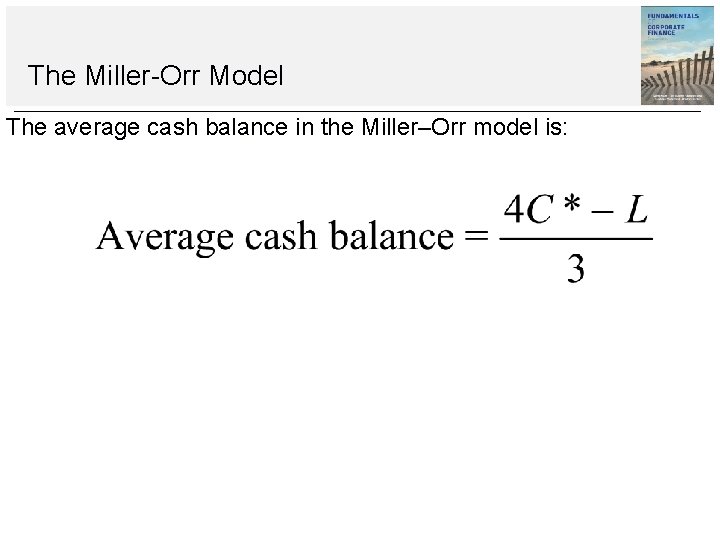
The Miller-Orr Model The average cash balance in the Miller–Orr model is:
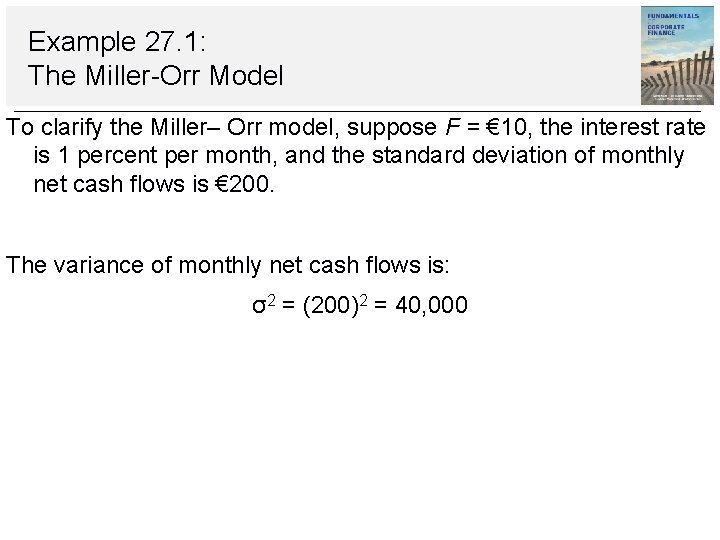
Example 27. 1: The Miller-Orr Model To clarify the Miller– Orr model, suppose F = € 10, the interest rate is 1 percent per month, and the standard deviation of monthly net cash flows is € 200. The variance of monthly net cash flows is: σ2 = (200)2 = 40, 000
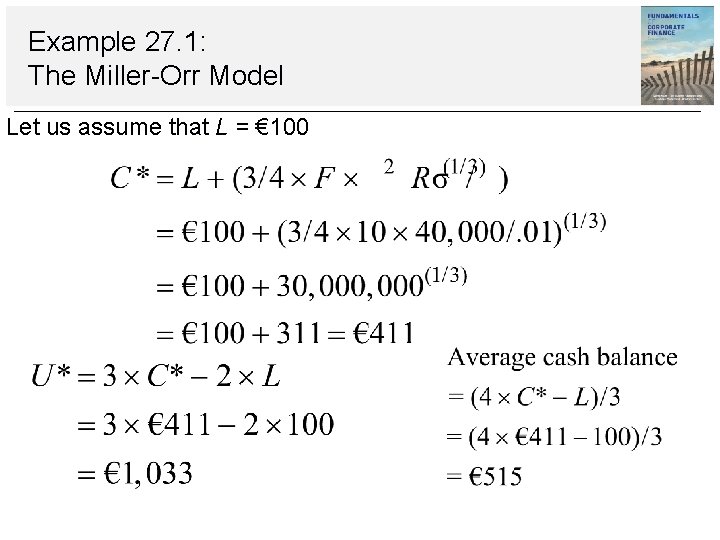
Example 27. 1: The Miller-Orr Model Let us assume that L = € 100
Implications of the Miller-Orr Model Must know: Set the lower control limit for the cash balance. This lower limit Estimate the can be related to standard deviation a minimum safety of daily cash flows. margin decided on by management. Determine the interest rate. Estimate the trading costs of buying and selling marketable securities.
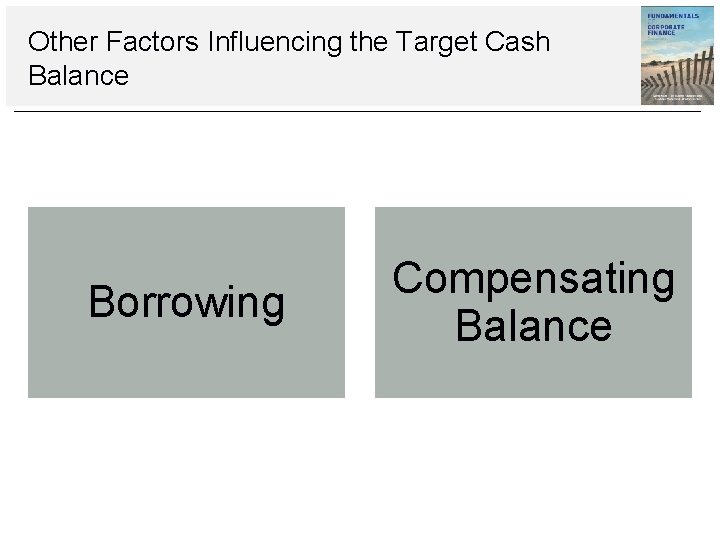
Other Factors Influencing the Target Cash Balance Borrowing Compensating Balance
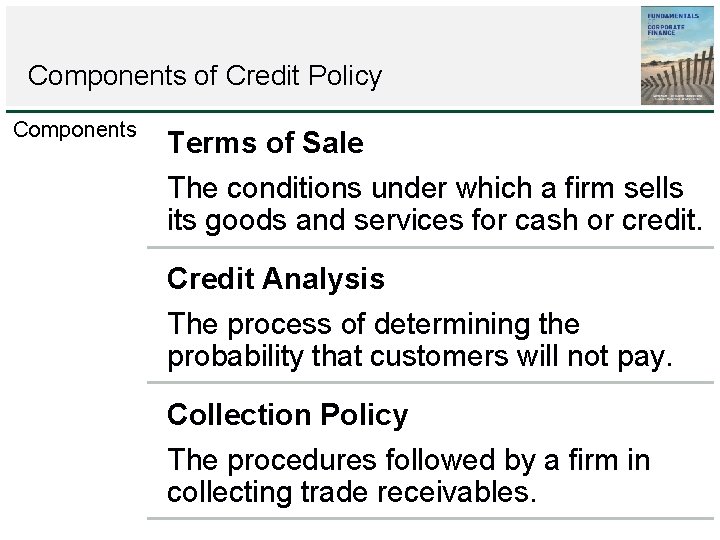
Components of Credit Policy Components Terms of Sale The conditions under which a firm sells its goods and services for cash or credit. Credit Analysis The process of determining the probability that customers will not pay. Collection Policy The procedures followed by a firm in collecting trade receivables.
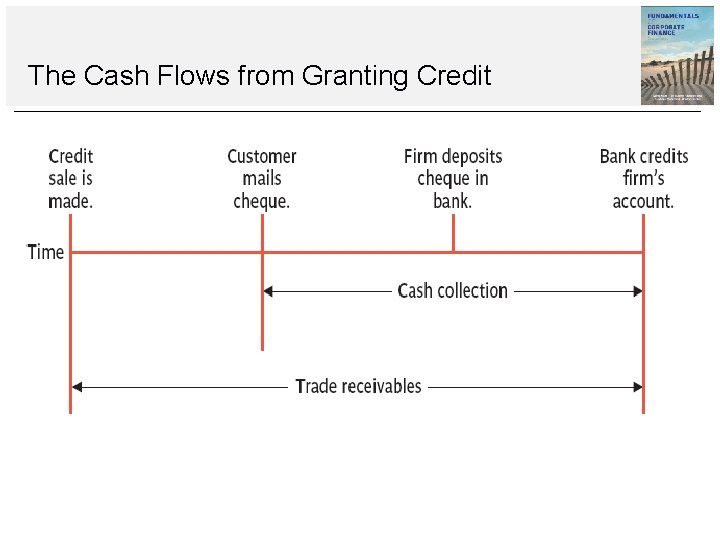
The Cash Flows from Granting Credit
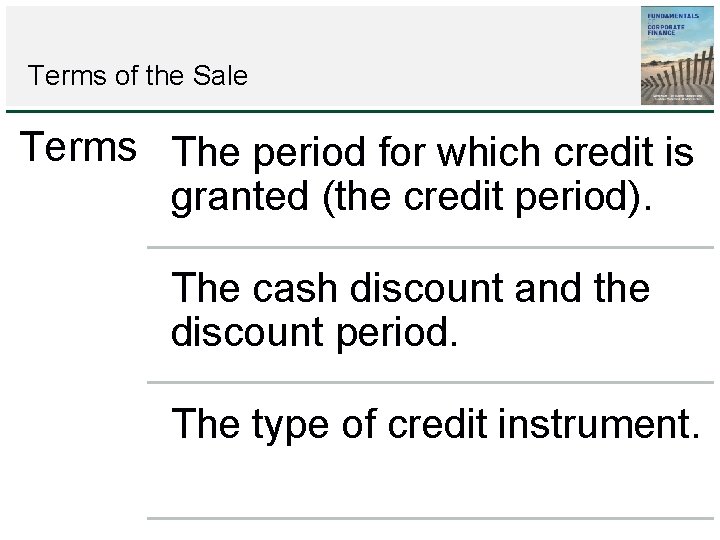
Terms of the Sale Terms The period for which credit is granted (the credit period). The cash discount and the discount period. The type of credit instrument.
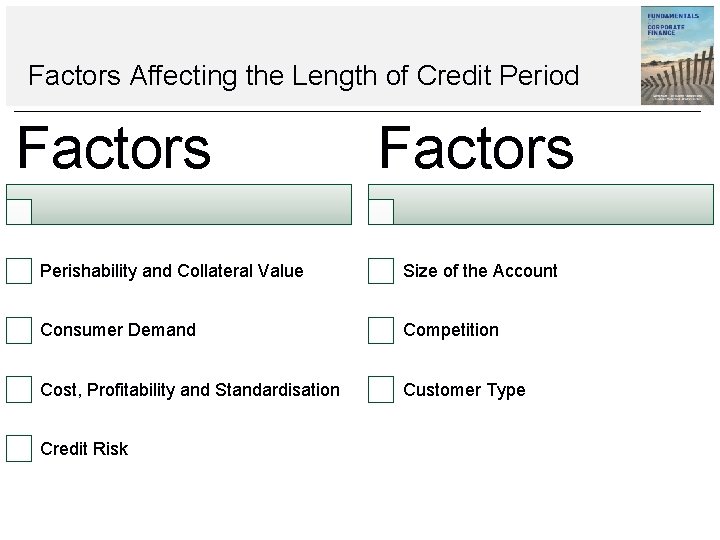
Factors Affecting the Length of Credit Period Factors Perishability and Collateral Value Size of the Account Consumer Demand Competition Cost, Profitability and Standardisation Customer Type Credit Risk
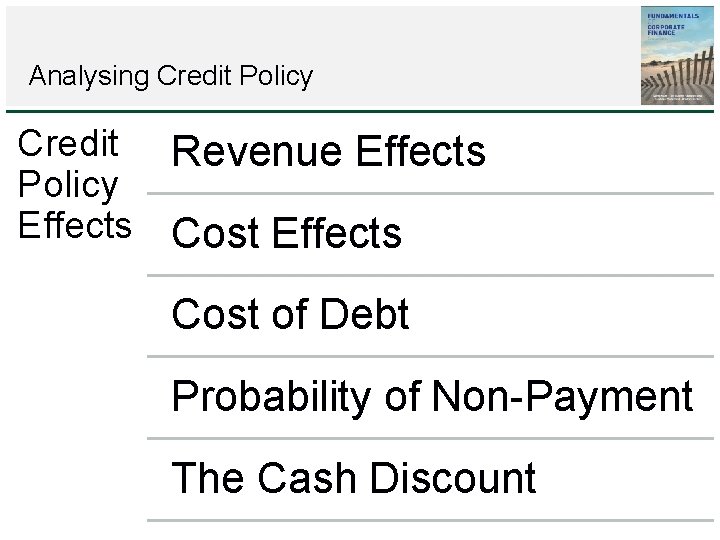
Analysing Credit Policy Credit Revenue Effects Policy Effects Cost of Debt Probability of Non-Payment The Cash Discount
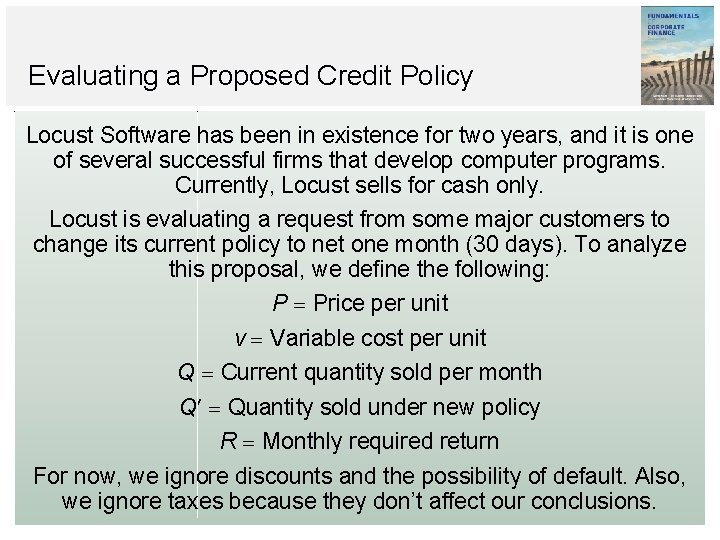
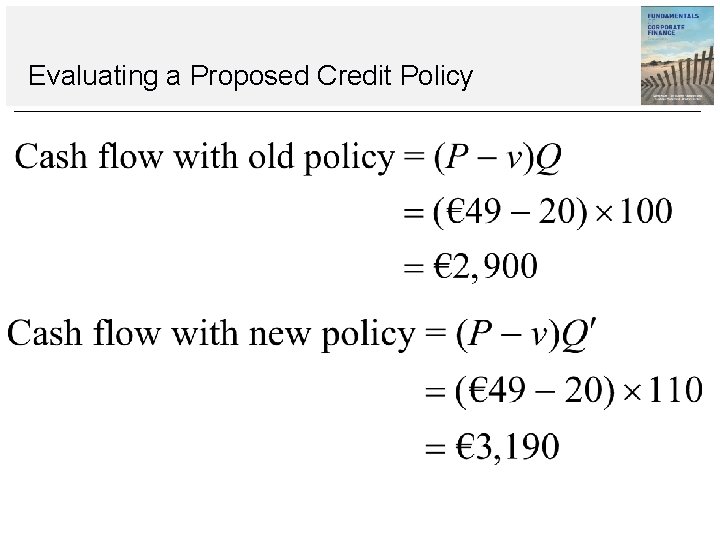
Evaluating a Proposed Credit Policy Locust Software has been in existence for two years, and it is one of several successful firms that develop computer programs. Currently, Locust sells for cash only. Locust is evaluating a request from some major customers to change its current policy to net one month (30 days). To analyze this proposal, we define the following: P Price per unit v Variable cost per unit Q Current quantity sold per month Q Quantity sold under new policy R Monthly required return For now, we ignore discounts and the possibility of default. Also, we ignore taxes because they don’t affect our conclusions.
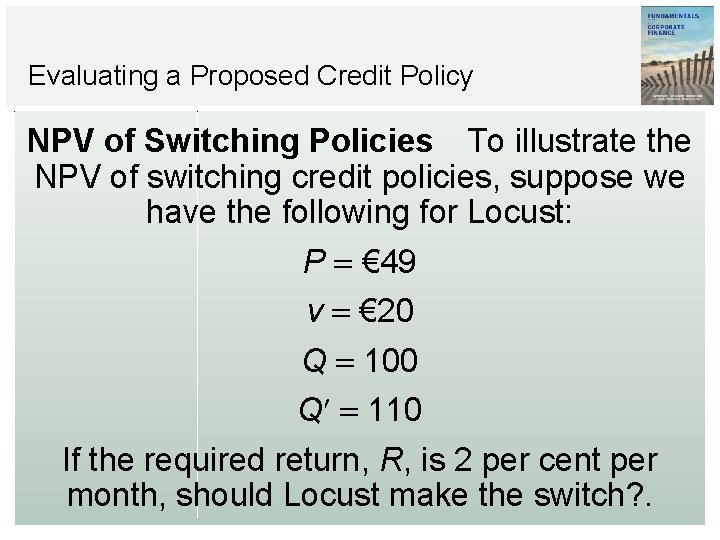
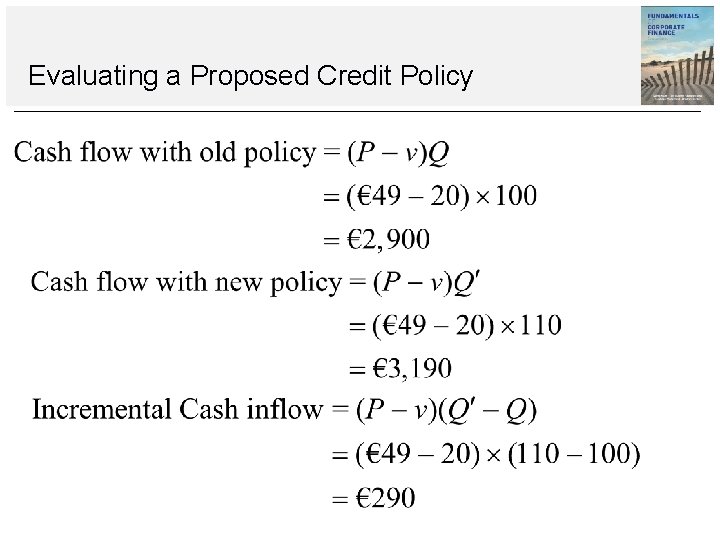
Evaluating a Proposed Credit Policy NPV of Switching Policies To illustrate the NPV of switching credit policies, suppose we have the following for Locust: P € 49 v € 20 Q 100 Q 110 If the required return, R, is 2 per cent per month, should Locust make the switch? .
Evaluating a Proposed Credit Policy
Evaluating a Proposed Credit Policy
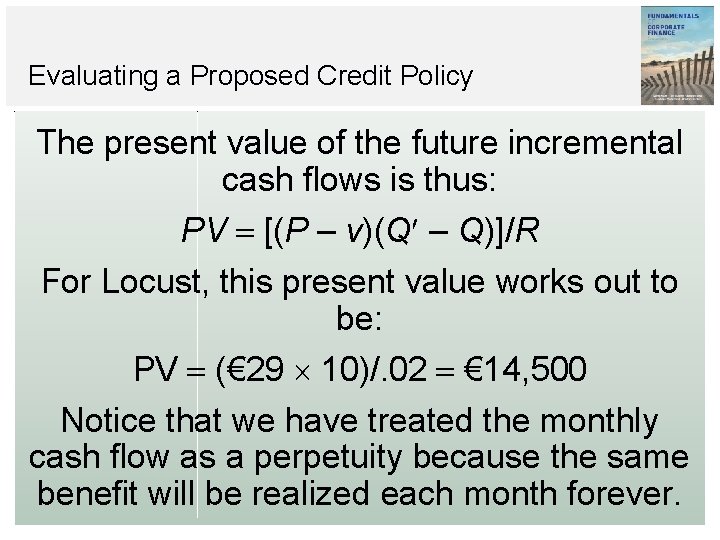
Evaluating a Proposed Credit Policy The present value of the future incremental cash flows is thus: PV [(P – v)(Q – Q)]/R For Locust, this present value works out to be: PV (€ 29 10)/. 02 € 14, 500 Notice that we have treated the monthly cash flow as a perpetuity because the same benefit will be realized each month forever.
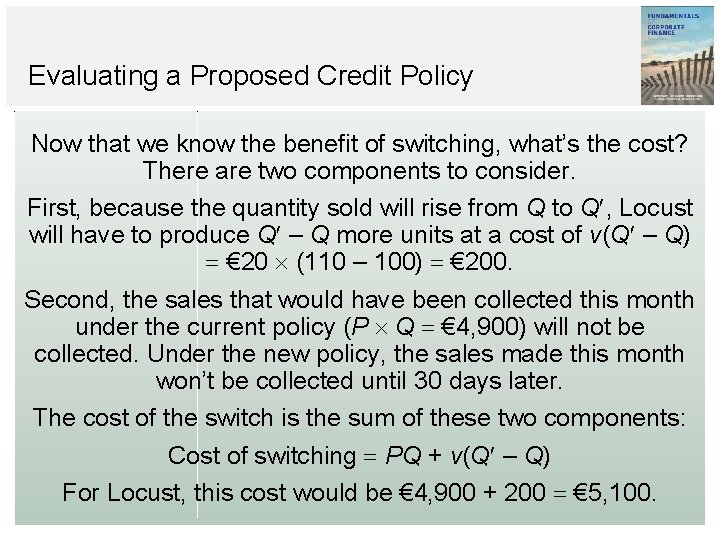
Evaluating a Proposed Credit Policy Now that we know the benefit of switching, what’s the cost? There are two components to consider. First, because the quantity sold will rise from Q to Q , Locust will have to produce Q – Q more units at a cost of v(Q – Q) € 20 (110 – 100) € 200. Second, the sales that would have been collected this month under the current policy (P Q € 4, 900) will not be collected. Under the new policy, the sales made this month won’t be collected until 30 days later. The cost of the switch is the sum of these two components: Cost of switching PQ + v(Q – Q) For Locust, this cost would be € 4, 900 + 200 € 5, 100.
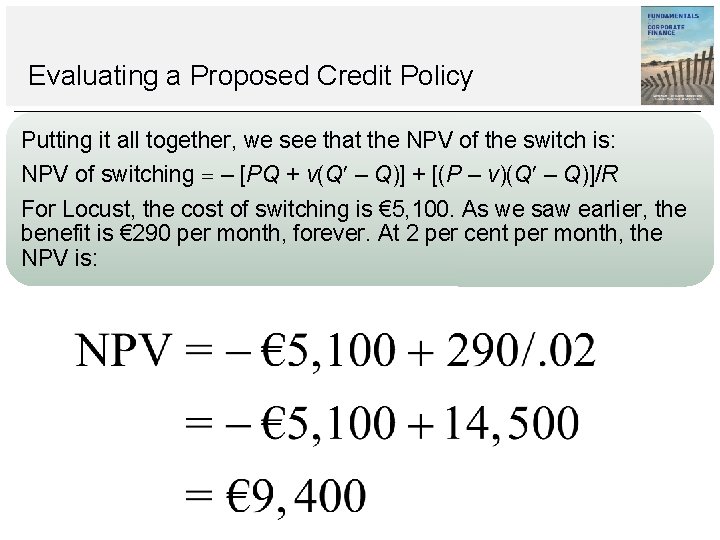
Evaluating a Proposed Credit Policy Putting it all together, we see that the NPV of the switch is: NPV of switching – [PQ + v(Q – Q)] + [(P – v)(Q – Q)]/R For Locust, the cost of switching is € 5, 100. As we saw earlier, the benefit is € 290 per month, forever. At 2 per cent per month, the NPV is:
Example 17. 3 We’d Rather Fight than Switch Suppose a company is considering a switch from all cash to net 30, but the quantity sold is not expected to change. What is the NPV of the switch? Explain.
Example 17. 3 We’d Rather Fight than Switch In this case, Q – Q is zero, so the NPV is just – PQ. What this says is that the effect of the switch is simply to postpone month’s collections forever, with no benefit from doing so. .
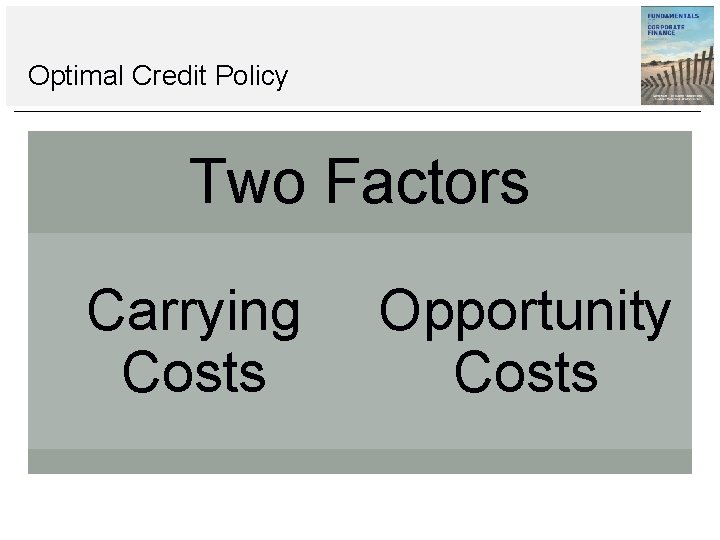
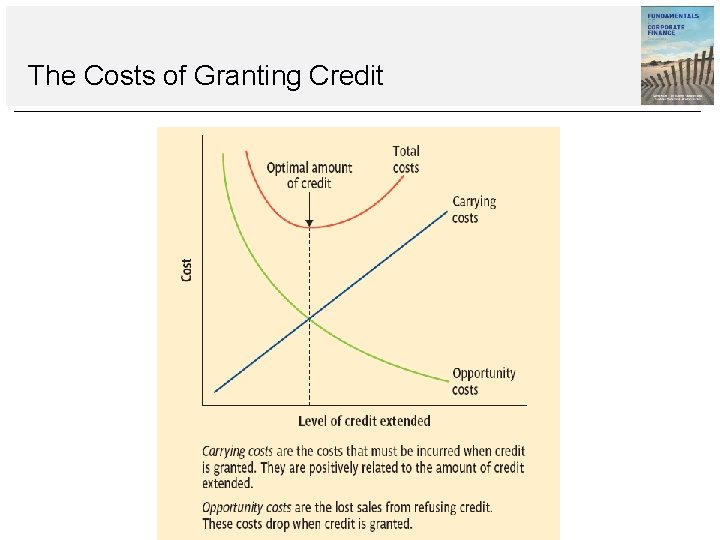
Optimal Credit Policy Two Factors Carrying Costs Opportunity Costs
The Costs of Granting Credit
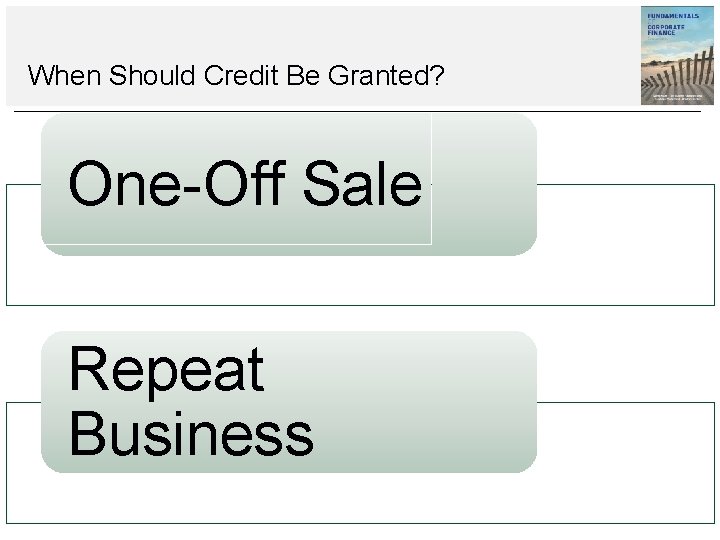
When Should Credit Be Granted? One-Off Sale Repeat Business
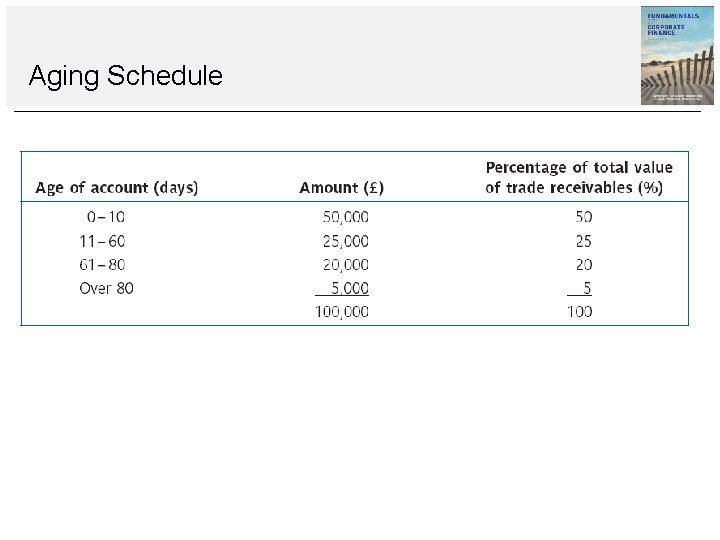
Aging Schedule
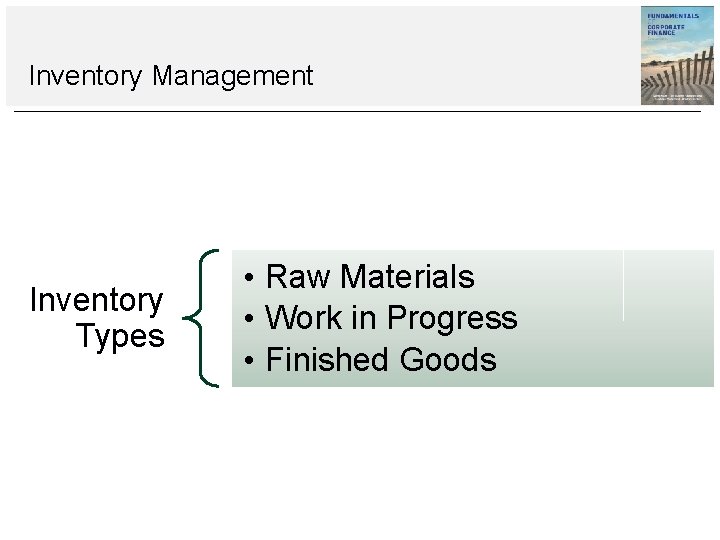
Inventory Management Inventory Types • Raw Materials • Work in Progress • Finished Goods
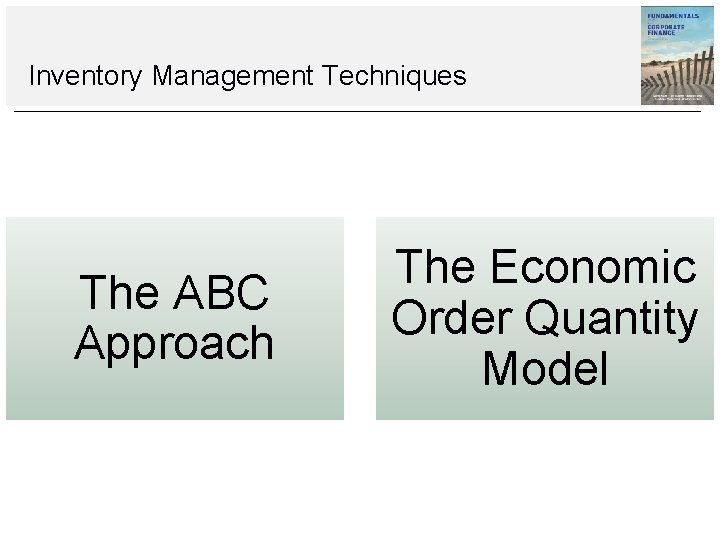
Inventory Management Techniques The ABC Approach The Economic Order Quantity Model
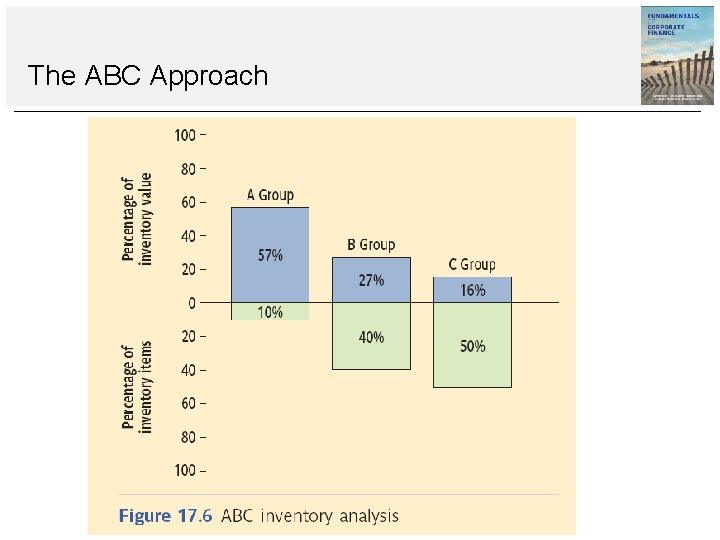
The ABC Approach
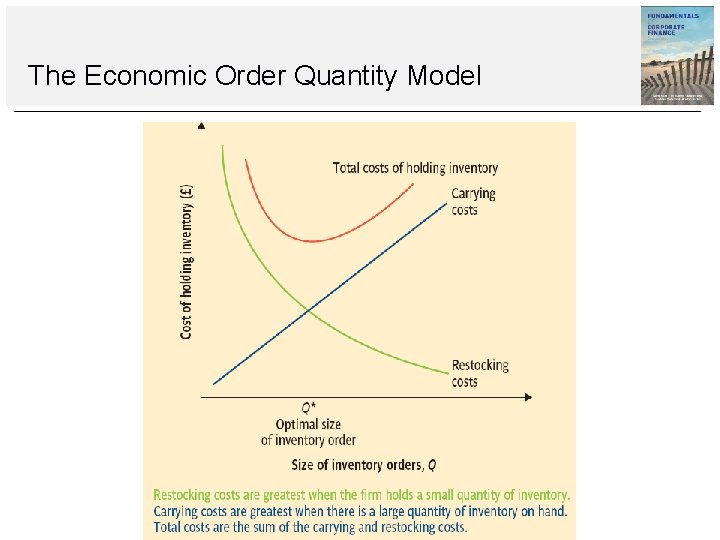
The Economic Order Quantity Model
Activities for this Lecture Reading • Insert here Assignment • Insert here
Thank You