Fundamentals of Blood Biochemistry BCH 220 DR MANSOUR
 DR. MANSOUR GATASHEH Biochemistry Department, Science College King")
Fundamentals of Blood Biochemistry (BCH 220) DR. MANSOUR GATASHEH Biochemistry Department, Science College King Saud University

Class 4: Hemoglobin T

Objectives for this lecture l Discuss the structure of Hemoglobin. l understand the erythrocyte sedimentation rate.
 l l l normal adult haemoglobin A (Hb A). consists of :")
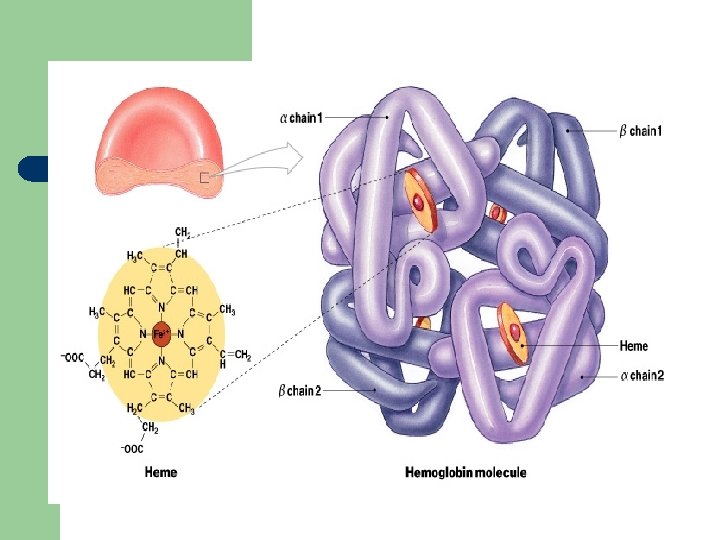
Hemoglobin (structure) l l l normal adult haemoglobin A (Hb A). consists of : - four polypeptide chains, α 2 β 2. - four haem group. Also Normal adult contains Hb F and Hb A 2.
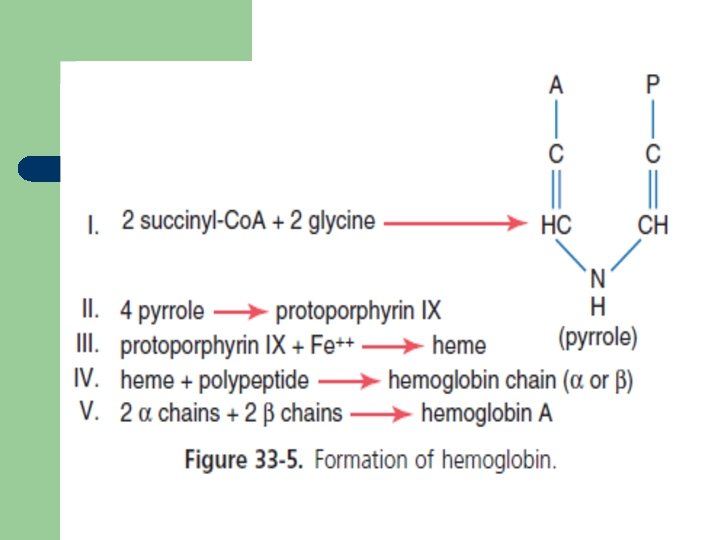
 l l protoporphyrin combines with iron in the ferrous (Fe 2+) state")
Hemoglobin (structure) l l protoporphyrin combines with iron in the ferrous (Fe 2+) state to form haem. absorbs visible light and colors heme deep red
 l l Globin in hemoglobin is spherical, tetrameric protein containing four heme")
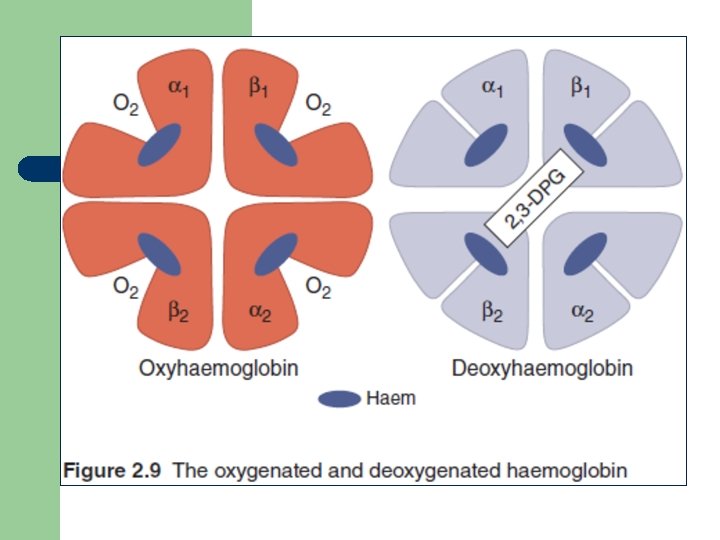
Hemoglobin (structure) l l Globin in hemoglobin is spherical, tetrameric protein containing four heme prosthetic groups. Structure have strong Hydrophobic interactions between unlike subunits (α 1β 1 and α 2β 2). binding of O 2 to a hemoglobin subunit cause structural conformational change. Oxygen release is enhanced by the binding of 2, 3 -diphosphoglycerate (DPG), which stabilizes the quaternary structure of deoxyhemoglobin.

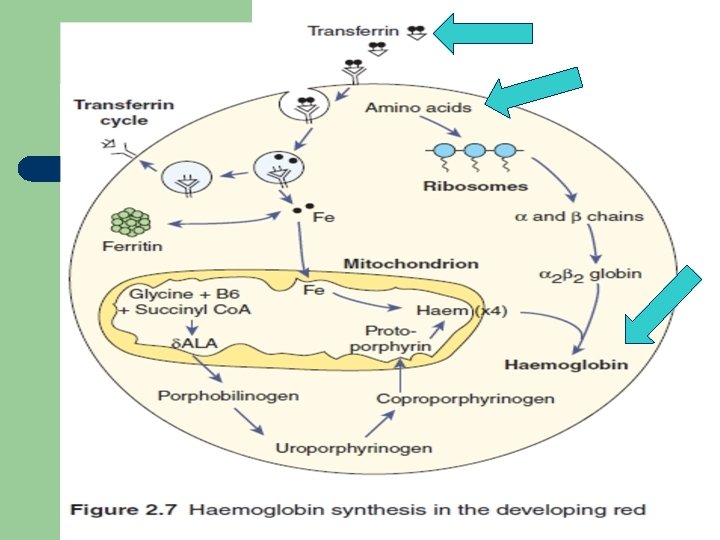
Hemoglobin synthesis 1. 2. 3. 4. 5. 6. Haem synthesis occurs in the mitochondria. vitamin B 6 is a coenzyme for this reaction. iron (Fe) is supplied from circulating transferrin. globin chains are synthesized on ribosomes. protoporphyrin combines with ferrous (Fe 2+) to form haem. four globin chains each with its own haem make up a haemoglobin molecule.
 l l Carry O 2 from the lungs to the tissues (at")
Hemoglobin (function) l l Carry O 2 from the lungs to the tissues (at PO 2). Return blood with CO 2 to the lungs. When Fe(II) goes to Fe(III), oxidized, it produces methemoglobin which is brown. Dissociation curve of haemoglobin O 2 depend on: - 2, 3‐DPG (2, 3‐diphosphoglycerate) - H+ ions in RBC - CO 2 in RBC - haemoglobin structure.
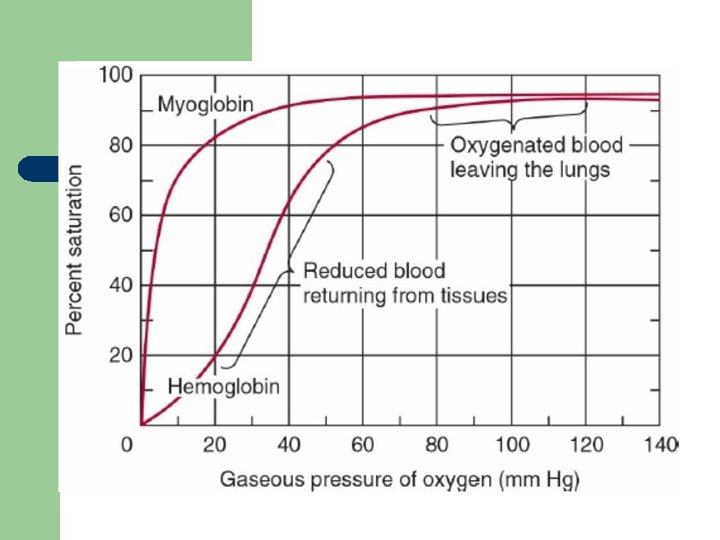
 l l Curve shift right (O 2 is given up")
Hemoglobin (Oxygen Dissociation Curves) l l Curve shift right (O 2 is given up easily): Ø High concentrations of 2, 3‐DPG, H+ or CO 2, and the presence of sickle haemoglobin (Hb S). Curve shift left (O 2 is given up less readily): Ø fetal haemoglobin (Hb F) Ø unable to bind 2, 3‐DPG Ø haemoglobins associated with polycythaemia (abnormal)
 kill because it disrupt the physiologic function of hemoglobin.")
l l carbon monoxide (CO) kill because it disrupt the physiologic function of hemoglobin. When a drug or toxic substance oxidizes haemoglobin, this will cause formation of methaemoglobinaemia (Hb M) (abnormal haemoglobin).
![Bohr Effect l Higher p. H (low [H+]) promotes tighter binding of oxygen to](http://slidetodoc.com/presentation_image_h2/7f38378cf784f2f4ba82a9f8849a2d10/image-16.jpg "Bohr Effect l Higher p. H (low [H+]) promotes tighter binding of oxygen to")
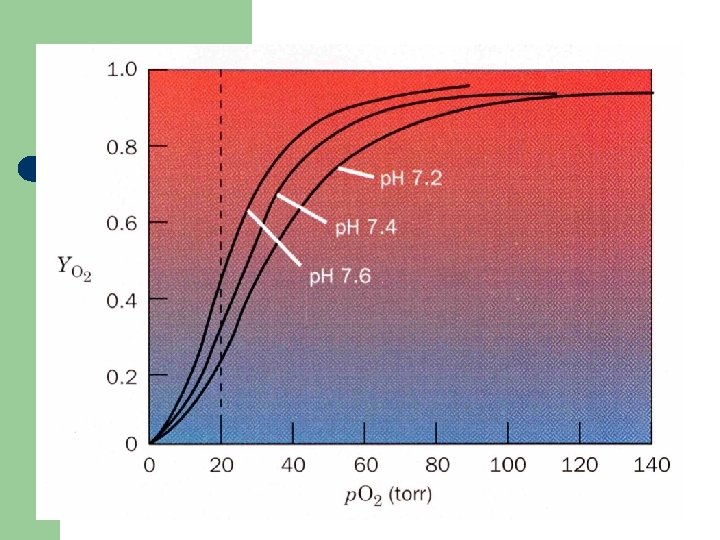
Bohr Effect l Higher p. H (low [H+]) promotes tighter binding of oxygen to hemoglobin l l and Lower p. H (higher [H+]) permits the easier release of oxygen from hemoglobin

Bohr Effect

Hematocrit l l is defined as the volume percentage of red blood cells in a given sample of blood after centrifugation (HCT). It also be referred as: ü Packed Cell Volume (PCV) ü or erythrocyte volume fraction (EVF)

Hematocrit l l l Decrease in the number or size of RBCs will decreases the amount of space they occupy, resulting in a lower hematocrit. tests is carried out for detecting the presence and degree of anemia or polycythemia. Hemoglobin estimation is less accurate, and RBC count far less accurate.

Hematocrit l l Microhaematocrit tube is a capillary tube, 75 mm in length and 1 mm in diameter. tube contains heparin and show a red ring at the end of it.
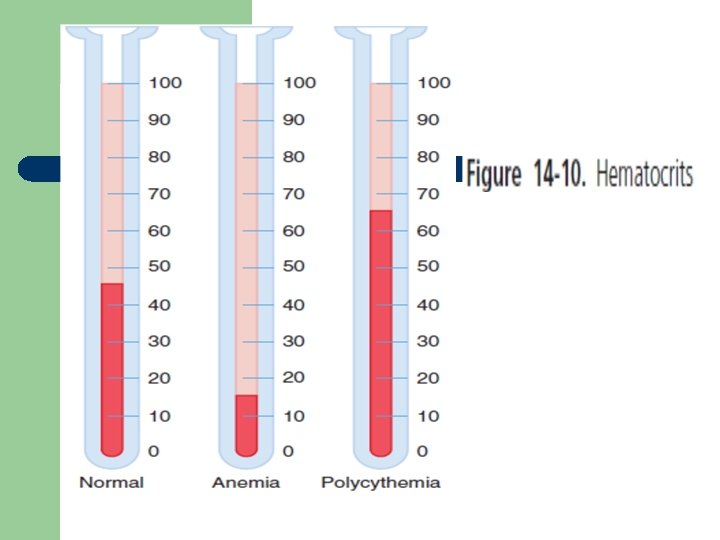

l l Normal ranges: Ø Males : 40 %– 54 % Ø Females : 36 %– 47 % Ø Newborns : 55 -68 %. viscosity of blood increases as the hematocrit increases.

Hematocrit l Low HCT indicate: ü Anemia. ü Large number of WBC due to infection, leukemia, lymphoma, long-term illness. ü Acute kidney disease, will lower Erythropoietin. ü Pregnancy which give additional fluid in blood.

Hematocrit l High HCT indicate: ü Erythrocytosis, abnormal increase in RBCs. ü polycythemia vera (blood cancer). ü Lung or heart disease ü Lower oxygen supply in the air (hypoxia). ü Dehydration. ü Burn which cause loss of plasma.
 test. Help")
Red cell indices l l Part of the complete blood count (CBC) test. Help diagnose: - cause of anemia. - condition in which there are too few RBCs.
 (MCV). Hct (%)")
Red cell indices include: Ø Average RBC size (mean corpuscular volume) (MCV). Hct (%) x 10/ RBC count (x 106/ml) • • • small = microcytic normal = normocytic large = macrocytic
 (MCH)")
Red cell indices Ø Hemoglobin amount per red blood cell (mean corpuscular haemoglobin) (MCH) Hgb (g/d. L) x 10/ RBC count (x 106/ml) Ø Amount of hemoglobin relative to the size of the cell (hemoglobin concentration) per RBC (MCHC) Hgb (g/d. L) x 100/ Hct (%)
 - RDW-SD: measured at the 20%")
Red cell indices Ø RBC distribution width (RDW) - RDW-SD: measured at the 20% relative height of the curve - RDW-CV can be falsely elevated or decreased depending on the MCV

Number Of cells Macrocytic Red blood cells Microcytic Red blood cells MCV 60 120 Cell Size (fl)
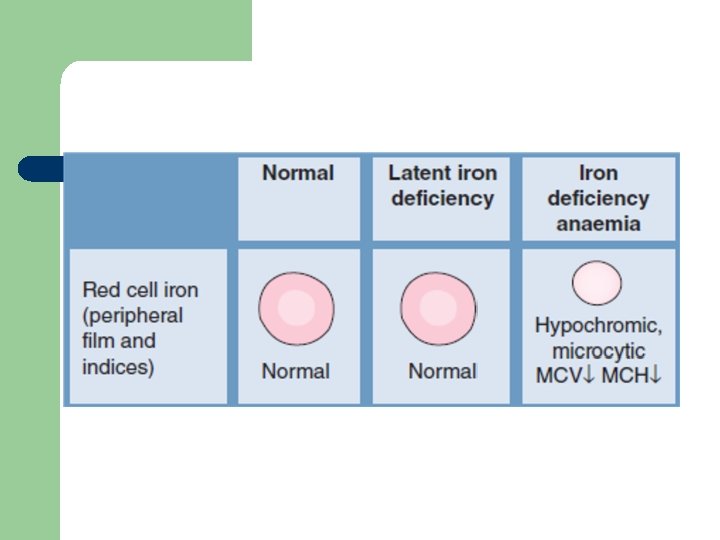

Glossary of Useful Blood Count Descriptors ü Hypochromia: pale red cells. Always accompanied by microcytosis Leukoerythroblastic: the presence of erythroblasts and myelocytes (which are precursors of mature cells) in the blood. Often indicates marrow infiltration eg by secondary cancer or fibrosis

Glossary of Useful Blood Count Descriptors ü ü Microangiopathy: indicates mechanical damage to red cells with red cell fragments on the blood film Microcytosis: small red cells Poikilocytosis: a traditional term for red cells of unequal shape Polychromasia: grey coloured cells on film, indicating presence of increased reticulocytes
 l Measures the speed of sedimentation of RBCs in plasma")
Erythrocyte Sedimentation Rate (ESR) l Measures the speed of sedimentation of RBCs in plasma over a period of 1 hour. l Affected by three factors: ü Erythrocytes, ü Plasma composition, ü Mechanical/technical factors.

l Erythrocytes q Larger the particle, the faster its rate of fall. q RBCs show an alteration in shape, such as sickle cells and spherocytes, are unable to aggregate or form rouleaux and the ESR is decreased. q Anisocytosis reduce the ability of RBCs to form large aggregates and lower ESR
,")
l Plasma composition q plasma concentration of large proteins (e. g. fibrinogen and immunoglobulins), cause a reduction in the negative charge of the RBCs and formation of rouleaux in blood film. q increase in plasma proteins will increased plasma viscosity and this will inhibit the fall of the RBCs (e. g. Increased concentrations of albumin will tend to lower the ESR. )

l Mechanical/technical factors q ESR tube be exactly perpendicular. q rack holding the tubes should not be subject to any movement or vibration
 l Normal range: - men = 1– 5 mm/hour -")
Erythrocyte Sedimentation Rate (ESR) l Normal range: - men = 1– 5 mm/hour - women = 5– 15 mm/hour l ESR elevated in: - with age (over 60) - pregnancy - acute and chronic infections - neoplastic diseases
 l High values (>100 mm/hour) : Ø Infections Ø collagen")
Erythrocyte Sedimentation Rate (ESR) l High values (>100 mm/hour) : Ø Infections Ø collagen vascular disease Ø malignancy (particularly myeloma) Ø severe anaemia Ø Acute hepatitis
 l Lower than expected readings: Ø Polycythaemia vera (high RBC")
Erythrocyte Sedimentation Rate (ESR) l Lower than expected readings: Ø Polycythaemia vera (high RBC conc. ) Ø Congestive heart failure Ø presence of abnormalities RBC (spherocytes, and sickle cells)
 l useful for diagnosing and monitoring (therapy): Ø temporal arteritis")
Erythrocyte Sedimentation Rate (ESR) l useful for diagnosing and monitoring (therapy): Ø temporal arteritis (tissue injury) Ø Polymyalgia rheumatica Ø patients with Hodgkin lymphoma (cancer cells form in the lymph system)

References l l Victor A Hoffbrand, Paul Moss, J Pettit; Essential Haematology. Essentials Series Blackwell Science, New York; 2008. Victor W. Rodwell, David A. Bender, Kathleen M. Botham, Peter J. Kennelly, P. Anthony Weil. Harper’s Illustrated Biochemistry. Mc. Graw-Hill Ed, 31 ed, 2018.
- Slides: 42