FUNDAMENTAL ANALYSIS OF FMCG BY Juhi Chaudhari 07
 �Rupali Jamdar (20) �Aishwarya Kulkarni (23)")
FUNDAMENTAL ANALYSIS OF FMCG BY: �Juhi Chaudhari (07) �Rupali Jamdar (20) �Aishwarya Kulkarni (23) �Manali Nargolkar (28) �Divya Raval (37)

FUNDAMENTAL ANALYSIS-AN OVERVIEW. . • Fundamental analysis is the study of fundamentals of country, sector and/or company. • Factors covered under these “FUNDAMENTALS” are: q A country’s GDP, outlook, inflation and interest rates, unemployment rate, population estimates, business and consumer confidence etc. q A sector’s contribution to nation’s GDP, its key drivers for future growth etc. q A company’s management, SWOT analysis, Financial Ratios etc.

�Thus, Fundamental analysis can be done on a specific country, sector and/or company, seperately or altogether. Process of fundamental analysis involves: � Country Analysis �Sector/Industry Analysis �Company Analysis

INTRODUCTION �Factors covered in this presentation are: v. Country analysis v Sector analysis v. Company Analysis
 � GDP RATE : 5. 30% (third quarter")
Country Analysis- India (courtesy: tradingeconomics. com) � GDP RATE : 5. 30% (third quarter of FY 12 -13) � PER CAPITA INCOME: 60, 603(+13. 64% in FY 12 -13) � OUTLOOK: Stable (November 2012, by Moody’s) � BALANCE OF TRADE: Trade surplus of 2277. 96 INR billion in November 2012. � INTEREST RATE: 8 % (September 2012) � INFLATION RATE: 7. 24 % (November 2012) � POPULATION OF INDIA IN 2011: 1, 210, 193, 422 (1. 21 BILLION) � BUSINESS CONFIDENCE: BUSINESS CONFIDENCE IN INDIA DECREASED TO 126. 60 IN THE THIRD QUARTER OF 2012 FROM 134. 90 IN THE SECOND QUARTER OF 2012. � CONSUMER CONFIDENCE: CONSUMER CONFIDENCE IN INDIA REMAINED AT 119 POINTS IN Q 3 2012 � 9. 4% IS UNEMPLOYMENT RATE AS PER 2011
 sector in India is one of the")
Sector Analysis-FMCG �Fast moving consumer goods (FMCG) sector in India is one of the largest sectors in the economy with estimated total market size of around USD 13 billion as of 2012. �This sector is expected to grow to a USD 33 billion industry by 2015. �This sector is characterized by following features: v MNCs presence v Unorganized segment (popular in rural segments) v Less capital requirement v Nano marketing (packaging in small size) v Adaptable to Changing lifestyle

Highlights. . . �Indian FMCG sector is the fourth largest sector in the economy �Easy availability of important raw materials, cheaper labor costs and presence across the entire value chain gives India a competitive advantage. �However, access level and per capita consumption in many product categories is very low compared to world average standards representing the unexploited market potential. �Growing Indian population, particularly the middle class and the rural segments, presents the huge available opportunity to FMCG players. �Distribution of smaller pack sizes, innovations like single use sachets to reach out to the rural section of the economy is gaining demand. Innovative products to cater to regional consumers is also benefiting in growth of the industry.

Key growth drivers to the Industry are as follows: • • • Robust growth in India’s GDP Growing urbanization Evolving consumer life style Increased income in rural areas Spending Pattern Changing Profile and Mind Set of Consumer

Some of the challenges this sector is likely to face are: �Increasing rate of inflation, which is likely to lead to higher cost of raw materials. �The standardization of packaging norms that is likely to be implemented by the Government by Jan 2013 is expected to increase cost of beverages, cereals, edible oil, detergent, flour, salt, aerated drinks and mineral water. �Steadily rising fuel costs, leading to increased distribution costs. �The present slow-down in the economy may lower demand of FMCG products, particularly in the premium sector, leading to reduced volumes. �The declining value of rupee against other currencies may reduce margins of many companies, as Marico, Godrej Consumer Products, Colgate, Dabur, etc who import raw materials

SWOT ANALYSIS: FMCG SECTOR • Low operational costs • Presence of established Strengths distribution networks in both urban and rural areas • Presence of well-known brands in FMCG sector

• Lower scope of investing in technology and Weaknesses achieving economies of scale, especially in small sectors • Low exports levels

• Untapped rural market, changing life style Opportunities • Rising income levels, i. e. increase in purchasing : power of consumers • High consumer goods spending

Threats • Removal of import restrictions resulting in replacing of domestic brands • Tax and regulatory structure • Rural demand is cyclical in nature and also depends upon monsoon

OVERALL OUTLOOK �The FMCG sector has a great opportunity for growth in the country, with the growing population, the rising disposable incomes, education, urbanization, the advent of modern retail, and a consumption-driven society. � There is a potential for all the FMCG companies as the per capita consumption of almost all products in the country is very low compared to world standards, thus there exist huge untapped opportunities for the sector to perform its best. . . THE TOP 10 COMPANIES IN FMCG SECTOR 1. Hindustan Unilever Ltd. 7. Emami 2. ITC (Indian Tobacco Company) 8. Cadbury India 3. P & G 9. Britania industries 4. Nestlé India 10. Marico Industries 5 GCMMF (AMUL) 6. Dabur India
 Market Capitalization – (Rs in crore): 151, 078 �ITC")
ITC profile (Indian tobacco Company) Market Capitalization – (Rs in crore): 151, 078 �ITC is one of India's foremost private sector companies with a market capitalization of US $ 35 billion and a turnover of US $ 7 billion. �ITC is rated among the World's Best Big Companies, Asia's 'Fab 50' and the World's Most Reputable Companies by Forbes magazine and among India's Most Valuable Companies by Business Today. �ITC ranks among India's '10 Most Valuable (Company) Brands', in a study conducted by Brand Finance and published by the Economic Times. �ITC was formerly known as Imperial Tobacco Company.

ITC profile contd… �ITC also ranks among Asia's 50 best performing companies compiled by Business Week. �ITC has a diversified presence in FMCG, Hotels, Paperboards & Specialty Papers, Packaging, Agri. Business, and Information Technology. While ITC is an outstanding market leader in its traditional businesses of Cigarettes, Hotels, Paperboards, Packaging and Agri-Exports, it is rapidly gaining market share even in its growing businesses of Packaged Foods & Confectionery, Branded Apparel, Personal Care and Stationery.

VISION AND MISSION of ITC ltd. �VISION: Sustain ITC's position as one of India's most valuable corporations through world class performance, creating growing value for the Indian economy and the Company's stakeholders �MISSION: To enhance the wealth generating capability of the enterprise in a globalising environment, delivering superior and sustainable stakeholder value.

PRODUCTS BY ITC ltd.

ITC ltd: TIMELINE history post 2000 till Date. . . � 2000 : ITC entered the business of production of Greeting 2000 cards, Gift articles and other stationary products. � 2002: Paper Kraft was originally launched; Also ITC 2002 Launched lifestyle retailing company ‘JOHN PLAYERS’ by end of 2002. � 2003: Sunfeast was launched; besides products like 2003 Mangaldeep agarbattis, Aim matches were launched as well. � 2004: ITC ranked among top 8 in Forbes “A”. 2004
 � 2005: Essenza Di wills was launched 2005 � 2007:")
TIMELINE(contd. . . ) � 2005: Essenza Di wills was launched 2005 � 2007: Fiama Di wills soap was launched; also Classmate 2007 notebooks were launched. � 2008: Modifications were brought in Paper Kraft; they were made 2008 eco friendly � 2008: Superia, Vivel Di wills and a range of Vivel shampoos and 2008 soaps were launched. � 2012: ITC to enter Dairy sector (said by Chairman Y C Deveshwar 2012 {in ET, jul 2012})
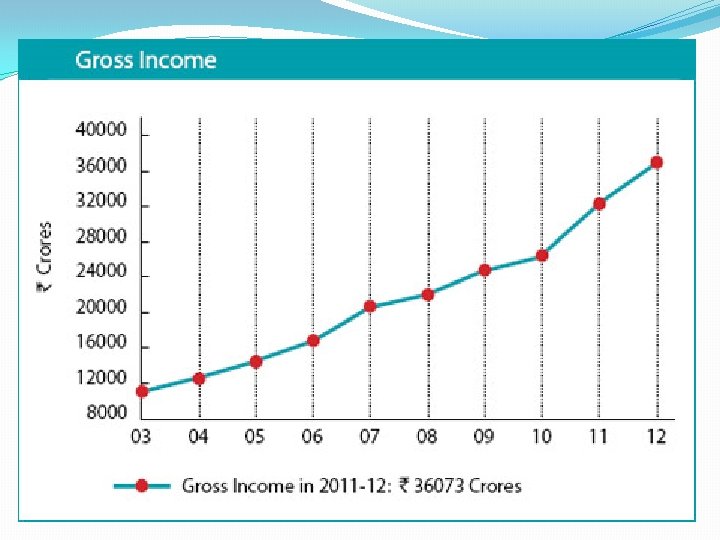
 (source: money. livemint. com) Operational")
Ratios (Mar ‘ 12 in comparison with Mar’ 11) (source: money. livemint. com) Operational & Financial Ratios �Earnings Per Share (Rs) 7. 88 (in 2011: 6. 45) �DPS(Rs) 4. 50 (in 2011: 4. 45) � Tax Rate(%) 30. 74 (in 2011: 31. 38) Performance ratio � Asset Turnover 1. 30 times (in 2011: 2. 03 times) �Sales/Fixed Asset 2. 62 times (in 2011: 2. 49 times) �Working Capital/Sales 6. 60 times (in 2011: 5. 44)
 �")
Efficiency Ratios �Debtors Turnover Ratio 9. 69 Times (in 2011: 10. 41 times) � Stock Turnover Ratio 56. 47 Times (in 2011: 58. 14 times) �Creditors Turnover Ratio 33. 95 Times (in 2011: 65. 68 times) Financial Stability Ratios � Total Debt/Equity 0. 00 (in 2011: 0. 01) � Current Ratio 1. 59 (in 2011: 1. 07) � Quick Ratio 0. 97 (in 2011: 0. 45)
 17. 31 (in 2011: 18. 21) �EBIT Growth(%) 22.")
Growth Ratio �Net Sales Growth(%) 17. 31 (in 2011: 18. 21) �EBIT Growth(%) 22. 29 (in 2011: 20. 48) � PAT Growth(%) 23. 55 (in 2011: 22. 82) � EPS Growth(%) 22. 29 (in 2011: -39. 40)
 will continue to see growth as it depends on an")
Conclusion This sector (FMCG) will continue to see growth as it depends on an ever-increasing internal market for consumption, and demand for these goods remains more or less constant, irrespective of recession or inflation. Hence this sector will grow, though it may not be a smooth growth path, due to the present world-wide economic slowdown, rising inflation and fall of the rupee. This sector will see good growth in the long run and hiring will continue to remain robust.

Thank you
- Slides: 26