FUNDAMENTAL ANALYSIS Dr Manish Dadhich What is Fundamental


 • GDP is one of the core indicators of the")
 The broad components of GDP are: a) consumption b) Investment")
 represent roughly 2/3 of GDP. By monitoring")


 • CPI IS An index designed to measure the change")


 – Start-up stage: many")
")

 • Profitability (trend) • Product")


")


")
: (Net income after taxes – preferred dividends)/")

- Slides: 51
FUNDAMENTAL ANALYSIS Dr. Manish Dadhich
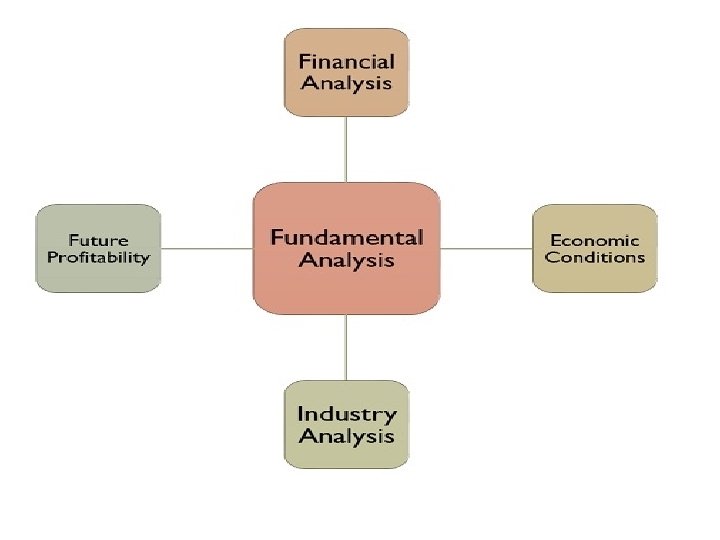
What is 'Fundamental Analysis' • Fundamental analysis is a method of evaluating a security in an attempt to measure its intrinsic value, by examining related economic, financial and other qualitative and quantitative factors. • Fundamental analysts study anything that can affect the security's value, including macroeconomic factors • such as the overall economy and industry conditions, and microeconomic factors such as financial conditions and company management.
What is 'Fundamental Analysis' • The end goal of fundamental analysis is to produce a quantitative value that an investor can compare with a security's current price, thus indicating whether the security is undervalued or overvalued.
WHAT IS FUNDAMENTAL ANALYSIS? • Fundamental analysis is the examination of the underlying forces that affect the well being of the economy, industry groups, and companies. • The most common way that fundamental analysis is done in is in three steps:
Technical Analysis • Technical Analysis is used to forecast the price of a share, which says that the price of a share of the company is based on the interaction of demand supply forces, operating in the marketplace. • It is used to forecast the future market price of the stock, as per the past performance statistics of the share. For this purpose, first of all, the changes in the price of the stock are ascertained, to know how the price will change in future.
BASIS FOR COMPARISON FUNDAMENTAL ANALYSIS TECHNICAL ANALYSIS Meaning Fundamental Analysis is a practice of analyzing securities by determining the intrinsic value of the stock. Technical analysis is a method of determining the future price of the stock using charts to identify the patterns and trends. Relevant for Long term investments Short term investments Function Investing Trading Objective To identify the intrinsic value of the stock. To identify the right time to enter or exit the market. Decision making Decisions are based on the information available and statistic evaluated. Decisions are based on market trends and prices of stock. Focuses on Both Past and Present data. Past data only. Form of data Economic reports, news events and industry statistics. Chart Analysis Future prices Predicted on the basis of past and present performance and profitability of the company. Predicted on the basis of charts and indicators. Type of trader Long term position trader. Swing trader and short term day trader.
Economic Industry Company Analysis • In security selection process, a traditional approach of Economic Industry Company analysis is employed. EIC analysis is the abbreviation of economiac, industry and company. The person conducting EIC analysis examines the conditions in the entire economy and then ascertains the most attractive industries in the light of the economic conditions. At last the most attractive companies within the attractive industries are pointed out by the analyst.
Top-down
bottom-up approach
fundamental analysis is done in three steps 1. Economic Analysis: • The first step to this type of analysis includes looking at the macroeconomic situation. • GDP • growth rates • Inflation • interest rates • exchange rates, • productivity • energy prices.
• Analyze the state of the world economy • Pick certain asset classes that will outperform others • Pick geographic locations • Narrow to industry analysis
2. Industry Analysis • The SECOND step taken in FUNDAMENTAL analysis is looking at the industry as a whole which includes industry analysis looks at a) total sales b) price levels c) competition and their effects d) Foreign competition e) any entrances or exits from the industry
3. Company Analysis: • Last in this process of studying the fundamentals includes looking at the company individually • This includes looking at: a) unit sales b) prices c) new products d) earnings and e) Any chance of debt or equity occurring
1. Economic analysis • The economy is like the tide and the various industry groups and individual companies are like boats • When the economy expands, most industry groups and companies benefit and grow. • When the economy declines, most sectors and companies usually suffer • Many economists link economic expansion and contraction to the level of interest rates. • Interest rates are seen as a leading indicator for the stock market as well.
GROSS DOMESTIC PRODUCT (GDP) • GDP is one of the core indicators of the current condition of a country's economy. • It measures the monetary value of all final goods and services produced over a specified period (one year) within the boundaries of a country. • Gross Domestic Product (GDP) is the broadest measure of economic activity; however it is only released quarterly
GROSS DOMESTIC PRODUCT (GDP) The broad components of GDP are: a) consumption b) Investment c) net exports d) government purchases e) and inventories.
PERSONAL CONSUMPTION • Personal consumption expenditures (PCE) represent roughly 2/3 of GDP. By monitoring retail sales, policy makers are able to make an assessment of the likely growth of PCE for the current and future quarters.
INFLATION • Is a general increase in prices in an economy and consequent fall in the purchasing power of money. • Economists distinguish between two types of inflation. a) Demand-pull inflation arises when the economy is trying to spend beyond its capacity to produce. b) Cost-push inflation is driven by increases in nominal wages and in the prices of non-wage inputs such as raw materials and energy.
INTEREST RATES • If there is an uncertainty in the market in terms of interest rates • then any developments regarding interest rates will usually have a direct and immediate effect on the currency market. • Generally, when a country raises its interest rates, it’s currency will strengthen in relation to other currencies around the world
INTEREST RATES • WHEN INTEREST RATES ARE HIGHER global assets will be shifted internationally by their owners to gain a higher return on their investments • Interest rate hikes are usually not good news for a nation’s internal stock markets because many investors within the country will withdraw money from a country's stock market to take advantage of the higher / more secure rate of return.
Consumer Price Index (CPI) • CPI IS An index designed to measure the change in price of a fixed market basket of goods and services. • The market basket of goods and services is representative of the purchases of a typical urban consumer. • The index is intended to measure price change only; attempts are made to remove changes in price resulting from changes in quality. • Whole price index (WPI) also plays a significant role in the economy.
CONSUMER PRICE INDEX • The rate of change of the CPI is one of the key measures of inflation for the U. S. economy. • Acceleration or deceleration of inflation may signal that a change in monetary policy may be appropriate
Industrial Production/Capacity Utilization INDEX • An index designed to measure changes in the level of output in the industrial sector of the economy. • The index is grouped by both products (consumer goods, business equipment, intermediate goods, and materials) and industry (manufacturing, mining, and utilities
Industrial Production/Capacity Utilization • The industrial sector of the economy represents only about 20% of GDP, because changes in GDP are heavily concentrated in the industrial sector, changes in this index provide a) useful information on the current growth of GDP. b) information on the overall level of resource utilization in the economy which may in turn provide information on the likely future course of inflation. c) Greater utilization will tend to increase inflation
Business Sales and Inventories • Total current-rupee sales and inventories for the manufacturing, wholesale, and retail sectors of the economy • The rate of inventory accumulation plays a key role a) in determining the current pace of economic growth b) provides useful clues about the future pace of growth as well. c) For example, i. if inventories are accumulating at a rapid pace, such that inventory sales ratios are rising, ii. it may portend a slowing of growth in the near future as firms cut production to bring inventories back into line with sales. iii. Vice versa, if inventories are growing slowly or actually falling, it may signal a future pickup in production.
S&P 500 Stock Index • S&p 500 is one of several indices designed to measure changes in price of a broad array of stocks. • The stock market is one measure of the current value of the nation's stock of capital and is often viewed as a barometer of business and consumer confidence regarding the future. • A high and/or rising stock market may signal robust growth of business investment and consumer spending in the near future • while a low and/or falling stock market may signal sluggish spending. For this reason, the S&P 500 is 1 component of the Index of Leading Indicators.
EMPLOYMENT • The unemployment rate represents the percentage of employable individuals who are actively looking for work within the county. • Unemployment has been a persistent problem in industrial economies during economic slowdowns over the last 200 years and is therefore used as a primary indicator of the health of an economy. • In most cases, statistics are based on the number of people claiming unemployment benefits. A certain level of unemployment is considered to be unavoidable due to (1) structural changes in an economy (2) workers who are voluntary switching jobs. This unavoidable level of unemployment is called the natural level of unemployment.
International TRADE • The trade balance portrays the net difference (over a period of time) between the imports and exports of a nation. • When a nation imports more than it exports, the trade balance shows a deficit. • Although this is for the most part considered unfavorable, a deficit in and of itself is not necessarily a bad thing.
Global economic analysis • Over view: • Growth in the WORLD economy has resumed after the most virulent recession in decades. • Recession caused by world financial meltdown triggered by the subprime loan problem
World economic recovery continued • The recovery is driven by i. exceptionally strong demand-supporting policy measures. ii. public interventions in financial markets iii. a strong pick-up in demand in the industrial world iv. a positive contribution from inventory adjustment
Upward and downward risks are broadly balanced • Better economic prospects and stronger business investment driven by better financial conditions reducing concerns about the health of financial institutions which in turn improving financial conditions, and thereby growth, still further. • On the other hand, financial conditions could worsen abruptly, for example, if a large financial institution were to get into difficulty
Fiscal policy. • Its govt. revenue and expenditure policy. Currently all western world fiscal policy is that of stimulating the economy • Policy stimulus measures already decided need to be implemented fully. • However, as the recovery gathers strength, the focus needs to shift from supporting aggregate demand to consolidating budgets.
2. Industry Analysis • Classifying industries – Cyclical industry - performance is positively related to economic activity – Defensive industry - performance is insensitive to economic activity – Growth industry - characterized by rapid growth in sales, independent of the business cycle
Industry Analysis • Industry Life Cycle Theory: – Birth (heavy R&D, large losses - low revenues) – Growth (building market share and economies of scale) – Mature growth (maximum profitability) – Stabilization (increase in unit sales may be achieved by decreasing prices) – Decline (demand shifts lead to declining sales and profitability - losses)
Industry Analysis • Life Cycle of an Industry (Marketing view) – Start-up stage: many new firms; grows rapidly (example: genetic engineering) – Consolidation stage: shakeout period; growth slows (example: video games) – Maturity stage: grows with economy (example: automobile industry) – Decline stage: grows slower than economy (example: railroads)
Industry Analysis • Qualitative Issues – Competitive Structure – Permanence (probability of product obsolescence) – Vulnerability to external shocks (foreign competition) – Regulatory and tax conditions (adverse changes) – Labor conditions (unionization)
Industry Analysis • End use analysis – identify demand for industry’s products – estimates of future demand – identification of substitutes • Ratio analysis – examining data over time – identifying favorable/unfavorable trends • Regression analysis – determining the relationship between variables
3. Company Analysis: Qualitative Issues • Sales Revenue (growth) • Profitability (trend) • Product line (turnover, age) – Output rate of new products – Product innovation strategies – R&D budgets • Pricing Strategy • Patents and technology
3. Company Analysis: Qualitative Issues • Organizational performance – Effective application of company resources – Efficient accomplishment of company goals • Management functions – Planning - setting goals/resources – Organizing - assigning tasks/resources – Leading - motivating achievement – Controlling - monitoring performance
3. Company Analysis: Qualitative Issues • Evaluating Management Quality – Age and experience of management – Strategic planning • Understanding of the global environment • Adaptability to external changes – Marketing strategy • Track record of the competitive position • Sustainable growth • Public image – Finance Strategy - adequate and appropriate – Employee/union relations – Effectiveness of board of directors
3. Company Analysis: Quantitative Issues • Operating efficiency – Productivity – Production function • Importance of Q. A. – Understanding a company’s risks • Financial, operating, and business risks • Financial Ratio Analysis – Past financial ratios – With industry, competitors, and • Regression analysis – Forecast Revenues, Expenses, Net Income – Forecast Assets, Liabilities, External Capital Requirements
An Adage “Financial statements are like fine perfume; To be sniffed but not swallowed. ”
Company Analysis: Quantitative Issues • Balance Sheet – Snapshot of company’s Assets, Liabilities and Equity. • Income statement – Sales, expenses, and taxes incurred to operate – Earnings per share • Cash flow statement – Sources and Uses of funds • Are financial statements reliable? – G. A. A. P. vs Cleverly Rigged Accounting Ploys
Company Analysis: Quantitative Issues • Financial Ratio Analysis – Liquidity (ability to pay bills) – Debt (financial leverage) – Profitability (cost controls) – Efficiency (asset management) • Du. Pont Analysis – Top-down analysis of company operations – Objective: increase ROE
Liquidity Ratios • Measure ability to pay maturing obligations • Current ratio – Current assets / current liabilities • Quick ratio – (Current assets less inventories) / current liabilities
Debt Ratios • Measure extent to which firm uses debt to finance asset investment (risk attribute) • Debt-equity ratio – Total long-term debt / total equity • Total debt - total assets ratio – (Current liabilities + long-term debt) / total assets • Times interest earned – EBIT / interest charges • Fixed charge coverage ratio – (EBIT + Lease Exp. ) / (Int. Exp. + Lease Exp. )
Profitability Ratios • Measure profits relative to sales • Gross profit margin ( % ) = Gross profit / sales • Operating Profit Margin = Operating profits / sales • Net profit margin = Net profit after taxes / sales • ROA = Net Profit / Total Assets • ROE = Net Profit / Stockholder Equity* * Excludes preferred stock balances
Efficiency Ratios • Measure effectiveness of asset management • Average collection period (in days) – Average receivables / Sales per day • Inventory turnover (times per year) – Cost of Goods Sold / average inventory • Total asset turnover – Sales / average total assets • Fixed asset turnover – Sales / average net fixed assets
Other Ratios • Earnings per share (EPS): (Net income after taxes – preferred dividends)/ number of shares • Price-earnings (P/E): Price per share/expected EPS • Dividend yield: Indicated annual dividend/price per share • Dividend payout: Dividends per share/EPS • Cash flow per share: (After-tax profits + depreciation and other noncash expenses)/number of shares • Book value per share: Net worth attributable to common shareholders/number of shares
Thx