Functional Plant Bioinformatics Ch IPSeq data analysis coexpression

Functional Plant Bioinformatics Ch. IP-Seq data analysis & co-expression analysis 14 -15 September, 2017 1 Klaas Vandepoele

Experimental analysis of gene expression & regulatory interactions ENCODE; Sullivan et al. , 2015
 Mejia-Guerra et al. , 2012")
Mapping of Gene Regulatory Networks (GRNs) Mejia-Guerra et al. , 2012
 and target genes SELEX PBM")
Experimental characterization of regulatory interactions between Transcription Factors (TFs) and target genes SELEX PBM Ch. IP-Seq EMSA Y 1 H Mejia-Guerra et al. , 2012

Ch. IP-Seq: measuring TF protein-DNA interactions Ch. IP • in vivo method to measure protein-DNA interactions using chromatin immunoprecipitation • Different cellular conditions can be profiled • Requires TF-specific antibody* * Tagged TF protein can also be used TF Ch. IP-Seq Furey et al. , 2012

TF Ch. IP-Seq processing • • Reliable peak calling Modelling TF binding site Farnham, 2009

Peak / Motif Read pileup Control Reads sample Gene annotation Output Ch. IP-Seq peak calling procedure displayed in genome browser Position Weight Matrix (PWM)

Detection binding site profiled TF de novo motif finding– RSAT Peak. Motifs Identifies overrepresented motifs in peak sequences • • • motif composition (PWM) - 6 localization relative to peak center compares discovered motifs with reference motifs E 2 F motif mapping (WTTSSCSS / TTTSSCGC) peaks with E 2 F motif (%) E 2 F motif peaks TCh. AP 2598 730 (28, 1) Random occurrence E 2 F motif genes = 4, 34% 8

Ch. IP-Seq peak annotation 9
 1. Perform a transcript profiling experiment")
From binding to TF regulation (to biological discovery) 1. Perform a transcript profiling experiment where the TF of interest is perturbed • (inducible) overexpression • knock out (T-DNA, mutant, CRISPR) 2. Identify Up and Down-regulated genes (Differential Expression [DE]) Biological questions • Which genes, pathways or biological processes are regulated by TF of interest? • Which genes of a multi-gene family are (not) regulated by a specific TF? • Can we identify signaling cascades downstream of a specific TF? • Is there evidence for indirect regulation in the TF regulated genes? Santuari et al. , 2016 10
: genes with similar gene expression")
Co-expression as a gene prioritization strategy • Guilt-by-association (GBA): genes with similar gene expression profiles may share similarity in regulation & function • Identify candidate genes for follow-up experiments • Study differentially expressed genes or Ch. IP targets - • (co-)expression delineate functionally coherent clusters detect cis-regulatory elements Learn more about the specific roles of genes belonging to a certain GO category Serin et al. , 2016

Co-expression Network Analysis • Features Integration heterogeneous data sources • Different gene-gene associations with varying quality Exploit network-guided guilt-byassociation principle Methodologies • Simple un-weighted/weighted graphs • Probabilistic models

Plant co-expression analysis tools 13 Serin et al. , 2016

Measures of co-expression Gene A Gene C Expression value Gene A Gene B High correlation coefficient Pearson correlation coefficient: (range: -1, 0, 1) Low correlation coefficient
: measures similarity in shape of the")
Other measures of co-expression Pearson correlation coefficient (PCC): measures similarity in shape of the expression profiles Spearman correlation coefficient (SCC): similar as PCC but on ranks instead of expression values Highest Reciprocal Ranks (HRR): Maximum of the two ranks (based on PCC) AB and BA HRR(AB)=max(r(AB), r(BA)) Mutual rank: geometric average of the two ranks (based on PCC) AB and BA MR(AB) = √ (Rank(A→B) x Rank(B→A))

Guide-gene approach 0 Non-targeted approach Cellulose synthase, CESA 3 Cellulose synthase, CESA 1 Cellulose synthase, CESA 6 COBRA Transporter-related Dehydration-responsive like Chitinase-like protein 1 (CTL 1) Glycerophosphoryl diester pho. . . Dehydration-responsive like Cellulose synthase, CESA 2 Phosphate translocator-related Endomembrane protein 70 Glycosyl transferase family 8 p. . . Expressed protein Squalene monooxygenase Glycosyl transferase family 2 p. . . Dehydration-responsive protein LMBR 1 integral membrane pro. . . Leucine-rich repeat protein kin. . . Expressed protein Mitogen-activated protein kina. . . Glycosyl transferase family 2 p. . . Expressed protein Tubulin α-3 (TUA 5) Phosphoglycerate/bispho. . . Zinc finger family protein Expressed protein S-adenosylmethionine synthet. . . Endomembrane protein 70, pu. . . COP 1 -interacting protein 7 (CI. . . Protein kinase family protein Endo-1, 4 -β-glucanase (KORR) C 2 domain-containing protein Expressed protein Methyltetrahydropteroyltriglu. . . WD-40 repeat family protein b. ZIP transcription factor, putat. . . Rhomboid family protein Glycosyl transferase family 2 p. . . Rank score 450 400 Score Integration stress cis-regulatory elements Pvalue* 350 300 250 50 200 150 30 40 100 20 50 10 Ma and Bohnert, 2007 0 -log(p-value; 10) Examples of Plant Coexpression approaches Persson et al. , 2005 80 70 60

https: //bioinformatics. psb. ugent. be/cornet/
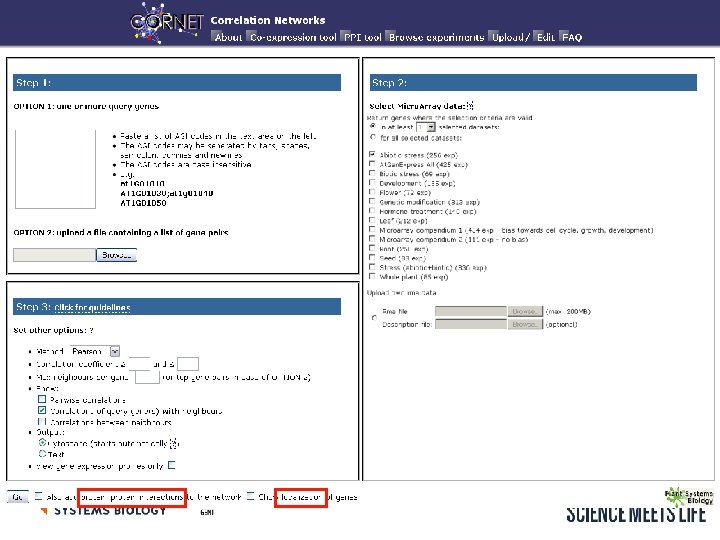

Co-expression and protein-protein interaction network
- Slides: 19