Functional Mapping and Annotation of GWAS FUMA Danielle

")


- Slides: 52
Functional Mapping and Annotation of GWAS: FUMA Danielle Posthuma Dept. Complex Trait Genetics, VU University Amsterdam //danielle/2017/FUMA_dp. ppt Boulder, TC 31, March 8 2017
S Ripke et al. Nature (2014)
Regulation & control Protein Translation RNA Transcription DNA Physical & chemical environment
Interpreting the effect of SNPs on gene-products SNPs can act to - alter the protein or RNA structure - alter the protein or RNA level SNPs can be located - in genes - outside genes
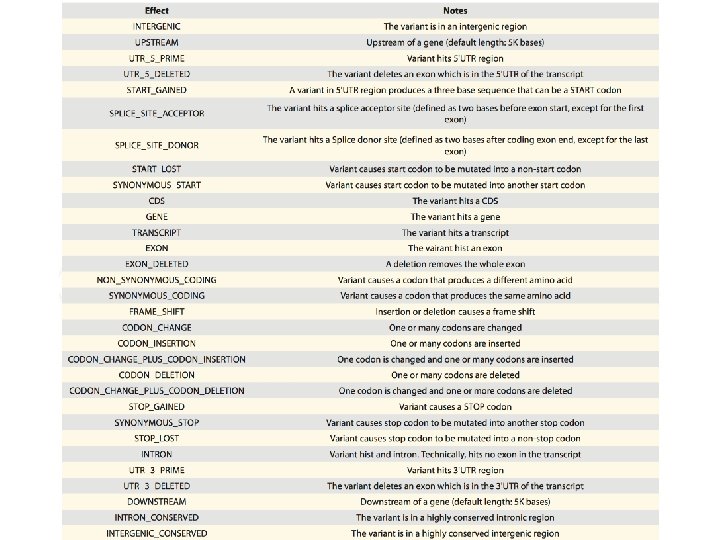
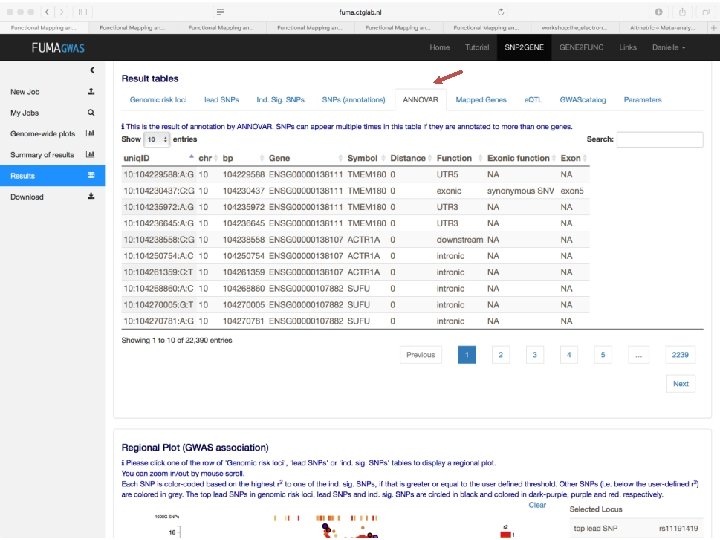
Functional categories of SNPs • Protein Coding – SNPs in exonic regions may alter protein structure and/or function e. g nonsense SNPs or missense SNPs • Splicing Regulation – SNPs in splice sites may disrupt splicing regulation, resulting in exon skipping or intron retention – They can also interfere with alternative splicing regulation by changing exonic splicing enhancers or silencers. • Transcriptional Regulation – SNPs in transcription regulatory regions (e. g. transcription factor binding sites, Cp. G islands, micro. RNAs, etc. ) can alter binding sites, and thus disrupt proper gene regulation. • Post-Translational Modification – SNPs in protein-coding regions may alter post-translational modification sites, interfering with proper posttranslational modification.
Example SNP effect G healthy T disease This is a ‘stop-gained’ SNP
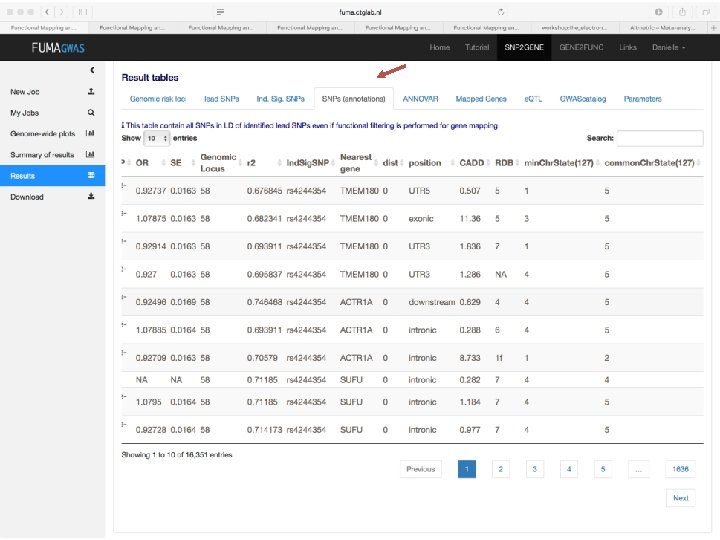
CADD scores Combined Annotation Dependent Depletion Score • CADD is a tool for scoring the deleteriousness of SNPs as well as insertion/deletions variants in the human genome. • A scaled CADD score >=10 indicates that these SNPs are predicted to be the 10% most deleterious substitutions; a score >=20 indicates the 1% most deleterious
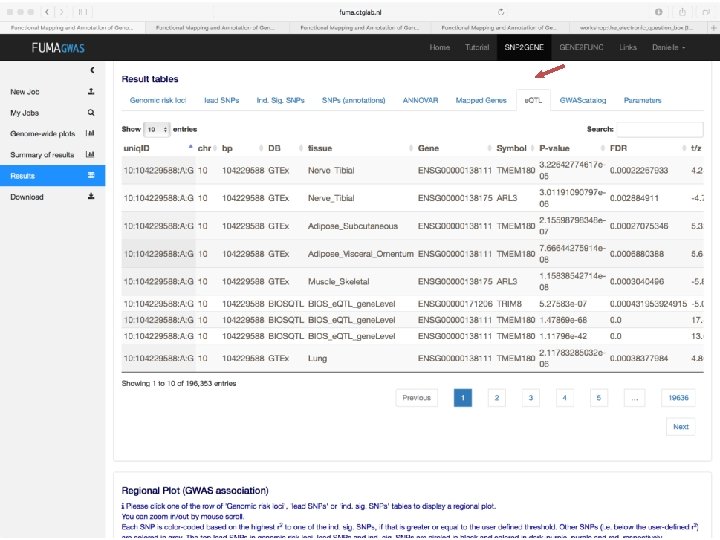
Expression QTLs Alexandra C. Nica, and Emmanouil T. Dermitzakis Phil. Trans. R. Soc. B 2013; 368: 20120362 © 2013 The Author(s) Published by the Royal Society. All rights reserved.
The same regulatory regions and variant could be an e. QTL for gene 2 in (a) tissue 1 and for gene 1 in (b) tissue 2, suggesting that limited interrogation of tissues would be misleading for the biological signal underlying disease. Alexandra C. Nica, and Emmanouil T. Dermitzakis Phil. Trans. R. Soc. B 2013; 368: 20120362 © 2013 The Author(s) Published by the Royal Society. All rights reserved.
Regulome. DB score Score 1 a 1 b 1 c 1 d 1 e 1 f 2 a 2 b 2 c 3 a 3 b 4 5 6 Supporting data e. QTL + TF binding + matched TF motif + matched DNase Footprint + DNase peak e. QTL + TF binding + any motif + DNase Footprint + DNase peak e. QTL + TF binding + matched TF motif + DNase peak e. QTL + TF binding + any motif + DNase peak e. QTL + TF binding + matched TF motif e. QTL + TF binding / DNase peak TF binding + matched TF motif + matched DNase Footprint + DNase peak TF binding + any motif + DNase Footprint + DNase peak TF binding + matched TF motif + DNase peak TF binding + any motif + DNase peak TF binding + matched TF motif TF binding + DNase peak TF binding or DNase peak other
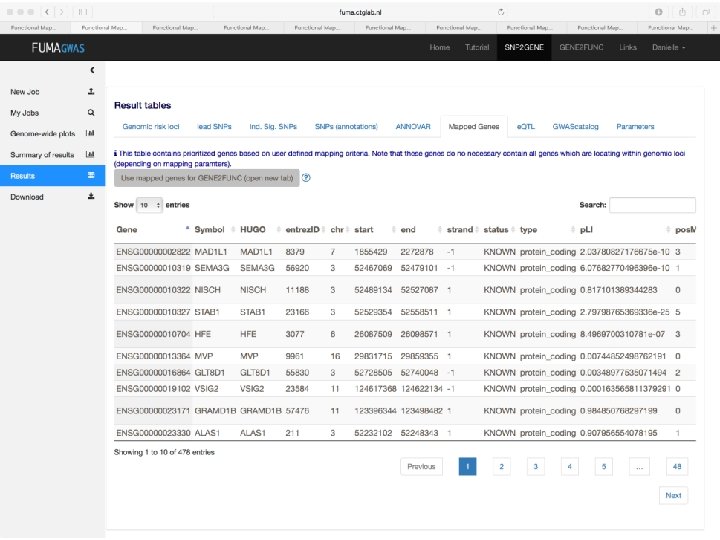
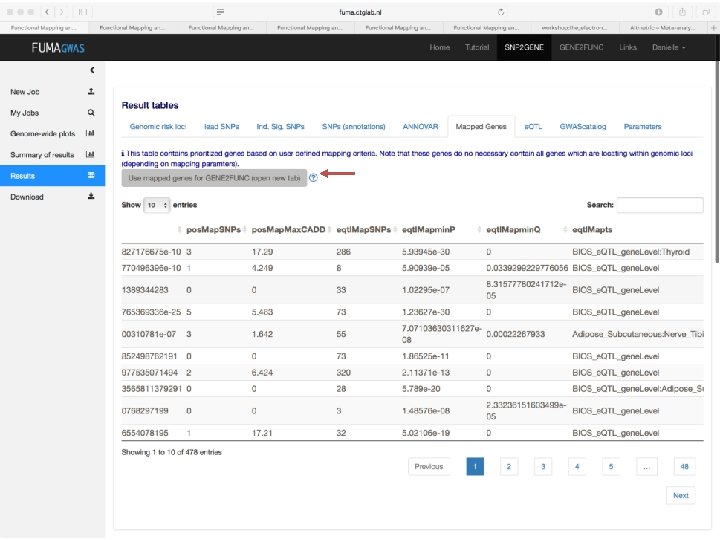
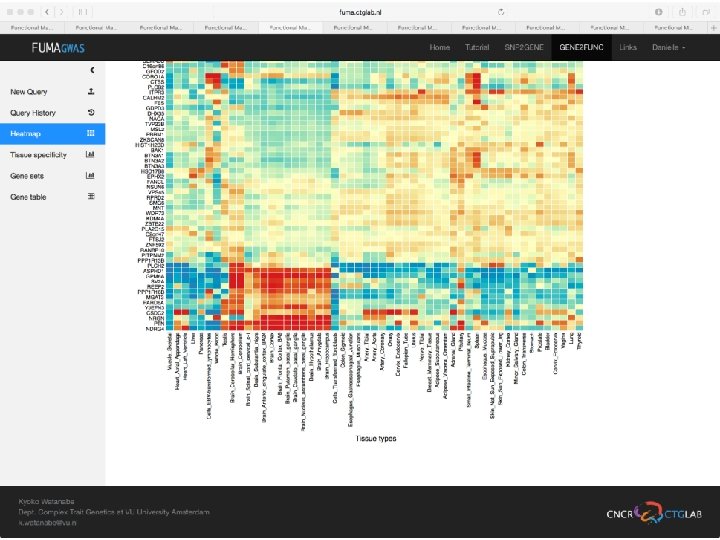
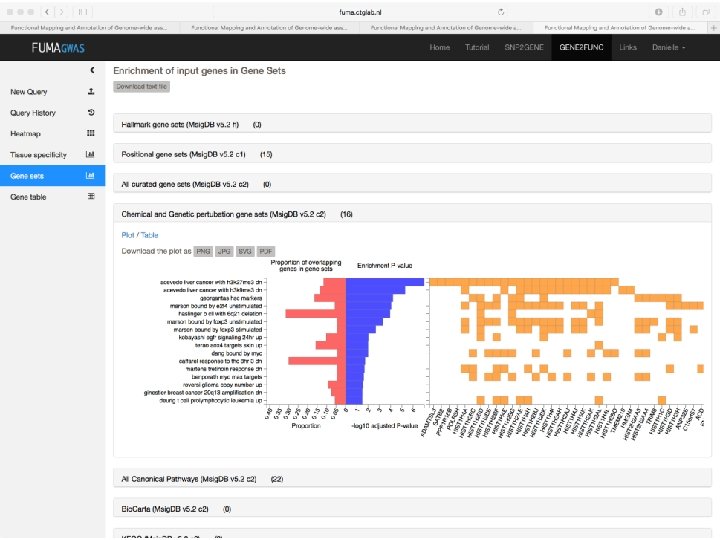
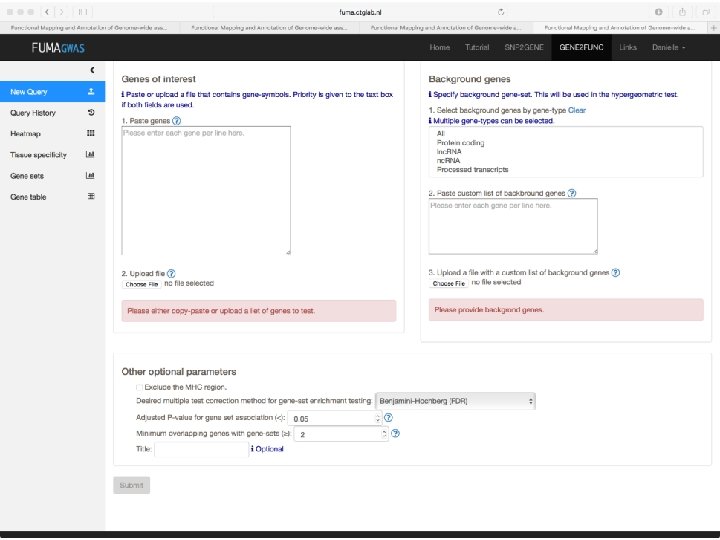
SNP annotation implicates genes • Explore gene function • Explore pathway enrichment of implicated genes • Explore in which tissue gene is expressed
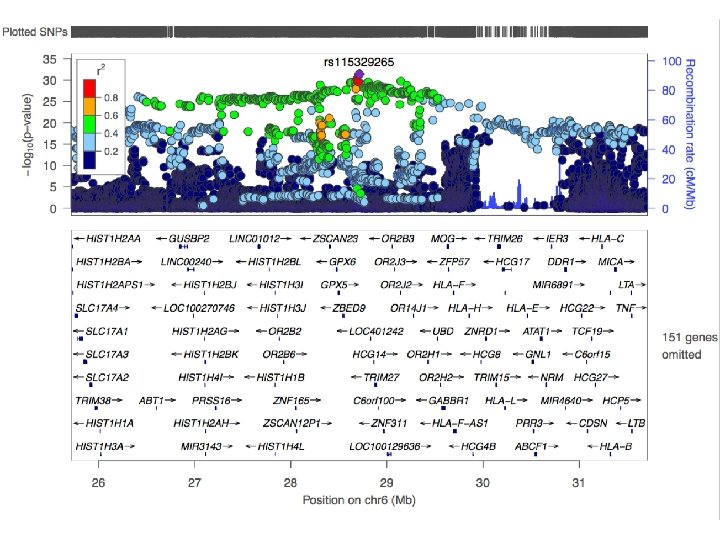
How to pinpoint causal genes based on GWAS? § Are there functional variants in the GWAS risk loci? §Answers to these questions will Are there regulatory variants or e. QTLs in the GWAS risk loci? generate hypotheses for functional § Are there SNPS with high CADD scores or low Regulome. DB scores? follow-up experiments to investigate § Where are the genes expressed that lie in causality the risk loci? § What are the implicated pathways?
Combine functional annotation information from different resources § Many different repositories § Need knowledge of how to normalize/interpret data § Output can be huge, need visualizations for interpretation
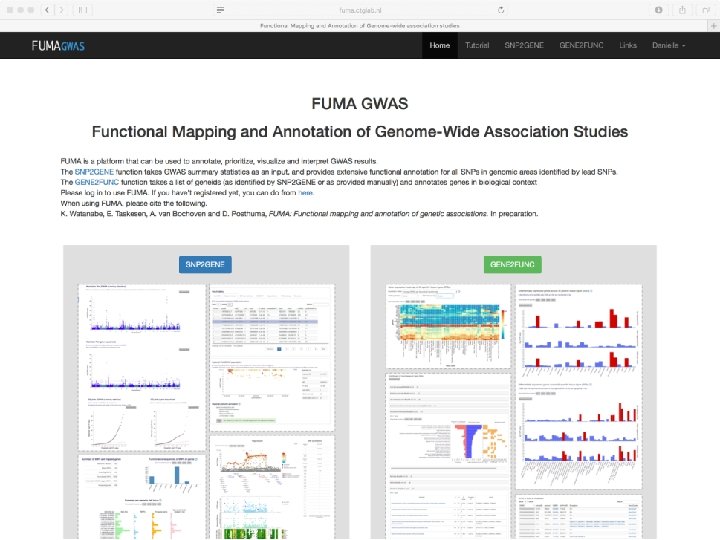
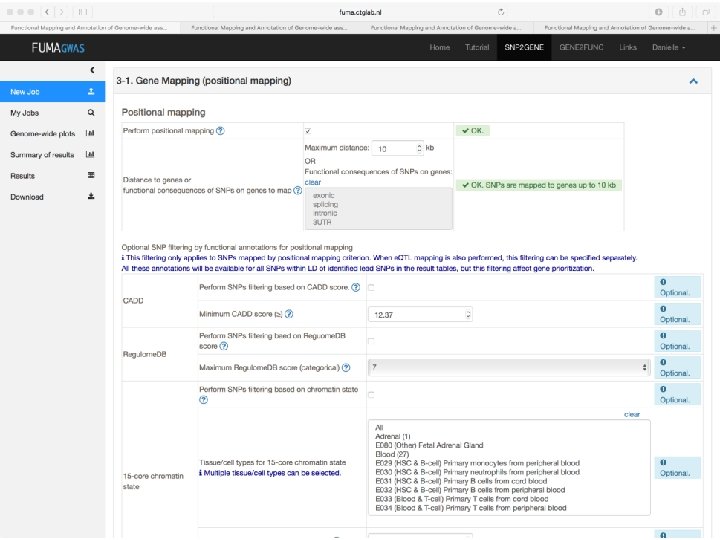
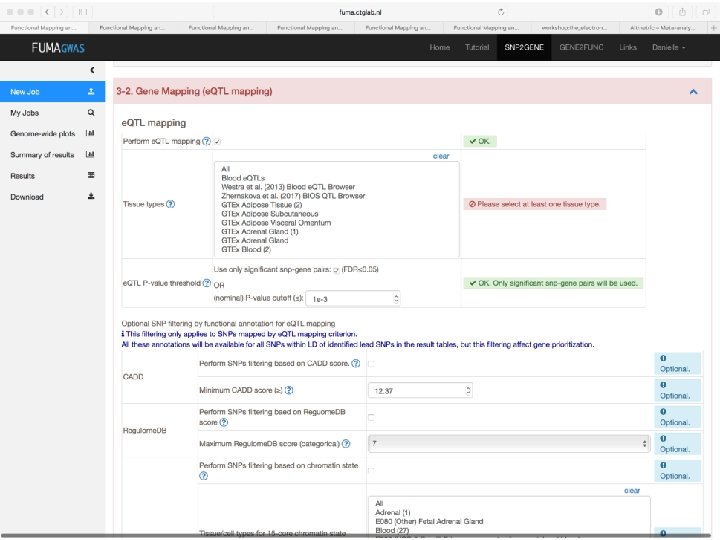
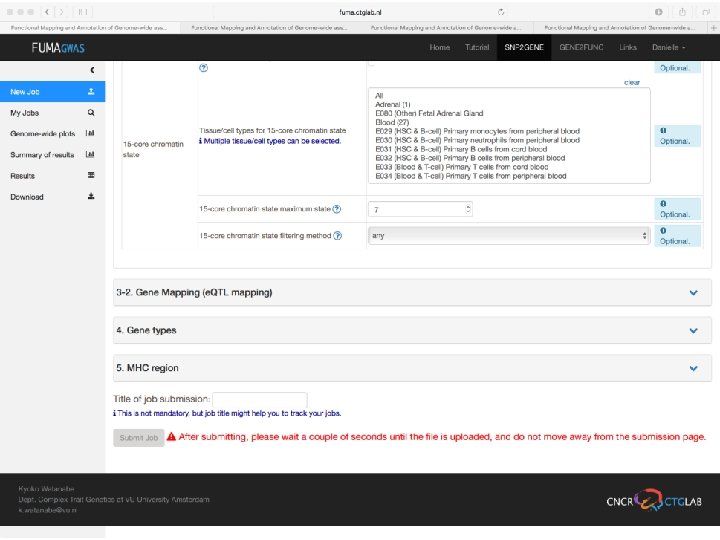
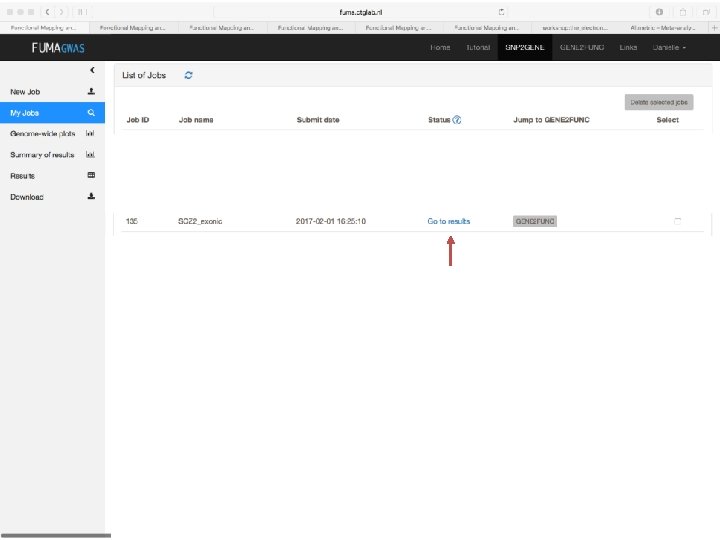
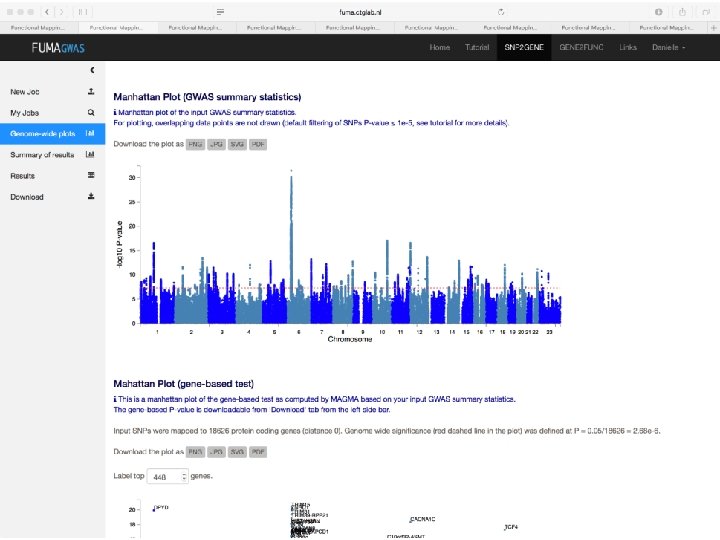
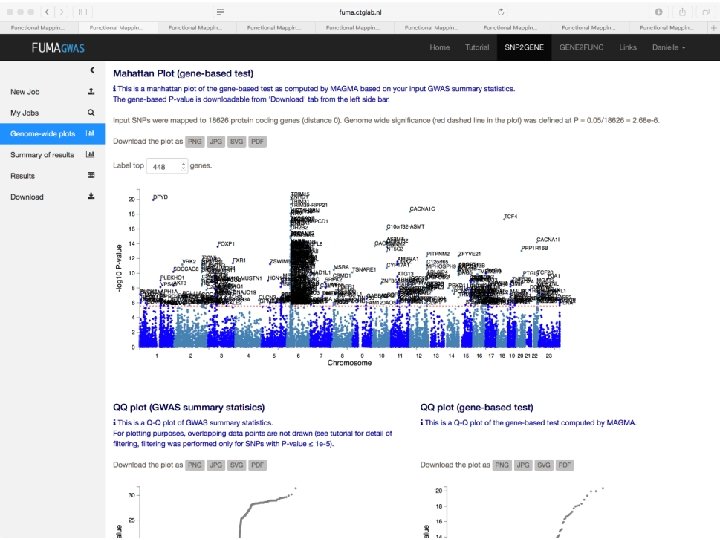
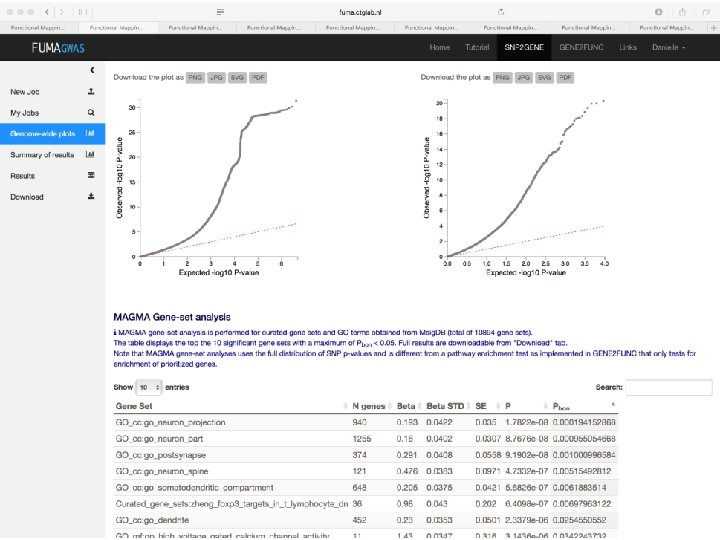
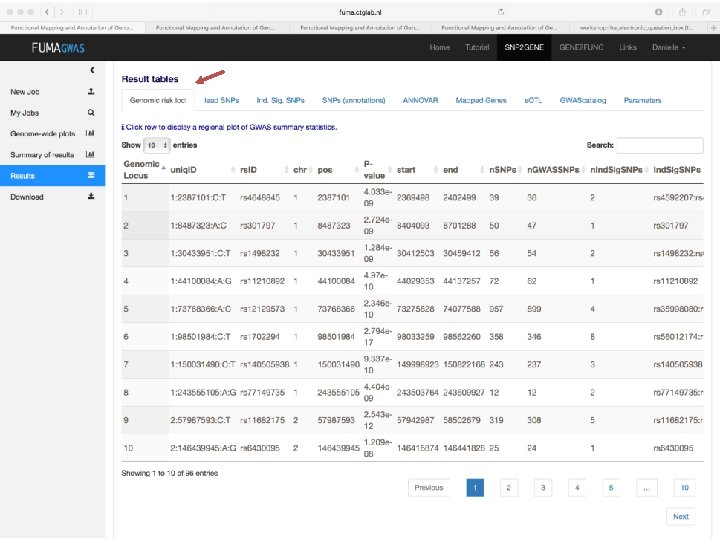
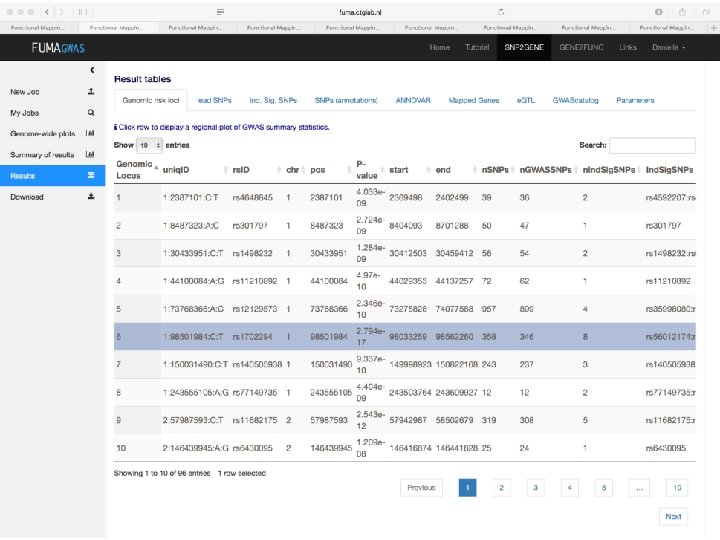
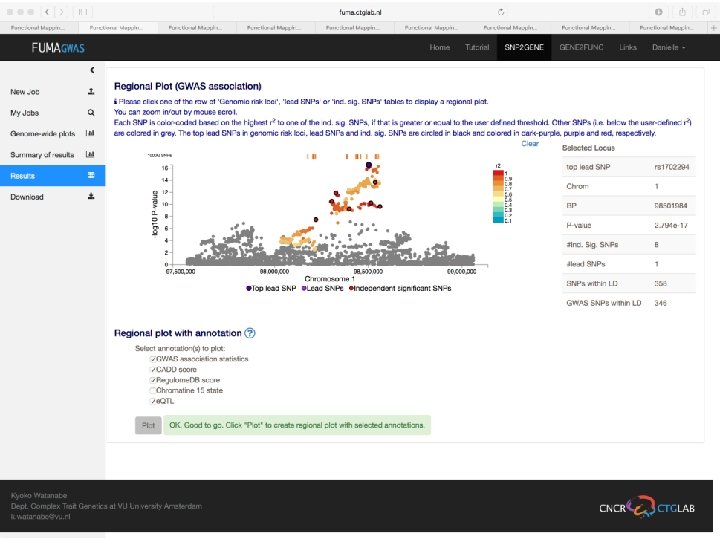
FUMA developed by Kyoko Watanabe fuma. ctglab. nl
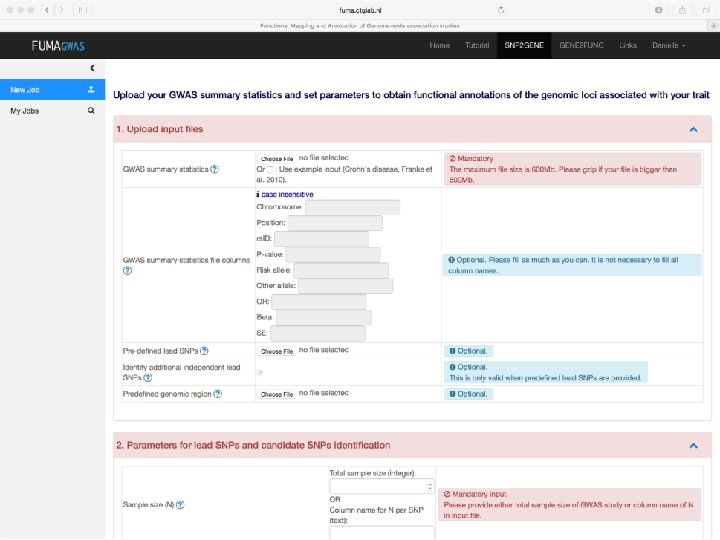
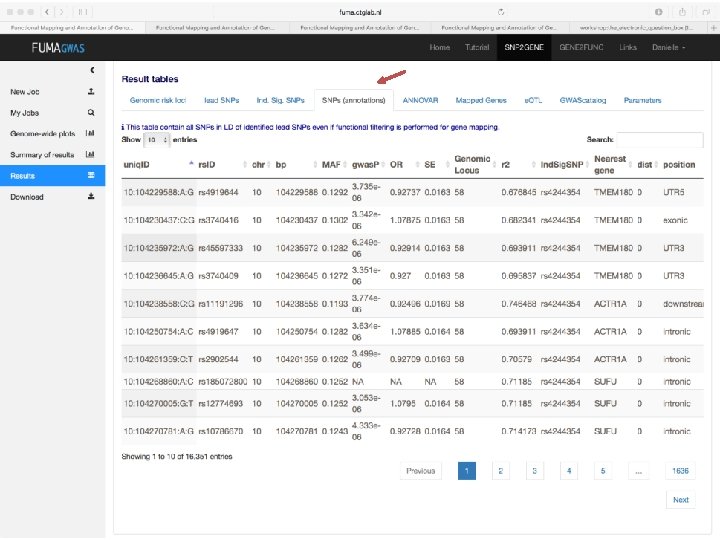
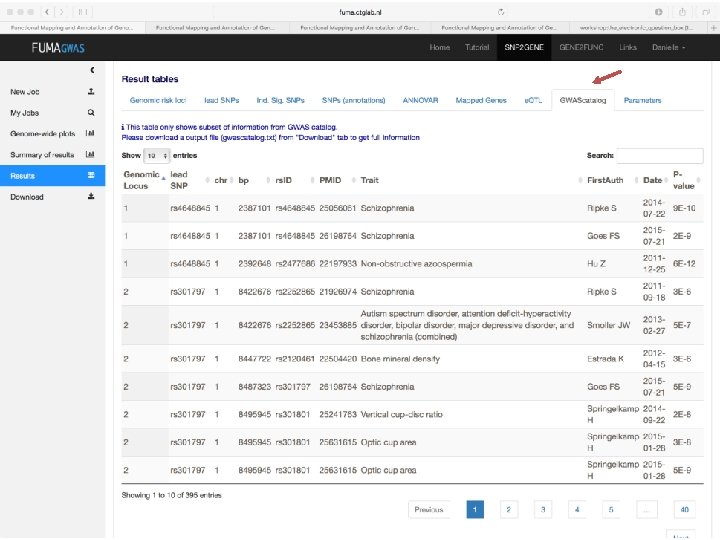
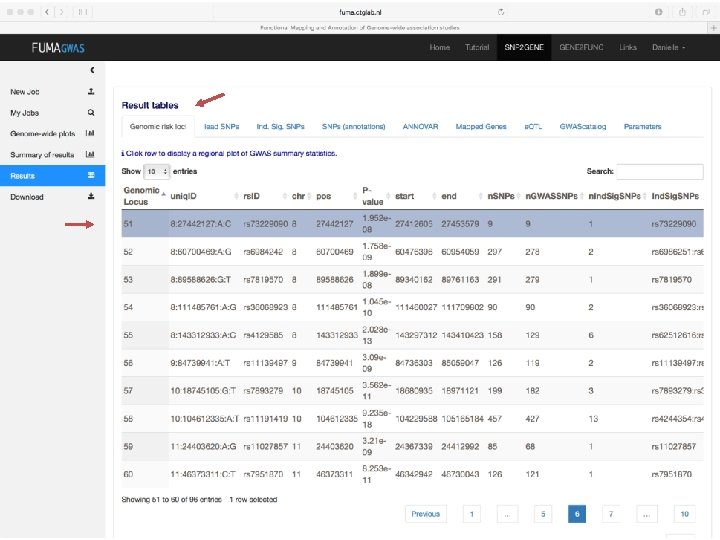
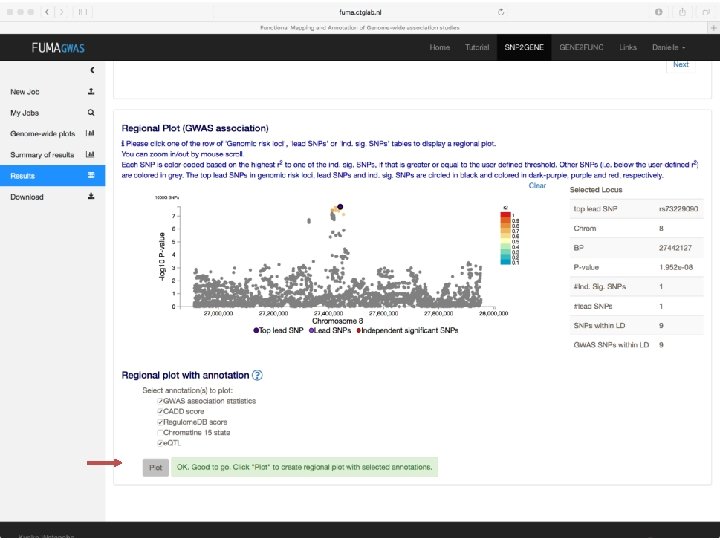
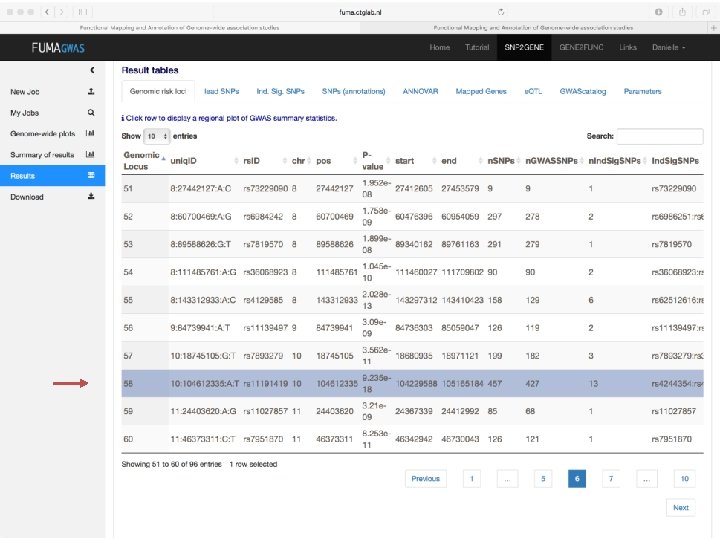
Demo fuma. ctglab. nl Watanabe K, Taskesen E, van Bochoven A, Posthuma D. FUMA: Functional mapping and annotation. doi: https: //doi. org/10. 1101/110023 Bior. Xiv
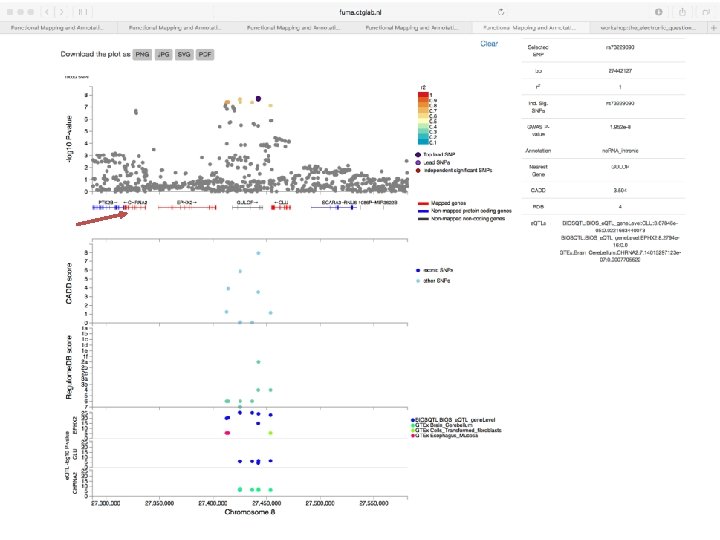
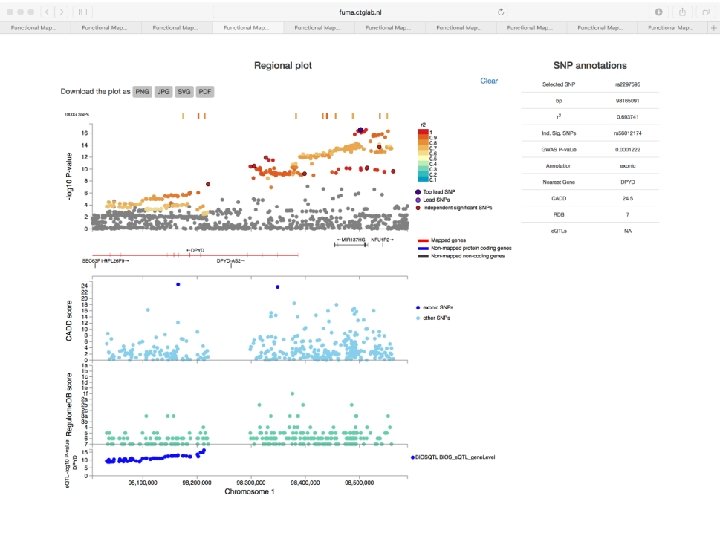
No exonic SNPs e. QTLs Third implicated gene
Exonic SNPs, high CADD scores
And also several e. QTLS
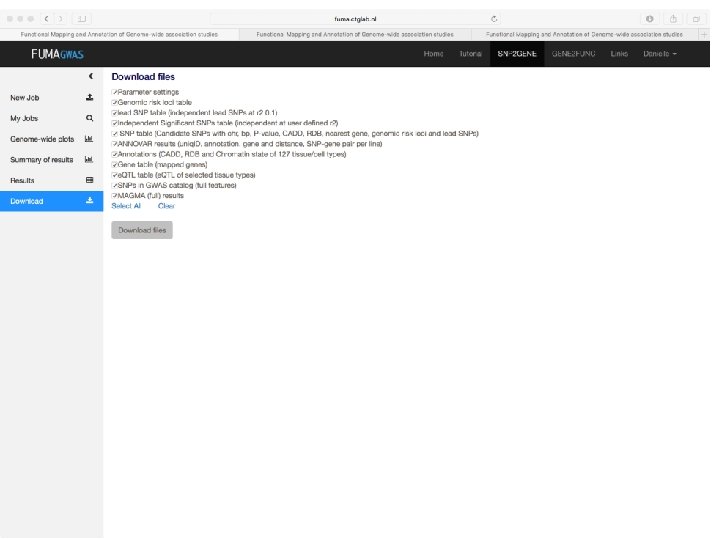
In sum • Upload GWAS summary statistics • Adds unmeasured SNPs to genomic risk loci, with known LD to measured SNPs • Annotates all SNPs in genomic risk loci – – – Functional annotations CADD scores Regulome. DB scores Chromatin states e. QTL information • Prioritizes genes based on user-defined filters • Conducts gene-based and pathway analyses (MAGMA & enrichment) • Provides interactive plots to visualize results • All generated results can be downloaded