functional magnetic resonance imaging f MRI Basic principles
")
functional magnetic resonance imaging (f. MRI)

Basic principles • • • magnetic field: 1. 5 T, 3 T, 7 T (earth: 0. 0001 T) structural (anatomical) vs. functional imaging functional: sacrifise spatial for temporal resolution (6 min vs. 2 sec) radio frequency pulse (T 1: anatomical, T 2*: functional) hydrogen nuclei in water (different amounts in different tissues gives the structural picture) functional by detecting changes in blood oxygenation associated with neural activity: neuron consumes oxygen: oxyhaemoglobin => deoxyhaemoglobin (strong paramagnetic agent, produces distortions in magnetic field) BOLD: blood oxygen-level-dependent contrast (not blood flow like PET) HRF: haemodynamic response function (they way BOLD signal evolves over time in response to an increase in neural activity) use EPI (fast acquisition technique) to take BOLD contrast weighted echoplanar images TR, volume, number of slices, whole/partial brain coverage, voxel (~105)
")
The HRF (~linear system/convolution possible)

some characteristics of f. MRI • indirect measure (downstream consequence of neural activity – not produced by neurons themselves) • non-invasive (versus PET) • good spatial resolution (~ 1 mm) • shows all participating areas at once (e. g. to direct electrophysiology) • repeated scanning is no problem • no precision of measurement in real time (~ 6 s) • poor temporal resolution 1 -4 s (unlike MEG, EEG) • no differentiation between neuro-electrical excitation and inhibition? • relatively weak signal increases (1 -3% with 1. 5 T) • problematic for auditory, speech, temporal & orbitofrontal cortex • expensive to acquire, use & maintain – personnel intensive: Neuro-radiologist, Nurse, Physicist, Statistician, Computer Scientist, Cognitive Psychologists
 subtraction method (contrast, t-contrast, ttest) an example:")
How do we do f. MRI? (cognitive) subtraction method (contrast, t-contrast, ttest) an example: brain activation during moving dot stimuli (experimental condition) brain activation during stationary dot presentation (control condition) brain activation due to motion part of experimental cond. ) (unique
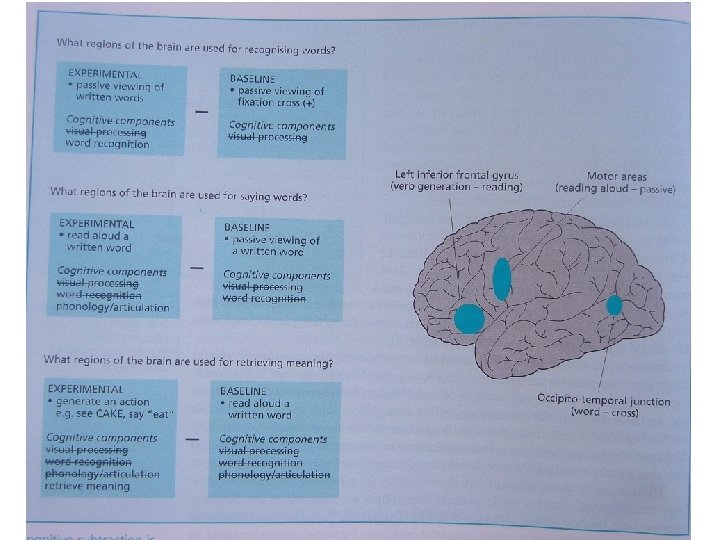

• • • pure insertion: we assume that adding an extra component does not affect the operation of the other ones interactions: above assumption not true simple subtraction: measuring differences in brain activity between two or more conditions several conditions, control condition, baseline, fixation factorial designs (usually 2 x 2) parametric designs: measuring associations (e. g. correlation) between brain activity and changes in the variable of interest (continuous, not categorical – no baseline/subtraction necessary)

basic experimental setup protocols: • • block design (stimuli that belong together in one condition are presented together in a block) vs. event related designs (different stimuli/conditions are interspersed with each other) more sensitivity /statistical power vs. flexibility (proper psychophysical designs, cases with no prior knowledge e. g. binocular rivslry, hallucinations)
: pre-processing of data & statistical testing (single")
• data analysis (e. g. SPM): pre-processing of data & statistical testing (single voxel) • pre-processing: realignment (correction for head movement), normalisation (Talairach coordinates), smoothing (better SNR, group analysis)
, set some")
statistical testing • for each single voxel: compare between conditions (contrast, ttest), set some statistical threshold for significance (p value), correct for multiple comparisons (60 k), corrected (0. 05) vs. uncorrected (0. 001) statistics, region of interest (ROI) vs. whole brain analysis, small volume correction, clustering • group analysis (2 nd level): fixed effects (6 but problematic), random effects (12), individual-subject results (4) • interpretation: non-specific factors (e. g. attention, low level effects, eye-movements) • input, processing, or output? • excitation of inhibition? • ‘brain reading’ possible? (read perception, feeling, intention, racial bias etc. )

Area V 1 has a retinotopic map f o v e a left visual cortex 90 right visual field 45 inferior vertical meridian 40 270 f o v e a 20 315 2. 5 HM 45 90 1 cm 5 10 20 40 10 0 = HM 10 20 40 superior vertical meridian 315 270

ROI definition in visual studies which visual area? human retinotopy using f. MRI

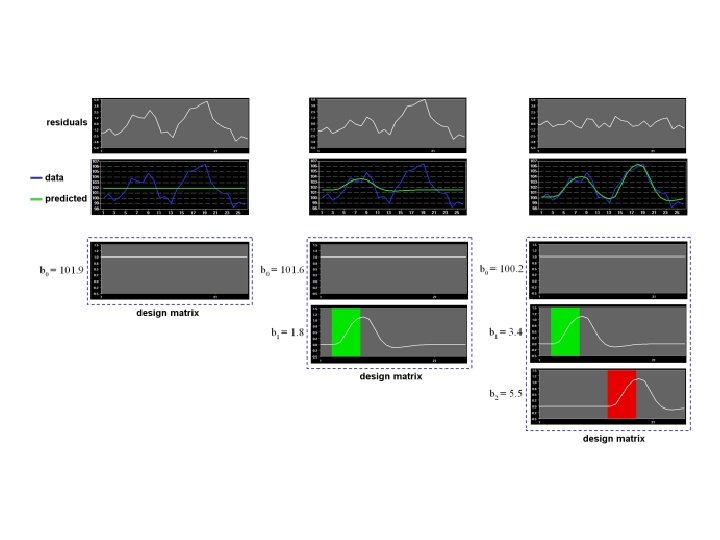
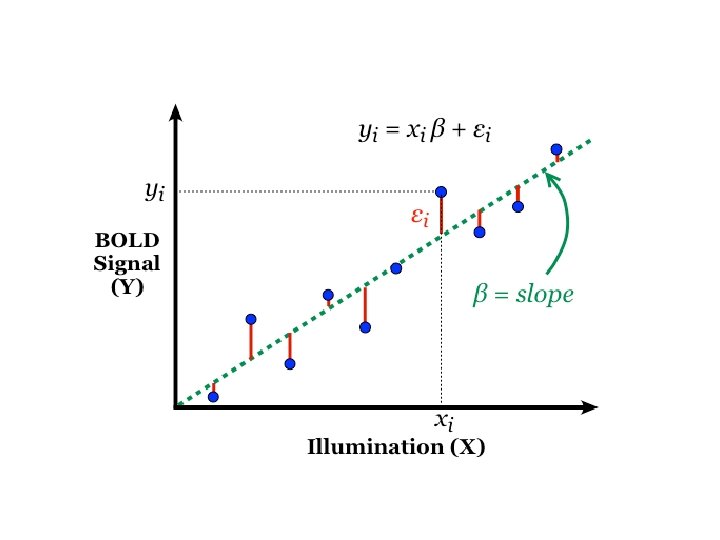
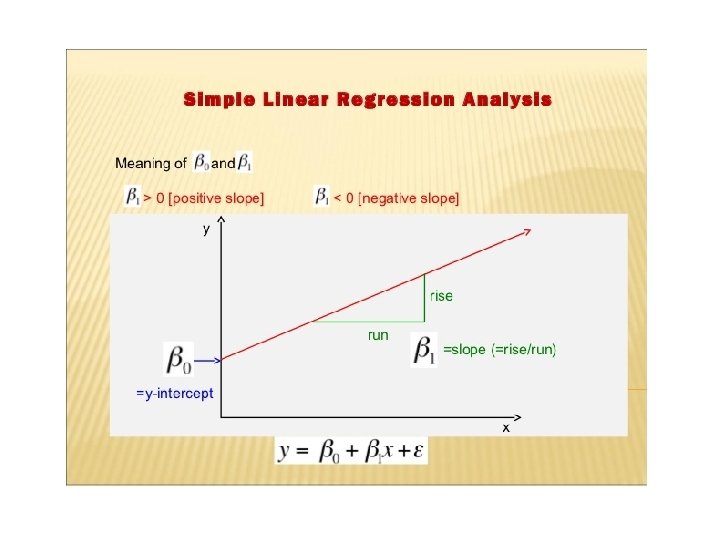
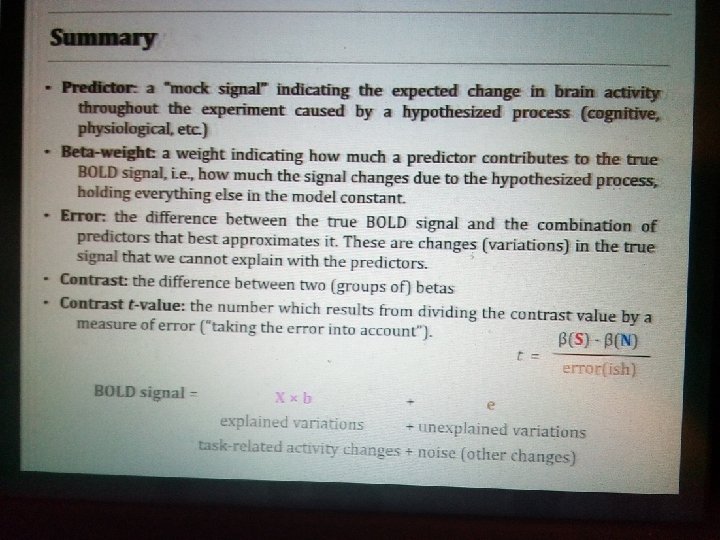
The GLM model – why? • • • • what do we do with the activation signal? why no just take averages? what about the time-lag? lets time-shift! what about the shape of the HRF? lets convolve! but how do we take the average? remember linear regression? predictors (linear combination of)? minimising SSE? so lets use GLM predictors, betas, error, t-contrast, t-value, p-value (beta 1 -beta 2)/error the problem of overfitting

Convolution with the HRF
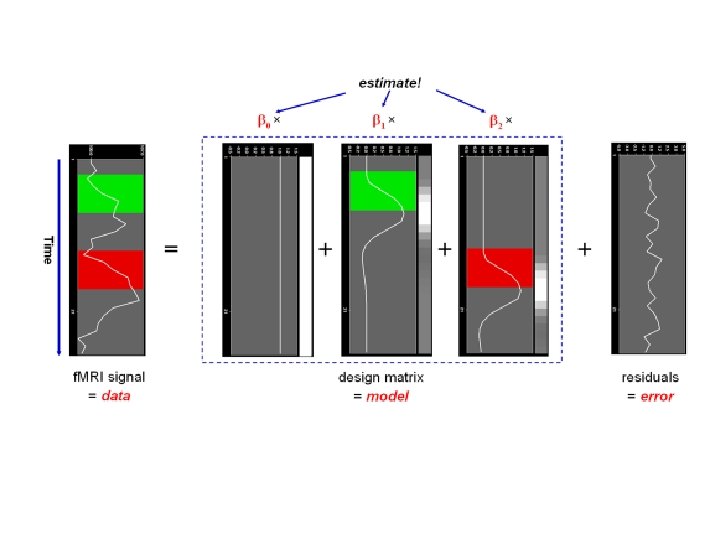

Matrix multiplication
")
The activation of a single voxel over time (n time-points, p predictors)

statistical thresholding visualisation
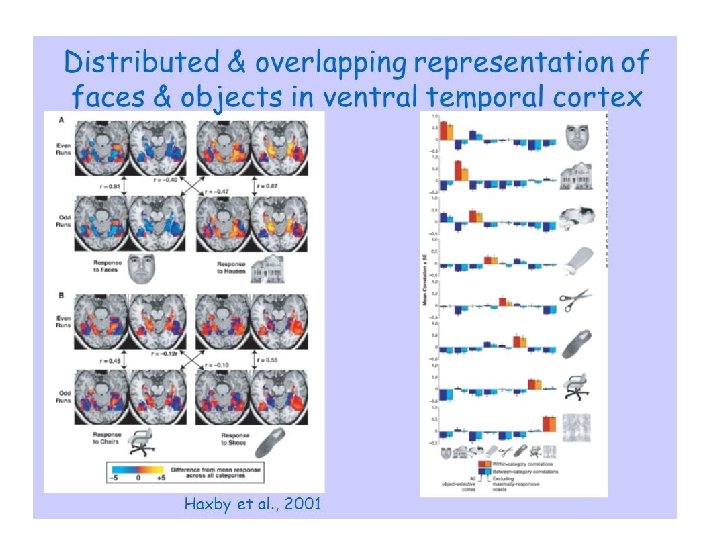

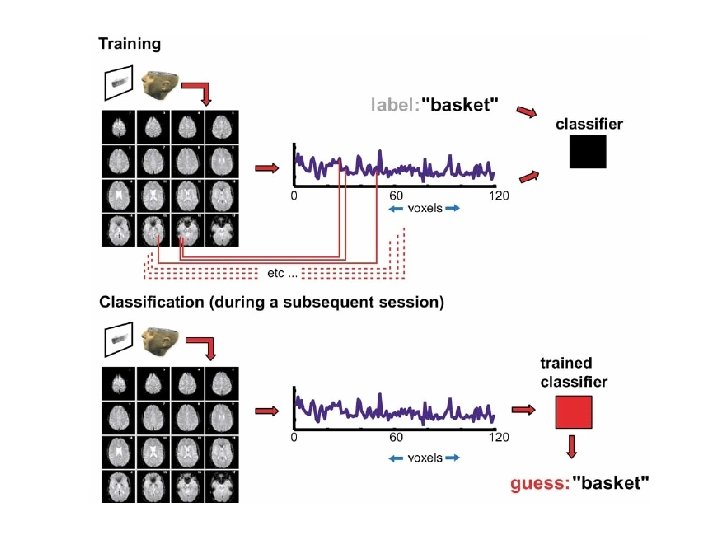
Multivariate analysis • • • univariate analysis: single voxel statistics multivariate analysis: use many voxels look at patterns of brain activation learn to map between patterns of brain activity and stimulus categories pattern recognition/classification can look at simple stuff like correlation can use more sophisticated ML tools ML (supervised learning): train an algorithm to classify with a set of data and then ask it to classify another (new) set of data each class is a cluster of data points in a multi-dimensional space so powerful (and hidden) statistical learning has the problem that the nature of information that the classifier uses to solve the task remains unknown we can just say that “the information is there” but what is the form of this information is not always obvious mind reading (perceptions, imagery/dreams, intentions, thoughts, decisions etc. )

types of classifiers: linear discriminants, support vector machines, neural nets etc
")
(Kamitani & Tong 2005)
- Slides: 27