
Functional Data Analysis for Speech Research Michele Gubian

Functional Data Analysis for Speech Research Michele Gubian Radboud University Nijmegen The Netherlands London, March 24 th 2010 Cambridge, March 26 th 2010
Content n n What and why Functional Data Analysis (FDA) ¨ Motivation ¨ Case study 1 ¨ Case study 2 – pitch re-synthesis How to use FDA ¨ Using the R package ‘fda’
Motivation
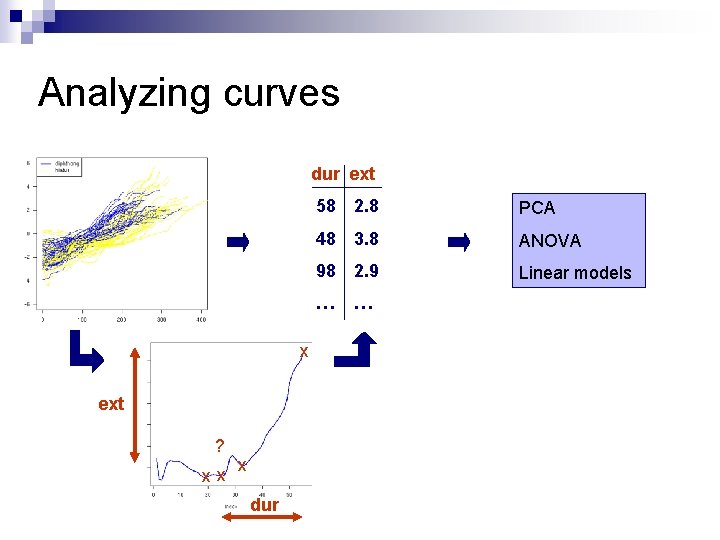
Analyzing curves dur ext 58 2. 8 PCA 48 3. 8 ANOVA 98 2. 9 Linear models … x ext ? xx x dur …
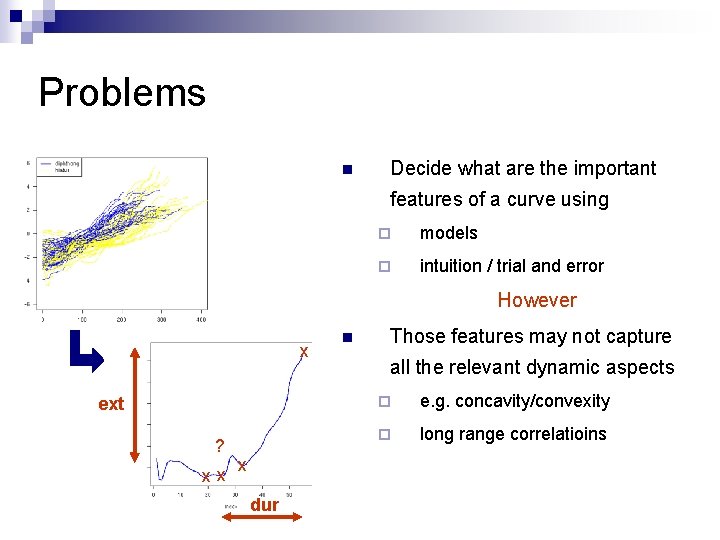
Problems n Decide what are the important features of a curve using ¨ models ¨ intuition / trial and error However x ext ? xx x dur n Those features may not capture all the relevant dynamic aspects ¨ e. g. concavity/convexity ¨ long range correlatioins
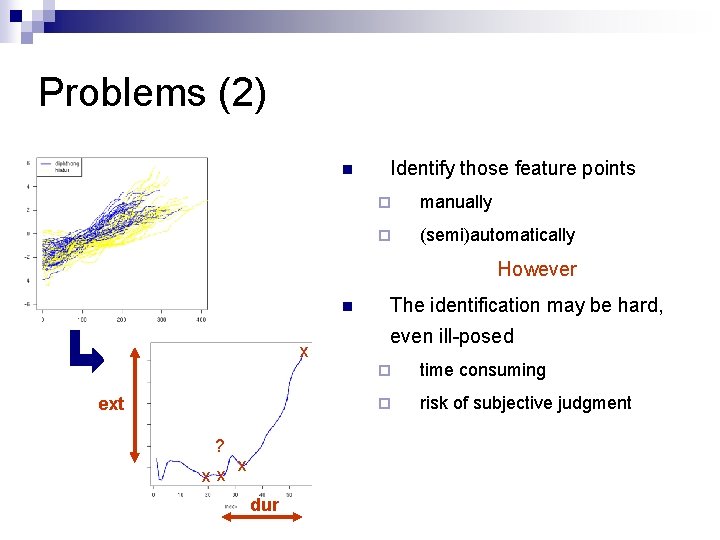
Problems (2) n Identify those feature points ¨ manually ¨ (semi)automatically However n x ext ? xx x dur The identification may be hard, even ill-posed ¨ time consuming ¨ risk of subjective judgment

Analyzing curves with FDA Functional Data Analysis x ext ? xx x dur
Analyzing curves with FDA n All the information contained in the curve (dynamics) is used ¨ No need to reduce a curve to a set of significant features ¨ No need to introduce assumptions on what is relevant in a curve shape and what is not n FDA provides both VISUAL and QUANTITATIVE results ¨ input is curves, output is also curves ¨ plus classic statistical output like p-values, confidence intervals …
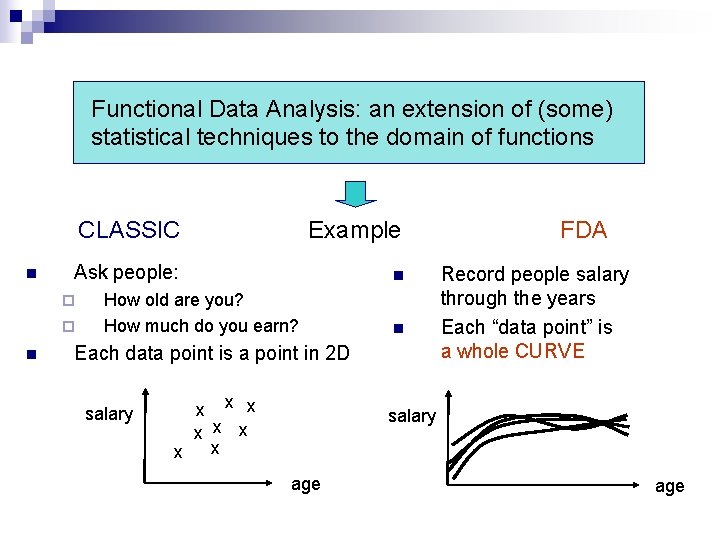
Functional Data Analysis: an extension of (some) statistical techniques to the domain of functions n CLASSIC Example Ask people: n ¨ ¨ n How old are you? How much do you earn? n Each data point is a point in 2 D salary x x x x FDA Record people salary through the years Each “data point” is a whole CURVE salary age
Case study
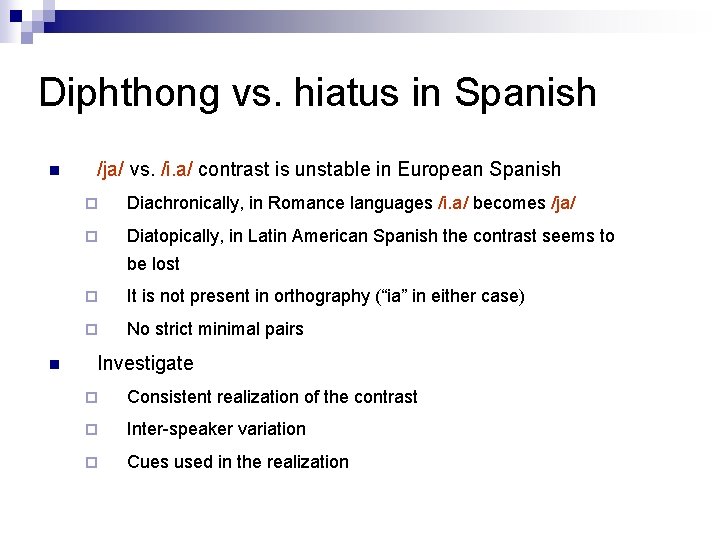
Diphthong vs. hiatus in Spanish n /ja/ vs. /i. a/ contrast is unstable in European Spanish ¨ Diachronically, in Romance languages /i. a/ becomes /ja/ ¨ Diatopically, in Latin American Spanish the contrast seems to be lost n ¨ It is not present in orthography (“ia” in either case) ¨ No strict minimal pairs Investigate ¨ Consistent realization of the contrast ¨ Inter-speaker variation ¨ Cues used in the realization
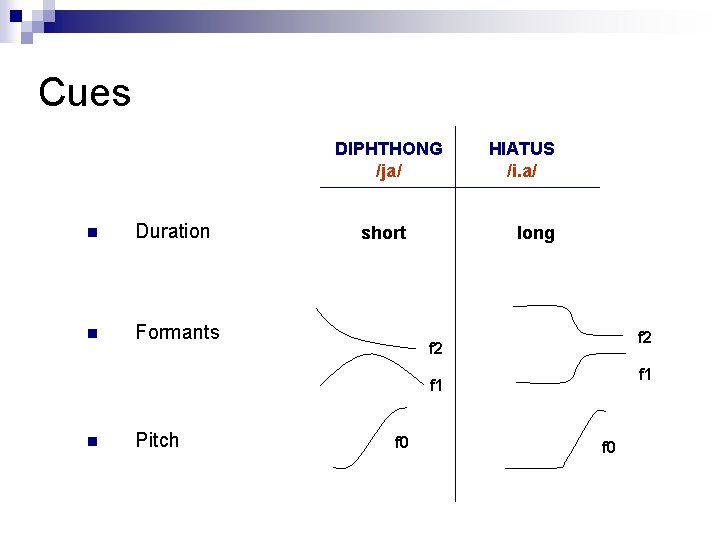
Cues DIPHTHONG /ja/ n Duration n Formants short HIATUS /i. a/ long f 2 f 1 n Pitch f 0
Example diphthong
Example hiatus
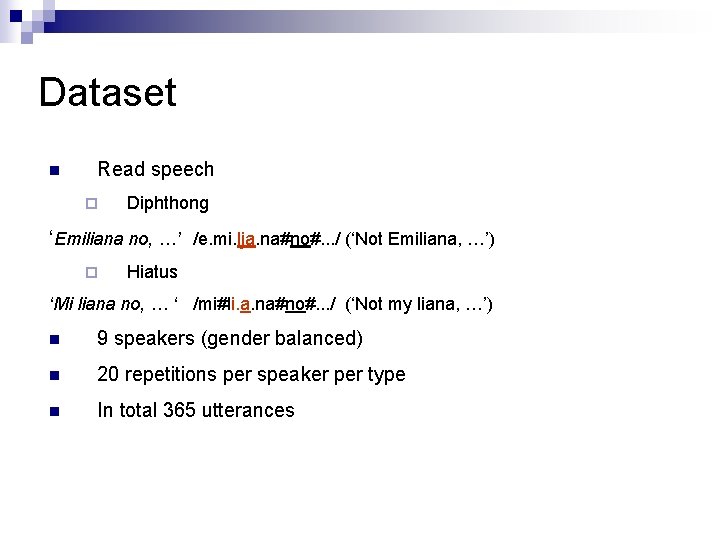
Dataset n Read speech ¨ Diphthong ‘Emiliana no, …’ /e. mi. lja. na#no#. . . / (‘Not Emiliana, …’) ¨ Hiatus ‘Mi liana no, … ‘ /mi#li. a. na#no#. . . / (‘Not my liana, …’) n 9 speakers (gender balanced) n 20 repetitions per speaker per type n In total 365 utterances
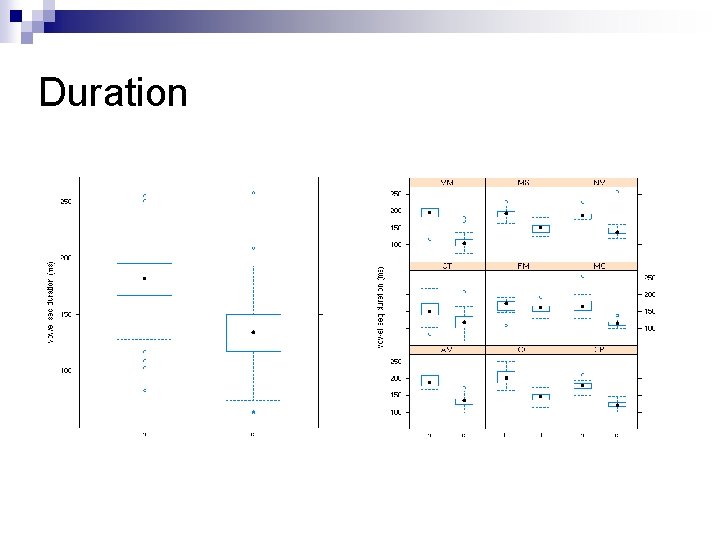
Duration
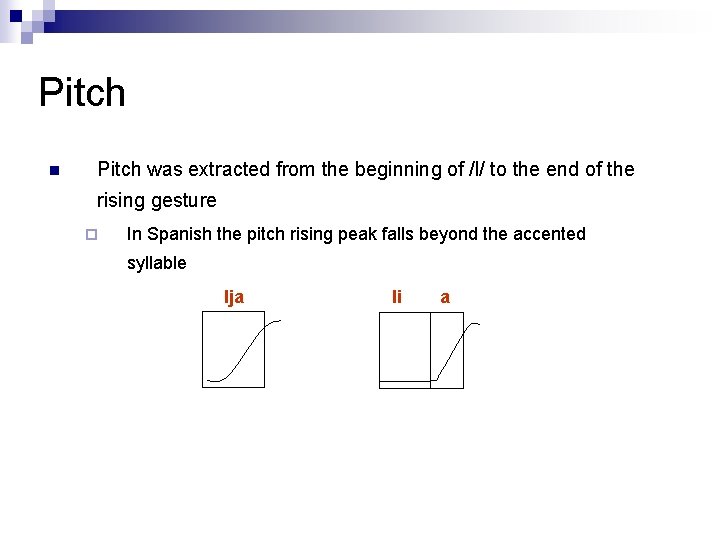
Pitch n Pitch was extracted from the beginning of /l/ to the end of the rising gesture ¨ In Spanish the pitch rising peak falls beyond the accented syllable lja li a
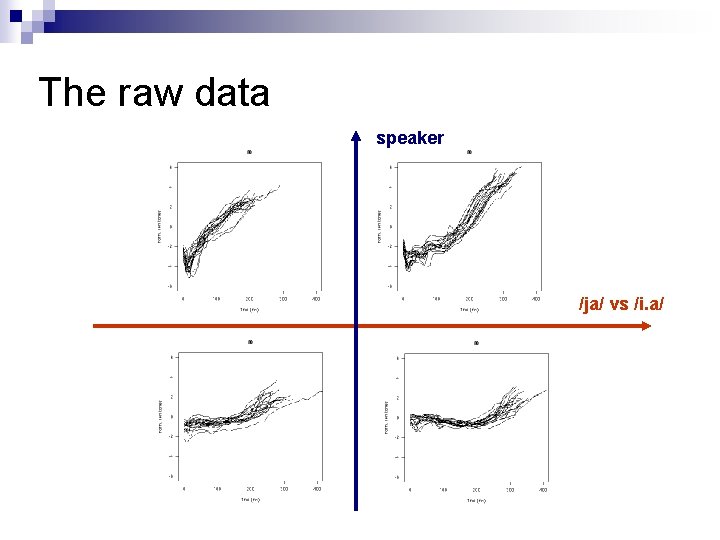
The raw data speaker /ja/ vs /i. a/
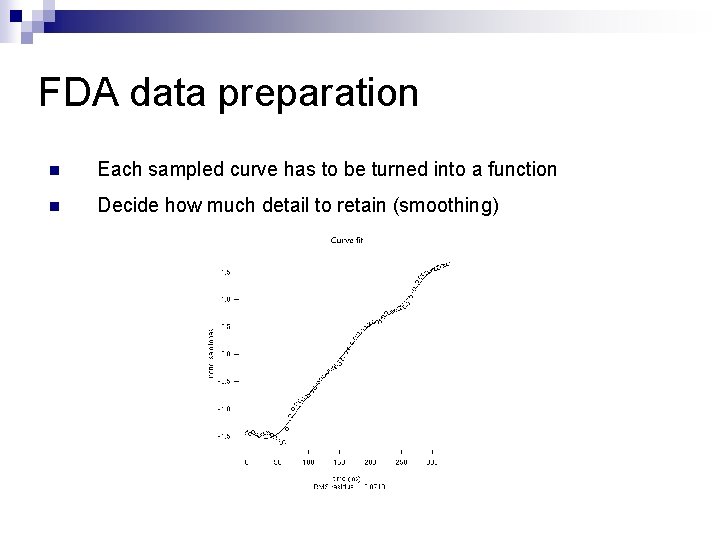
FDA data preparation n Each sampled curve has to be turned into a function n Decide how much detail to retain (smoothing)
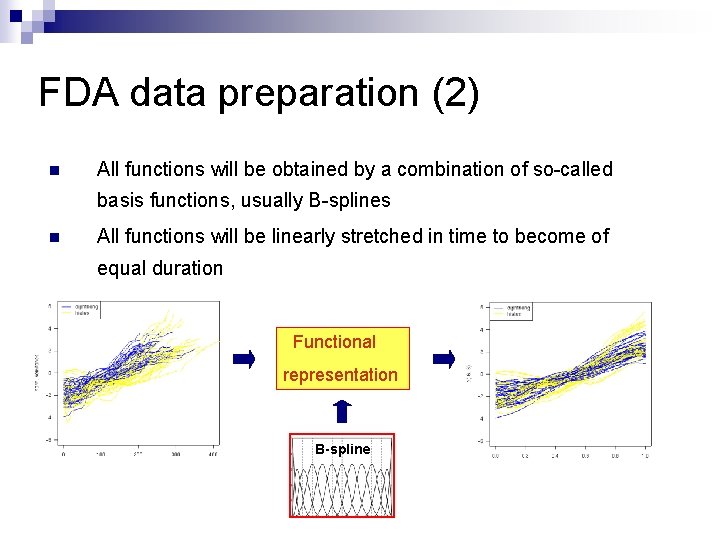
FDA data preparation (2) n All functions will be obtained by a combination of so-called basis functions, usually B-splines n All functions will be linearly stretched in time to become of equal duration Functional representation B-spline
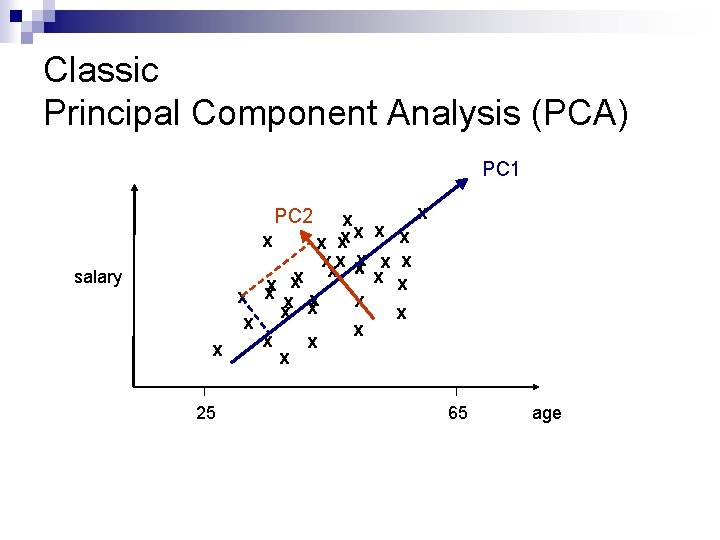
Classic Principal Component Analysis (PCA) PC 1 x x x xx xx x x x x PC 2 salary 25 65 age
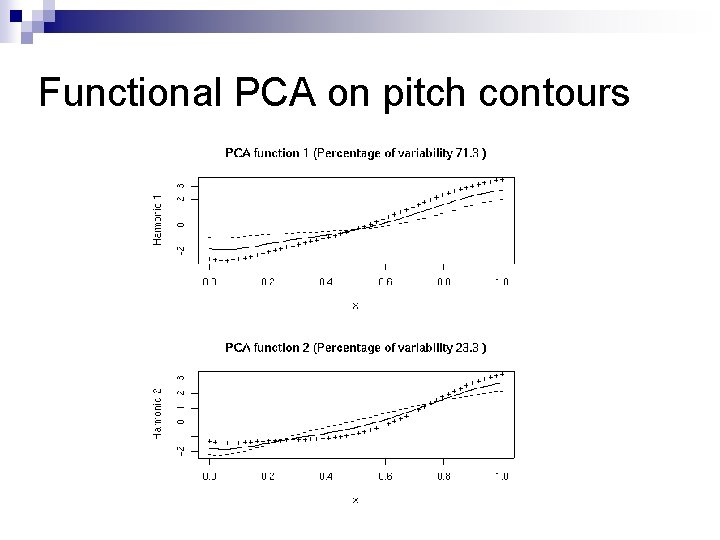
Functional PCA on pitch contours
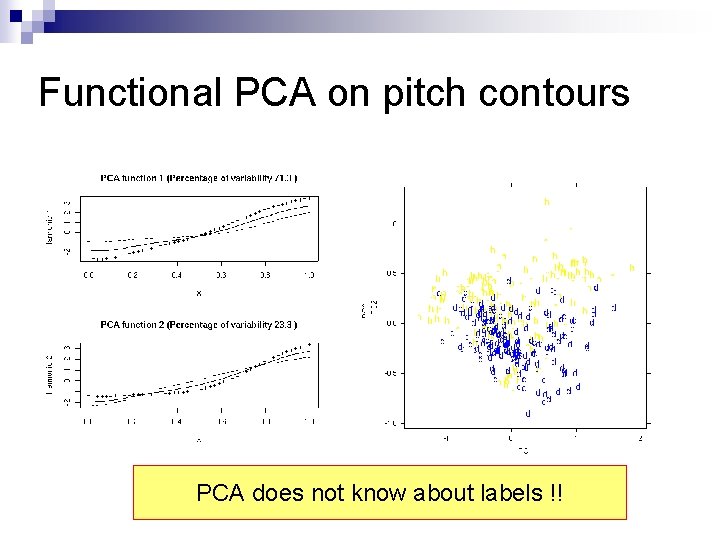
Functional PCA on pitch contours PCA does not know about labels !!
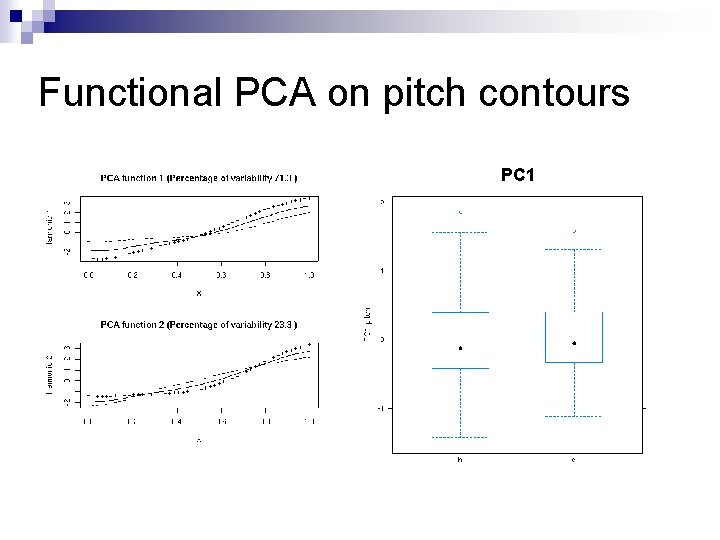
Functional PCA on pitch contours PC 1
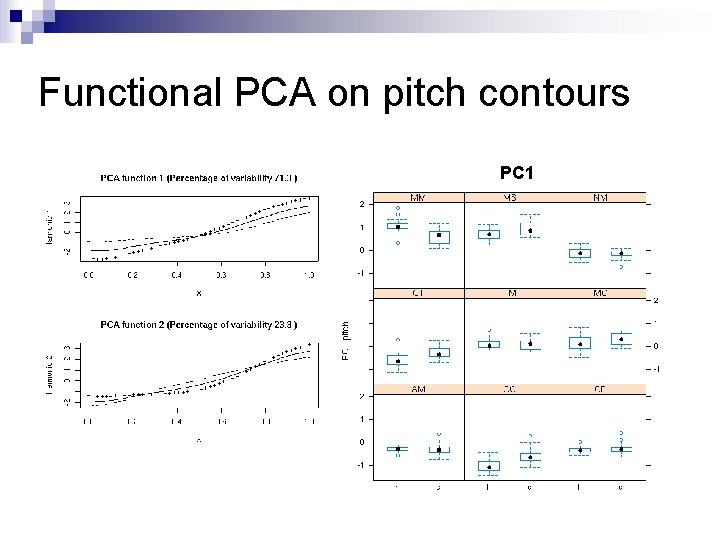
Functional PCA on pitch contours PC 1
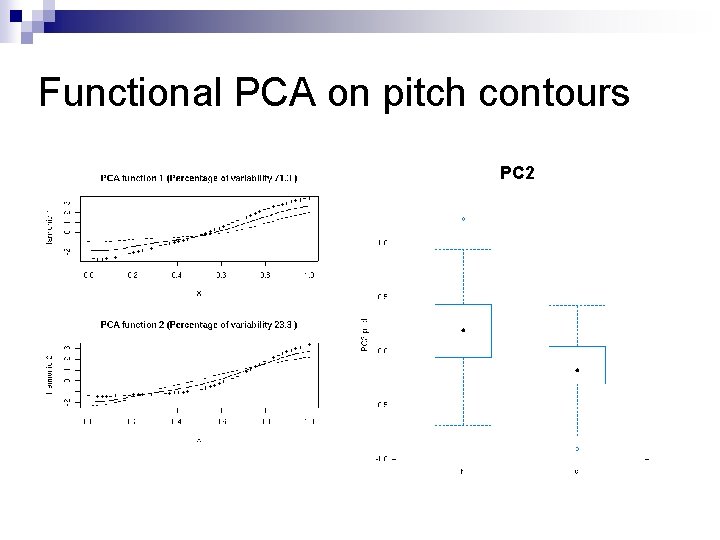
Functional PCA on pitch contours PC 2
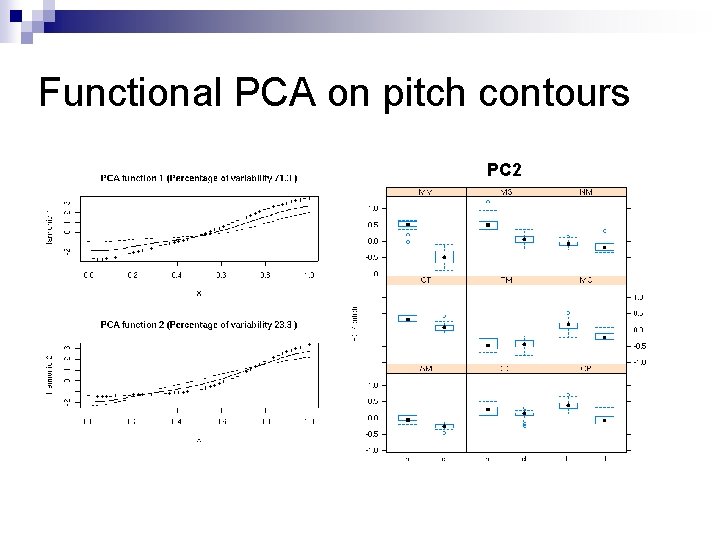
Functional PCA on pitch contours PC 2
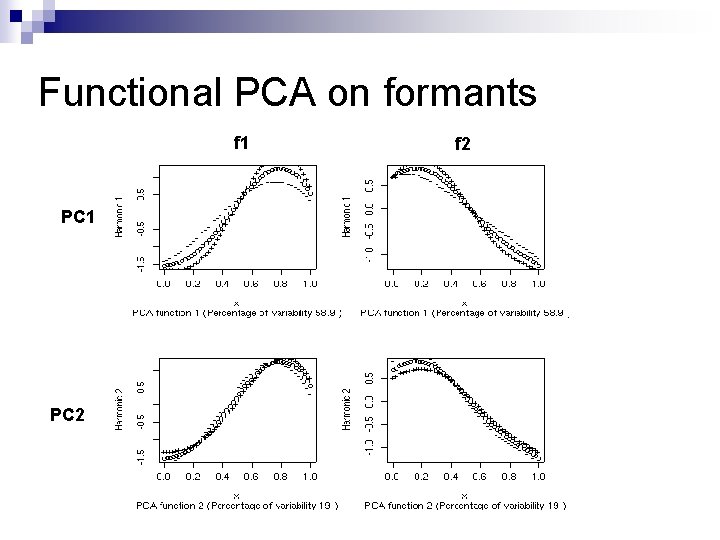
Functional PCA on formants f 1 PC 2 f 2
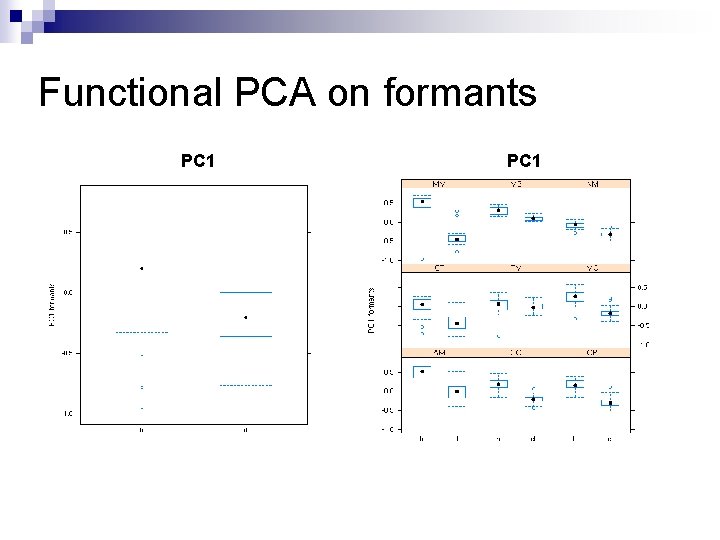
Functional PCA on formants PC 1
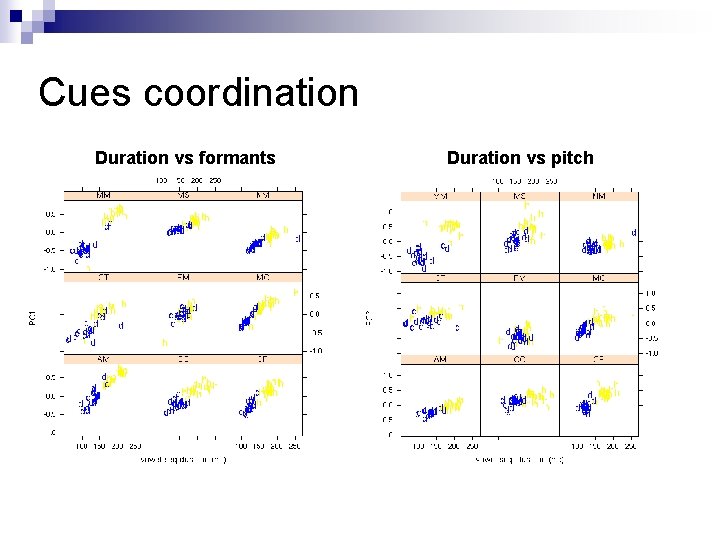
Cues coordination Duration vs formants Duration vs pitch
Summary n FDA provides tools to extract relevant dynamic characteristics of a set of curves n Traditional tools like PCA (and linear regression) are extended to curves n Functional PCA revealed the main dynamic cues used in the realization of a (weak) contrast in Spanish ¨ Without using the labels information ¨ Without extracting features from the curves (e. g. peaks) ¨ Combining multi-dimensional curves (formants) without effort
References n Functional Data Analysis website: www. functionaldata. org n Books: n Software: a bilingual (R and MATLAB) tool is freely available online
Appendix
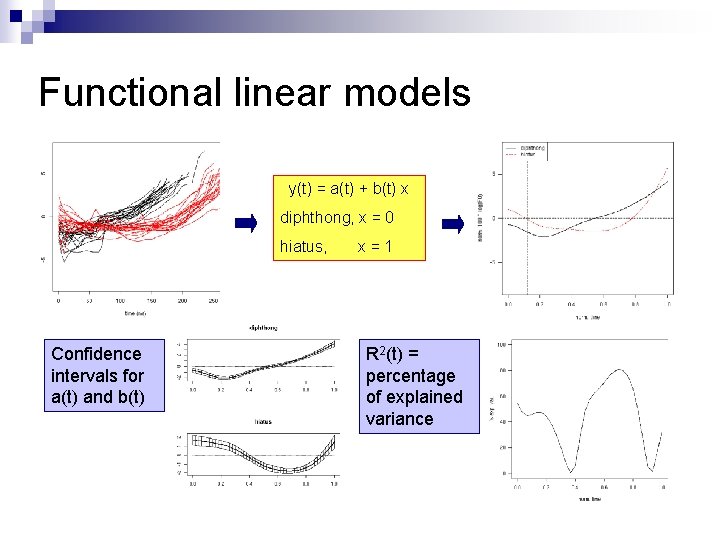
Functional linear models y(t) = a(t) + b(t) x diphthong, x = 0 hiatus, Confidence intervals for a(t) and b(t) x=1 R 2(t) = percentage of explained variance
- Slides: 34