Functional Annotation and Functional Enrichment Annotation Structural Annotation


 • Goal = consistent annotation of gene products within and")

 • Biological Process (14,")


 that are overrepresented in a subset of")


- Slides: 30
Functional Annotation and Functional Enrichment
Annotation • Structural Annotation – defining the boundaries of features of interest (coding regions, regulatory elements, functional RNAs, etc). – Ab initio – computationally predicted – Comparative – based on similarity to other genes or genomes – Experimental – transcript sequencing • Functional Annotation – attaching meaning to the features (names, product, activity, biological role, etc. ) – Sequence homology – Structural similarity or structural features – Experimental data – gene or protein expression patterns
Functional Annotation Manual Automated Slow Costly Inconsistent quality Inconsistent coverage across genome • Rich content • Error correction • • Fast Cheap? Consistent quality Complete coverage across genome • Improving in content • Updateable
Home many ways are there to say the same thing? • Quick survey of Gen. Bank lac. I product annotations in 48 bacteria: – – – – – Lactose operon repressor (20) DNA-binding transcriptional repressor (14) transcriptional regulator Lac. I family (5) lac operon repressor (2) transcriptional repressor of the lac operon (2) lac repressor (1) Lac. I (1) putative transcriptional regulator (1) transcriptional repressor of lactose catabolism (Gal. R/Lac. I family) (1) * Excluding differences in capitalization
The Gene Ontology (GO) • Goal = consistent annotation of gene products within and between organisms • Gene Ontology Consortium began as a collaboration among model organism dbs (Fly. Base, SGD, MGD). Now includes larger number of members and interest groups • Ontology = A formal representation of concepts and the relationships among them
Gene Ontology
The 3 GO Ontologies • Molecular Function (8, 360 terms) • Biological Process (14, 898 terms) • Cellular Component (2, 110 terms) • GO Term = an entry in an ontology, composed of a unique identifier (GO: 000001), definition and “synoynms”
CC • A cellular component is just that, a component of a cell, but with the proviso that it is part of some larger object; • this may be an anatomical structure (e. g. rough endoplasmic reticulum or nucleus) or a gene product group (e. g. ribosome, proteasome or a protein dimer).
BP • A biological process is series of events accomplished by one or more ordered assemblies of molecular functions. • Examples of broad biological process terms are cellular physiological process or signal transduction. Examples of more specific terms are pyrimidine metabolic process or alpha-glucoside transport. • It can be difficult to distinguish between a biological process and a molecular function, but the general rule is that a process must have more than one distinct steps. • A biological process is not equivalent to a pathway; at present, GO does not try to represent the dynamics or dependencies that would be required to fully describe a pathway.
MF • Molecular function describes activities, such as catalytic or binding activities, that occur at the molecular level. GO molecular function terms represent activities rather than the entities (molecules or complexes) that perform the actions, and do not specify where or when, or in what context, the action takes place. Molecular functions generally correspond to activities that can be performed by individual gene products, but some activities are performed by assembled complexes of gene products. • Examples of broad functional terms are catalytic activity, transporter activity, or binding; examples of narrower functional terms are adenylate cyclase activity or Toll receptor binding. • It is easy to confuse a gene product name with its molecular function, and for that reason many GO molecular functions are appended with the word "activity".
Annotation File Format
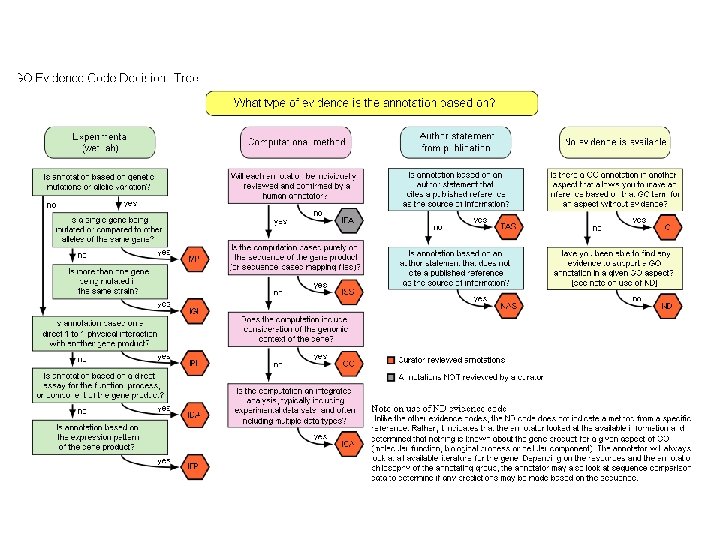
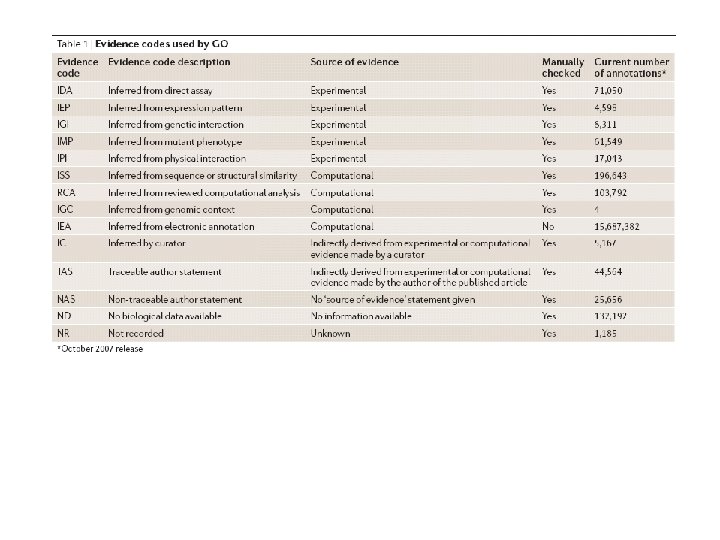
Evidence Codes • Experimental Evidence Codes – – – EXP: Inferred from Experiment IDA: Inferred from Direct Assay IPI: Inferred from Physical Interaction IMP: Inferred from Mutant Phenotype IGI: Inferred from Genetic Interaction IEP: Inferred from Expression Pattern – – – ISS: Inferred from Sequence or Structural Similarity ISO: Inferred from Sequence Orthology ISA: Inferred from Sequence Alignment ISM: Inferred from Sequence Model IGC: Inferred from Genomic Context RCA: inferred from Reviewed Computational Analysis • Computational Analysis Evidence Codes
Evidence Codes • Author Statement Evidence Codes – TAS: Traceable Author Statement – NAS: Non-traceable Author Statement • Curator Statement Evidence Codes – IC: Inferred by Curator – ND: No biological Data available • Automatically-assigned Evidence Codes – IEA: Inferred from Electronic Annotation • Obsolete Evidence Codes – NR: Not Recorded
What is the source of automated annotations? • Integrated automated annotation systems combine a variety of analysis types • Comparison to databases protein and/or domain families with defined functions (COGs, NCBI CDD, PFAM, Pro. Site, etc. ) • Structural characteristic predictions • Sequence characteristic predictions
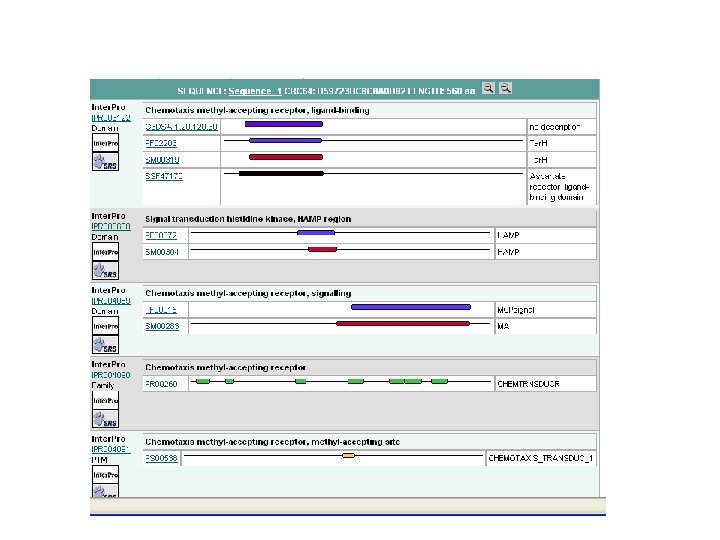
Inter. Pro: www interface
Inter. Pro
Inter. Pro release 16. 0 contains 15045 entries: Active sites 34 Binding sites 22 Domains 4676 Families 10060 PTMs 18 Repeats 235 Database All Signatures Integrated PANTHER 30128 2061 Pfam 8957 PIRSF 1748 1499 PRINTS 1900 1898 Pro. Dom 3538 1041 PROSITE 1319 SMART 724 721 TIGRFAMs 2949 2933 Gene 3 D 2147 783 SUPERFAMILY 1538 463
Sample Inter. Pro Family
Inter. Pro is one source of IEAs
On a genome scale • Assign all genes to Interpro families • Obtain GO terms (IEA evidence) linked to the Interpro term • Use these to find patterns in large gene lists – Experimental ( genes upregulated in array exp) – Comparative (genes with/without orthologs)
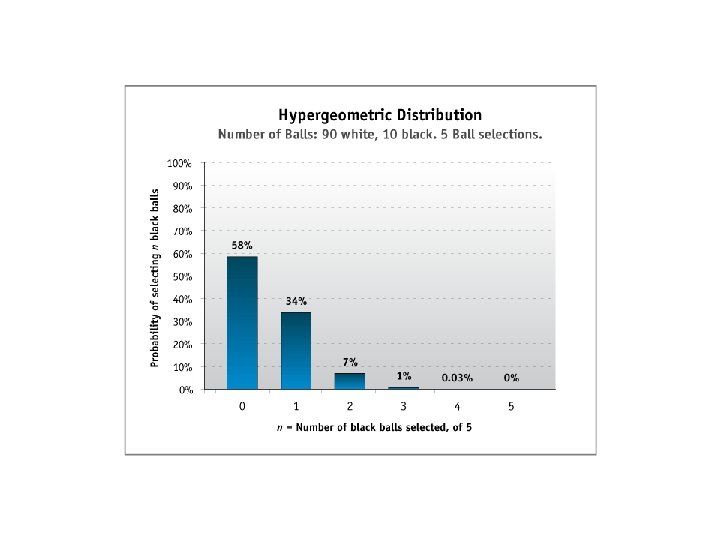
Enrichment • Find categories (Inter. Pro, GO) that are overrepresented in a subset of genes relative to the background (genome? ) as a whole • Example: 40% of the genes that distinguish between two strains of E. coli are mobile elements. Is this more than I expect based on random chance if 10% of the genome as a whole is mobile elements.
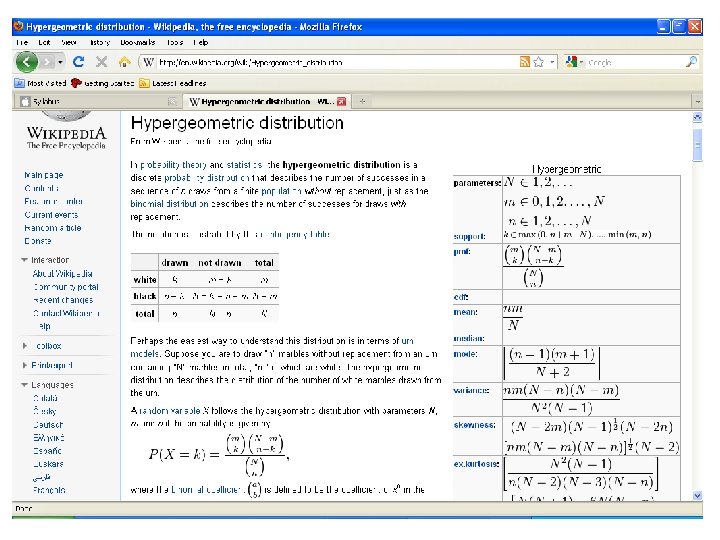
Hypergeometric Distribution • describes the number of successes in a sequence of n draws from a finite population without replacement • Black and white balls in an urn • Genes with an ortholog and genes without an ortholog • Genes differentially expressed, genes unchanged
Comparison of 68 enrichment analysis tools available in 2008