FUNCTION GRAPH Nimas Mayang Sabrina S MSc Outline

FUNCTION GRAPH Nimas Mayang Sabrina S. , MSc

Outline Graph of: 1. Linear Function 2. Quadratic Function 3. Exponential Function

y = ax + b 1. Linear function
 = ax + b, a and")
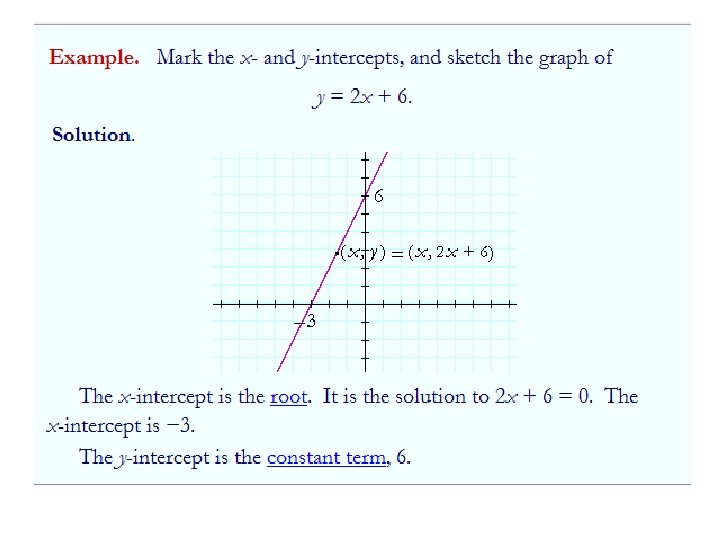
1. Linear Function General form: y = f(x) = ax + b, a and b constant a = slope b = line across y axis Domain and codomain: Df = , Wf = Graph: y = ax + b b
 = 3 x – 1")
Exercises • Plot the graph of: 1. f (x) = 3 x – 1 2. f (x) = 2 x - 3

Exercises Plot the graph of:

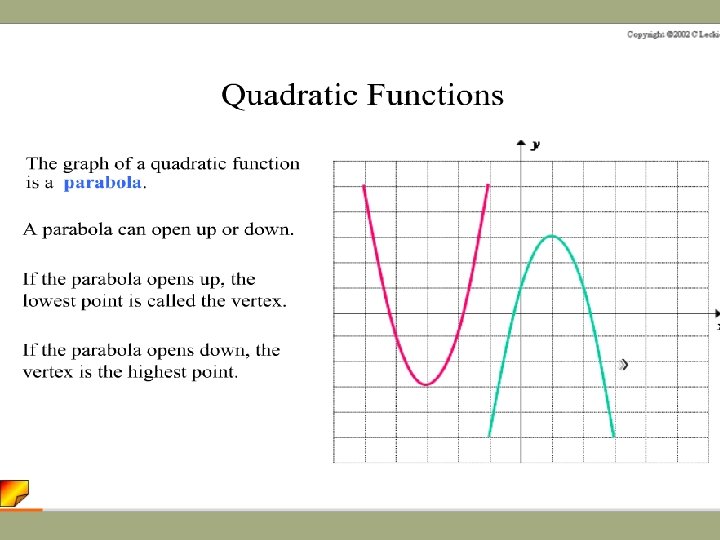
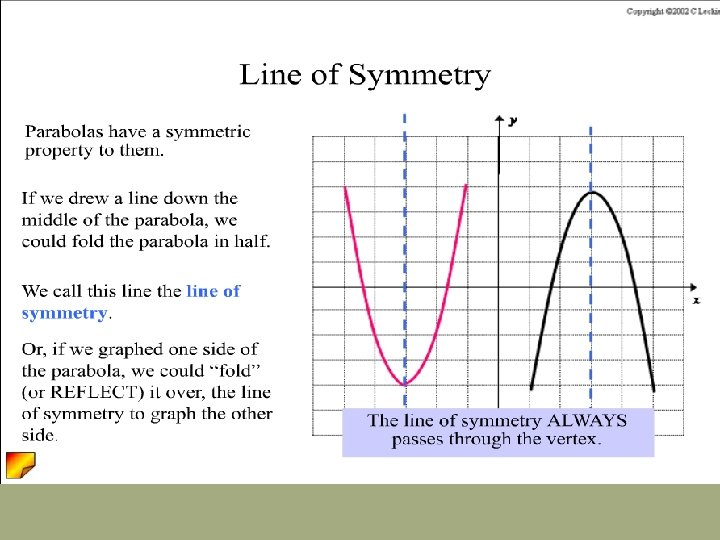
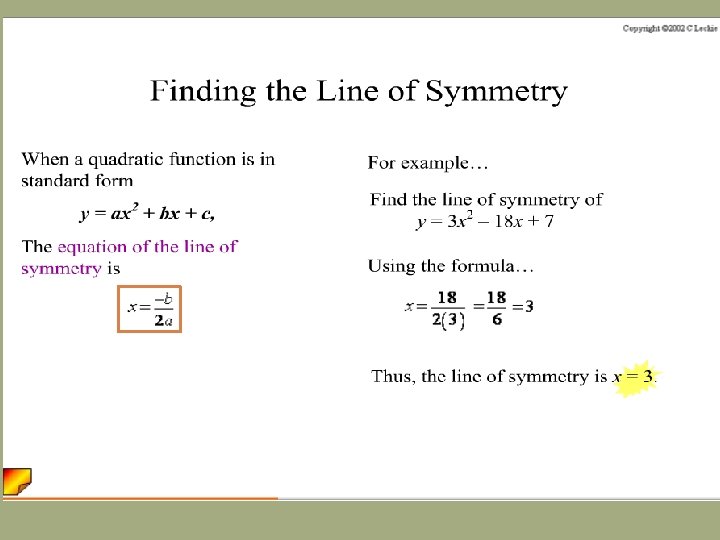
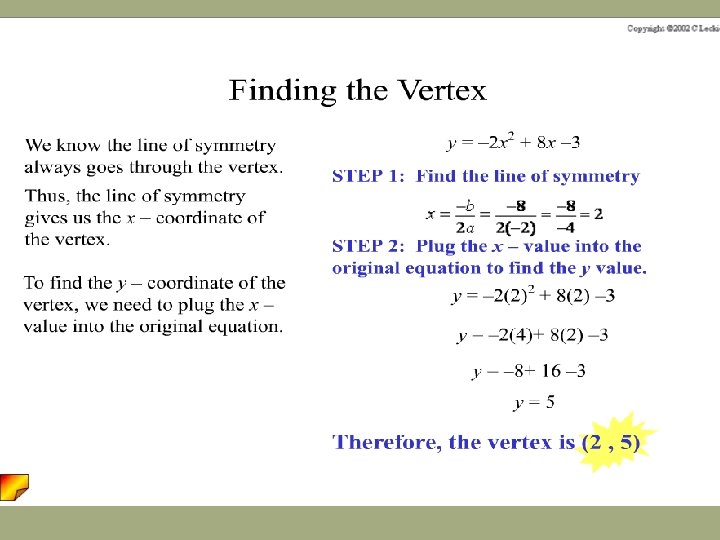
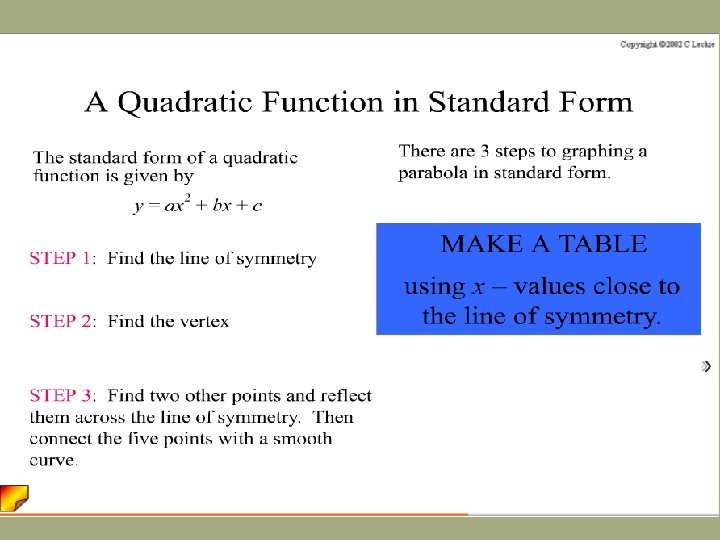
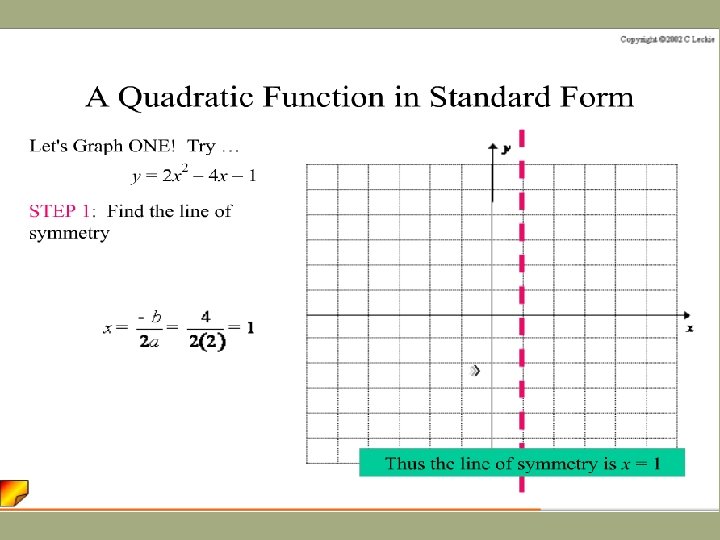
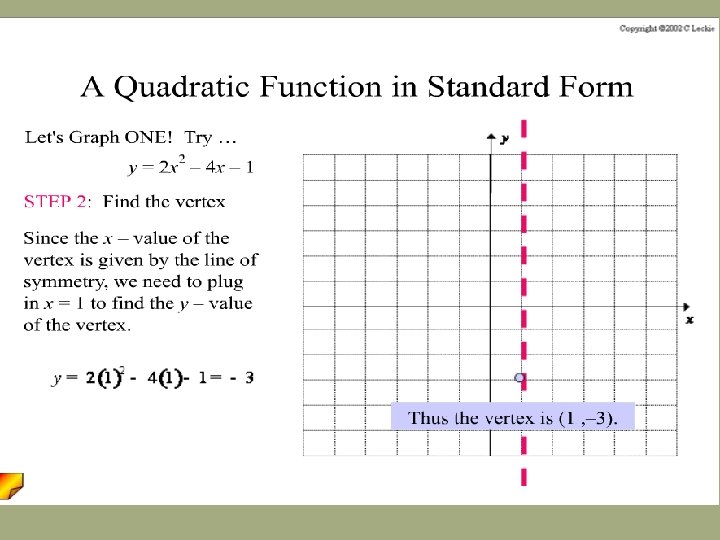
2. Quadratic functions
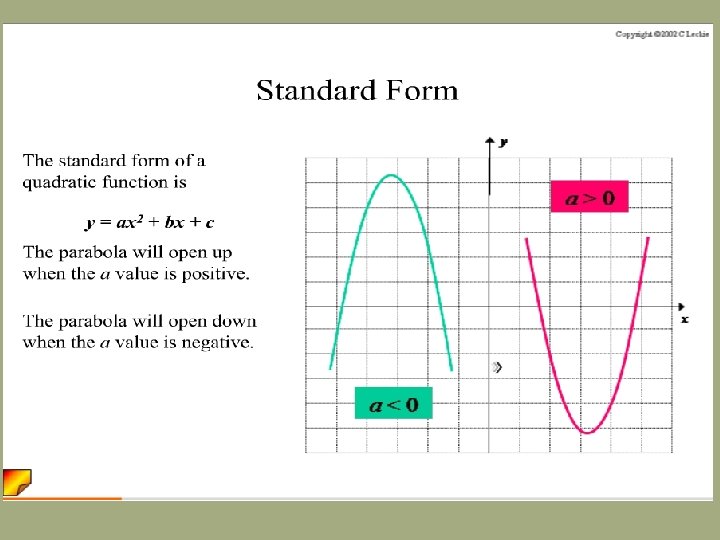
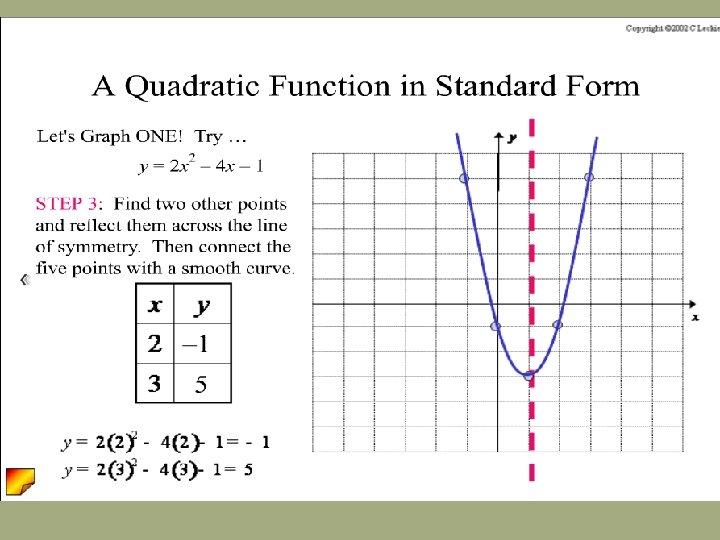

Exercises 1. 2. Plot the graph of: y = x 2 + 5 x +4 y = -2 x 2 – x- 6

3. Exponential Function
 = ax where")
The exponential function f with base a is defined by f(x) = ax where a > 0, a 1, and x is any real number. For instance, f(x) = 3 x and g(x) = 0. 5 x are exponential functions. 22 Copyright © by Houghton Mifflin Company, Inc. All rights reserved
 = 3 x when x = 2 is f(2) =")
The value of f(x) = 3 x when x = 2 is f(2) = 32 = 9 The value of f(x) = 3 x when x = – 2 is f(– 2) = 3– 2 = The value of g(x) = 0. 5 x when x = 4 is g(4) = 0. 54 = 23 Copyright © by Houghton Mifflin Company, Inc. All rights reserved
 = 2 x. x -2 -1 0 1")
Example: Sketch the graph of f(x) = 2 x. x -2 -1 0 1 2 f(x) (x, f(x)) ¼ (-2, ¼) ½ (-1, ½) 1 (0, 1) 2 (1, 2) 4 (2, 4) y 4 2 x – 2 2 24 Copyright © by Houghton Mifflin Company, Inc. All rights reserved
 = 2 -x. y f(x) = 2 x")
Example: Sketch the graph of g(x) = 2 -x. y f(x) = 2 x 4 x – 2 2 25 Copyright © by Houghton Mifflin Company, Inc. All rights reserved

THANK YOU
- Slides: 26