
Fully Allocated Cost Model Kai Monast Jeremy Scott
- Slides: 18
Fully Allocated Cost Model Kai Monast & Jeremy Scott Public Transportation Group NCSU-ITRE kcmonast@ncsu. edu jscott@ncsu. edu 1
What is the Fully Allocated Cost Model? A standard method for collecting expenses as a foundation for billing rates Why does NCDOT want you to use the FAC model? Using this model or something like it shows that you understand your expenses and you can use them to plan for financial security 2
How does your rate compare to others? That’s not the point. There are many reason why rates may be higher or lower. What is the best rate to have? The one that provides financial stability 3
Should I change my funding contracts to match the output of the model? Not necessarily. The model returns a general rate based on all of your trips. It is usually more expensive to provide service to some contracts over others and your rates may reflect this difference. 4
How can I use this to determine the rate I should charge for each contract? As a guide only. Further math combined with some policy goals and assumptions is necessary to determine specific rates. Ideally, you will have the actual service consumption (passenger miles? ) by contract and can use this to determine the proportion of service consumed by each agency. 5
Running the Model Use actual data from the previous year or projected data ◦ Even better, run the model using both methods to see the difference in rates Operate Multiple Modes (Deviated Fixed Route, Demand Response, and/or Brokered) ? ◦ Allocate your expenses and subsidies for each mode so the total equals the total expenses and subsidies ◦ Run the model for each mode 6
Expenses Fill out expenses by category Budget should be set up using G-Codes Fixed = administrative, does not vary by number of miles or hours Hours = mostly personnel Miles = mostly vehicles G 821 to G 882= decreases to overall expenses (revenues? ) ◦ But, not contract revenues or fares G 821 is where you enter local funds in excess of the required local match 7
In-Kind Services provided to you that you do not pay for ◦ Examples: rent, utilities, maintenance, legal representation, Ask finance director for Indirect Cost Study Does not impact your billing rates But, useful to have because: ◦ May be used as a match for some grants ◦ Helps you identify your true cost of service 8
Op. Stats Be consistent with what you used for Expenses (actual or projected, mode) Type of miles does not change the rates, but does change the interpretation Charge for services using different methods (passenger mile and service hour)? ◦ Enter new data in the Operating Statistics tab 9
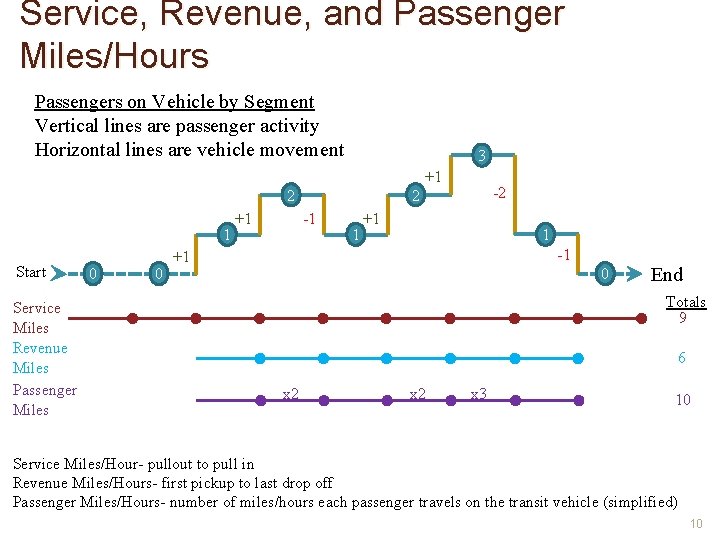
Service, Revenue, and Passenger Miles/Hours Passengers on Vehicle by Segment Vertical lines are passenger activity Horizontal lines are vehicle movement 3 +1 2 1 Start Service Miles Revenue Miles Passenger Miles +1 -2 2 -1 1 +1 1 -1 +1 0 0 0 End Totals 9 6 x 2 x 3 10 Service Miles/Hour- pullout to pull in Revenue Miles/Hours- first pickup to last drop off Passenger Miles/Hours- number of miles/hours each passenger travels on the transit vehicle (simplified) 10
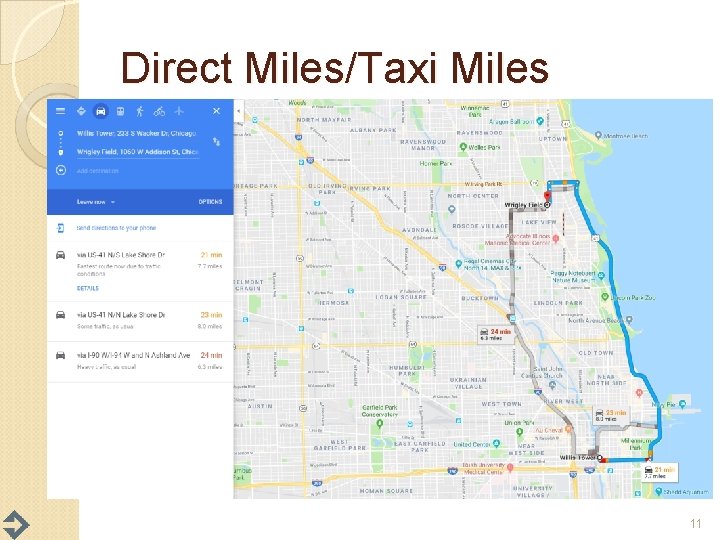
Direct Miles/Taxi Miles 11
Grant and Reserve Info CTP grant reduces the price for all trips Assumes the rate must generate the local match unless you discount this in Expenses (G 821) Program and Capital Reserve allow you to build reserves Use the Capital Reserve worksheet to predict needs, or type in estimated amount ROAP, 5310 and similar funds should be treated as contracts if you handle them like contracts 12
Vehicle Worksheet Subform you can use to estimate the Capital reserve Determines per mile cost, translates to annual cost and adds this to total expenses 13
Costs and Rates Red header show summary statistics from previous worksheets Green header shows rates by type WITH grants discounted- most will use this section Blue header shows rates by type WITHOUT grants discounted 14
Costs and Rates Per mile and hour rates assign fixed costs proportionally to the mile and hour rates Per mile/hour/passenger rate assigns fixed charges to passengers and variable charges to how they vary Where is zone rate? ◦ Cannot determine zone rates with just this information, need distance and trip counts by zone 15
Interpreting Hours and miles refers to the type of miles/hour on the Op. Stats worksheet These are the rates you would use if you needed to recover all of your expenses based on the operating statistics Average rates ◦ Use the rates as a starting point ◦ It is not necessary to charge all contracts the same rate ◦ If you can’t charge for no shows or wait time, increase the rates or add an administrative charge ◦ Passenger trip rates may need to have wide variations by funding source 16
Interpreting Rate seem to high? ◦ Did you include the excess local funds as negative expenses in G 821 and other revenues that reduce the overall cost of service (not contract revenue)? ◦ Are your operating statistics correct? Rate seem too low? ◦ Did you include all of your expenses? ◦ Are your operating statistics correct? 17
Fully Allocated Rate Model Kai Monast & Jeremy Scott Public Transportation Group NCSU-ITRE kcmonast@ncsu. edu jscott@ncsu. edu 18