FUEL MOISTURE AND WILDLAND FIRE DANGER 2012 FIRE


- Slides: 32
FUEL MOISTURE AND WILDLAND FIRE DANGER: 2012 FIRE SEASON OUTLOOK Jonathan Pangburn CAL FIRE Unit Forester San Benito-Monterey Unit March 15, 2012
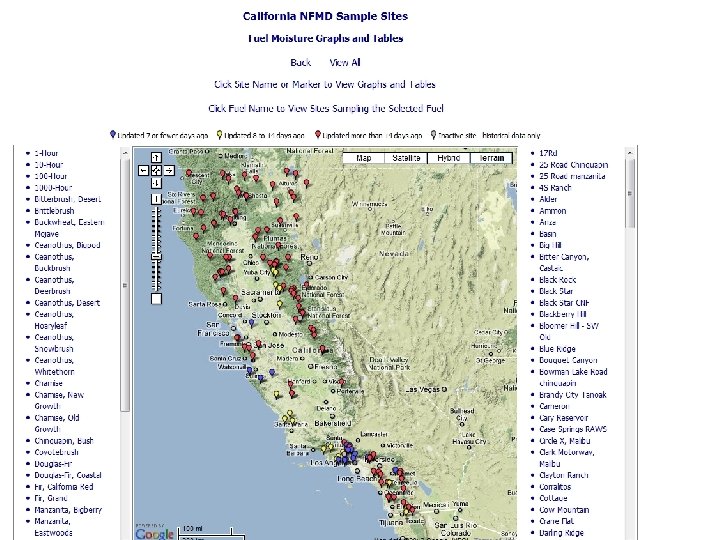
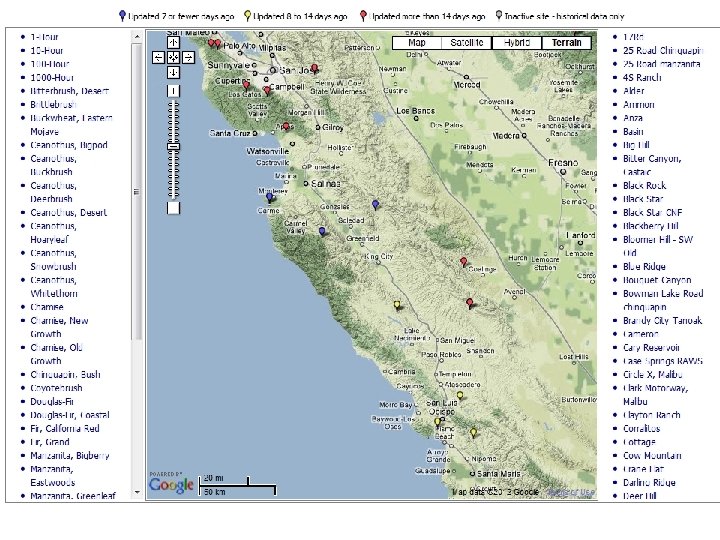
National Fuel Moisture Database � � http: //72. 32. 186. 224/nfmd/public/states_map. p hp? state=CA National database � Query entries � Google interface map for navigation � Historic data & graphs
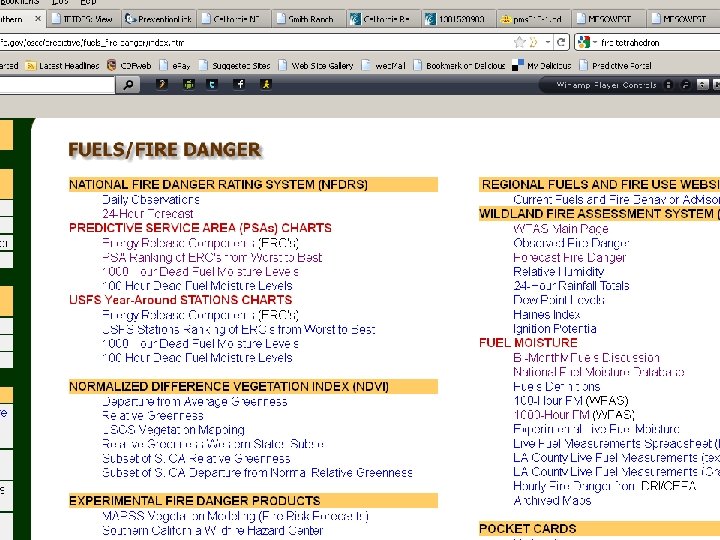
Southern CA GACC Fuels Info � � http: //gacc. nifc. gov/oscc/predictive/fuels_firedanger/index. htm Also check out link to Weather page: � Links to RAWS/NWS historic data � Webcast from meteorologist forecast and fuels discussion
200, 0% Local Fuel Moisture Data - 2011 BEU CHAMISE FUEL MOISTURE Historical Average New Growth 180, 0% Historical Average - Old Growth 160, 0% 2010 New Growth 140, 0% 2010 Old Growth 120, 0% 2011 Bear Valley New Growth 2011 Bear Valley Old Growth 100, 0% Critical 80, 0% 2011 Hastings New Growth 60, 0% 2011 Hastings Old Growth 40, 0% JANUARY FEBRUARY MARCH APRIL MAY JUNE JULY AUGUST SEPTEMBER OCTOBER NOVEMBER DECEMBER
Local Fuel Moisture Data - 2012 140% 2012 BEU FUEL MOISTURE Historic Average 130% 120% Average LFM 110% Lockwood 100% Parkfield 90% 80% Pebble Beach 70% Hastings 60% Bear Valley 50% Critical 40% JAN FEB MAR APR MAY JUN JUL AUG SEP OCT NOV DEC
Local Fuel Moisture Data, cont. Location Elevation 1 -hour 10 -hour Species Fuel Moisture Data available online at the National Fuel Moisture Database (click for link) Battalion 1 Hastings Battalion 2 Pebble Beach Battalion 4 Lockwood Stn. Battalion 4 Parkfield Stn. Battalion 6 Bear Valley Stn. 1, 800 350 2, 800 2, 200 1, 400 5% 9% 3% -- 3% Current Previous Change 2011 Chamise Old 74% 67% +7 84% Chamise New -- -- -- N/A Ceanothus Old 90% 81% +9 112% Ceanothus New -- -- -- N/A Manzanita Old 84% 85% -1 N/A Manzanita New -- -- -- N/A Chamise Old 65% 69% -4 N/A Chamise New -- -- -- N/A Manzanita Old 81% 88% -1 N/A Manzanita New -- -- -- N/A Chamise Old -- -- -- N/A Chamise New -- -- -- N/A Ceanothus Old -- -- -- N/A Ceanothus New -- -- -- N/A Chamise Old 89% 69% + 20 92% Chamise New -- -- 6% 10% 4% -- 4% The recent precipitation has led to a slight increase for fuel moisture in the unit. New growth is almost non-existent; where present, it’s on less than 25% of plants and less than 1/4 inch. The weather forecast calls for continued drought conditions overall, although there is a chance of precipitation this week. LFM is calculated by the formula (Live Sample Weight-Dry Sample Weight)/Dry Sample Weight 60% = critical LFM for chamise 80% = critical LFM for manzanita 100% = critical LFM for conifers 100% = critical LFM for sagebrush
Local Precipitation Data BEU Precipitation Monitor 35, 00 30, 00 Precipitation in Inches 25, 00 20, 00 15, 00 10, 00 5, 00 0, 00 Arroyo Seco* Bradley Hastings* Hernandez Hollister Parkfield Station 2006 2007 2008 2009 2010 2011 Annual Average
Local Precipitation Data, cont.
GACC Fuel Moisture Data
GACC Fuel Moisture Data 1, 000 Hour Fuel Moisture is the lowest reading on record (new minimum right now)
GACC Fuel Moisture Data, cont.
GACC Fuel Moisture Data, cont. 1, 000 Hour Fuel Moisture is near new minimum right now
GACC Fuel Moisture Data, cont.
GACC Fuel Moisture Data, cont. 100 Hour Fuel Moisture is near minimum, well below average
GACC Fuel Moisture Data, cont.
GACC Fuel Moisture Data, cont. 100 Hour Fuel Moisture is at a new minimum
Energy Release Component, cont.
Energy Release Component, cont. ERC at new maximum right now
Energy Release Component, cont.
Energy Release Component, cont. ERC at new maximum right now
Region Monthly Outlook � Outlook for March: � Below normal precipitation for region � Near normal temperatures central CA to above normal in southern CA � Near normal large fire potential � Weather conditions turning drier and warmer toward the end of the month http: //gacc. nifc. gov/oscc/predictive/outlooks/myfiles/psamonth. pdf
Region Monthly Outlook
Region Seasonal Outlook � Outlook for March-June: � Below normal precipitation over the entire region � Above normal temperatures � Drought developing and expanding over the region by spring � Above normal potential in most of the mountain areas as well as inland valley and foothill regions away from the coast http: //gacc. nifc. gov/oscc/predictive/outlooks/myfiles/assessment. pdf
Region Seasonal Outlook, cont. � Outlook for March-June: � La Niña weakening, ending altogether by spring � Continuation of below average precipitation will likely continue this spring � Very little additional rainfall can be expected through the springtime months, especially over Southern CA � 2011 -2012 will undoubtedly finish will far below normal rainfall over nearly the entire region http: //gacc. nifc. gov/oscc/predictive/outlooks/myfiles/assessment. pdf
Region Seasonal Outlook, cont. � Outlook for March-June: � Above normal large fire potential for many inland mountainous regions, especially in May and June � Uncertainty if monsoon season will bring any relief to expected dry conditions http: //gacc. nifc. gov/oscc/predictive/outlooks/myfiles/assessment. pdf
Region Seasonal Outlook
Region Fuels Discussion � � � Fuel dryness is expected to accelerate rapidly this spring as daylight hours become longer and the solar angle becomes higher Seasonal grasses, which only saw limited greenup this year, will be fully cured by early to mid April Heavier fuels and live fuels will likely become dry enough in May to support fire during windy periods
Region Fuels Discussion, cont. � � � Higher elevations: lack of snowpack may allow mature timber stands to carry fire this summer Drought conditions are already being experienced over portions of the state Much of central and southern CA (including BEU) is in a D 1, or moderate, drought status Late spring to summer, expect this area to intensify and expand over much of the state Lack of winter runoff will prevent reservoir storage from gaining volume
Drought Map