FTT no more How to identify define and


 • Seen in relation to acute illness or chronic")


 Independent anthropometric assessment tool to determine malnutrition in children")


 Find Mid-point Value at Intersection Document which arm")


 Grams per month")


- Slides: 58
FTT no more! How to identify, define, and treat pediatric malnutrition Kristy Paley, MS, RD, LDN, CNSC Pediatric Registered Dietitian Pediatric Intensive Care/Pediatric Complex Care Duke University Hospital
Objectives Define and interpret the etiology, severity, and mechanism of pediatric malnutrition Identify AND/ASPEN pediatric malnutrition indicators and apply them to clinical practice Describe best practice and considerations in the nutrition treatment plan for pediatric patients with malnutrition
Importance of Identifying Malnutrition Can Lead To… Increased Infection Risk Poor Wound Healing Increased Days on Ventilator Increased Hospital LOS/ICU LOS Increased Re. Admission Rate Increased Mortality Improve nutrition status earlier in order to improve outcomes The sooner it is identified, the sooner nutrition intervention can occur If patient not identified as malnourished on admission but "develops the condition" during hospitalization and malnutrition is not identified and treated, CMS may deem it Hospital Acquired Condition* • less likely to pay additional monies • may penalize institution
Frequency of Malnutrition Previously under recognized 6 -51% prevalence of illness-related malnutrition in hospitalized children Mc. Laren Criteria < 4 years; MAC and HC used Gomez Criteria Fails to assess proportionality of wt in relation to ht FTT Decrease by 2 centiles of wt <5%tile Waterlow Criteria 1 -3 years; acute and chronic malnutrition criteria
Goals of New Definition Early identification of malnutrition Development of uniform screening tools Malnutrition prevalence comparison between studies and centers Collect meaningful data Development of thresholds for intervention Evidence-based analysis of the impact of malnutrition and its treatment on patient outcomes
“ Defined as an imbalance between nutrient requirement and intake, resulting in cumulative deficits of energy, protein, or micronutrients that may negatively affect growth, development, and other relevant outcomes This type referred as “undernutrition” Includes hospitalized and un-hospitalized children ages 1 month 18 years Excludes malnutrition in developing world ”
Out with the Old… Kwashiorkor Wasting Marasmus PEDIATRIC MALNUTRITIO N Stunting Failure to Thrive
In with the New… Severity Chronicity Etiology
Etiology Illness-Related Non-illness Related (Environmental/Behavioral) • Seen in relation to acute illness or chronic disease • Mechanisms include: • Nutrient loss • Increased energy expenditure • Decreased nutrient intake • Altered nutrient utilization • Often include socioeconomic conditions associated with food insecurity • May include behavioral disorders such as anorexia or food aversion • Mechanism must be: • Decreased nutrient intake
Types of Malnutrition Acute Duration < 3 months Hallmark = decrease in wt for lt or BMI for age Chronic Duration >3 months Growth deficits Stunted Height may be present
Pediatric Malnutrition Consensus Statement To identify a basic set of indicators that can be used to diagnose and document undernutrition in the pediatric population ages 1 month to 18 years The recommended indicators were based on available literature The indicators may change as additional information and validation occurs Assessment for pediatric malnutrition related to undernutrition should be completed on children at risk for malnutrition related to undernutrition
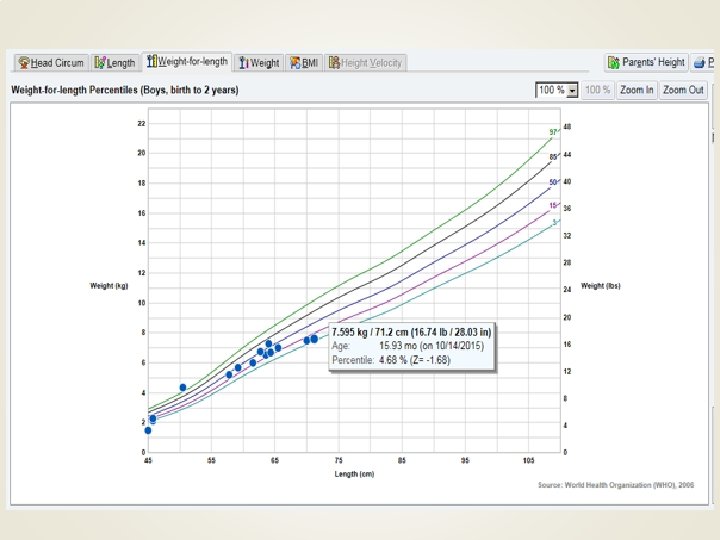
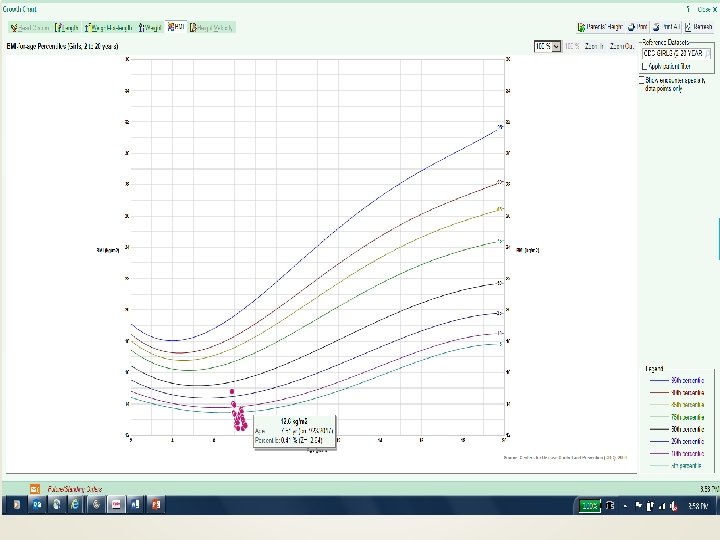
Assessment of the patient at risk for malnutrition should include: Anthropometrics • Weight for age, Length or Standing Height for age • Weight for Length or BMI for age • MUAC (as indicated) Growth Parameters • Growth assessment related to the recommended standard (WHO growth charts for ages 0 – 24 months and the CDC growth charts for ages 2 -18 years) • Weight gain velocity or weight loss • Deceleration of weight for length or BMI for age across Z score lines Nutrient Intake and Needs • Estimated energy and protein needs • Estimated average/usual intake
Indicators of pediatric undernutrition Single Data Point Weight for Length/BMI for age z score Multiple Data Point Weight Gain Velocity (<2 yrs) Lt/Ht for age z score Weight Loss (2 -20 yrs) MUAC Deceleration in weight for length / BMI for age
What is a “z-score”? Indicates how far a measurement is from the median score (z = 0) AKA Standard Deviation Score Reference lines = Z score lines
Gaussian Distribution Function
Why Z scores are better Allow for more precision in describing anthropometrics Can track acute changes in malnutrition More clearly defines growth failure Recommended by WHO
Z score Resources WHO <2 yrs STAT growth charts CDC 2 -10 yrs STAT growth charts WHO z score charts Epi info Nut. Stat Electronic charting system CDC website Pedi. Tools Electronic charting system Pedi. Tools
Primary Indicators: Single Data Point Mild malnutrition Moderate malnutrition Severe malnutrition Weight for length z score -1 to -1. 9 z score -2 to -2. 9 z score -3 or greater z score BMI for age z score -1 to – 1. 9 z score -2 to -2. 9 z score -3 or greater z score Length / height z score No data -3 z score Mid-upper arm circumference Less than – 1 z score for age/ 12. 5 -13. 4 cm Less than -2 z score for age Less than – 3 z score for /11. 5 -12. 4 cm age / <11. 5 cm
Weight for length Primary indicator Mild malnutrition Moderate malnutrition Severe malnutrition Weight for length/height z score -1 to -1. 9 z score -2 to -2. 9 z score -3 or greater z score
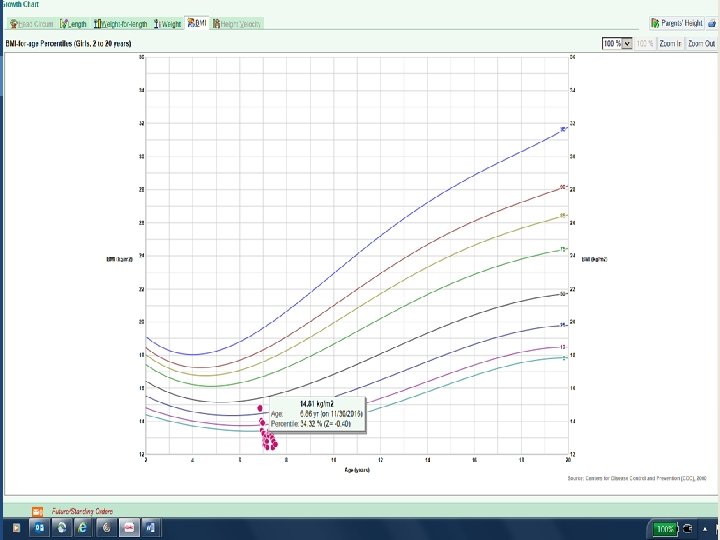
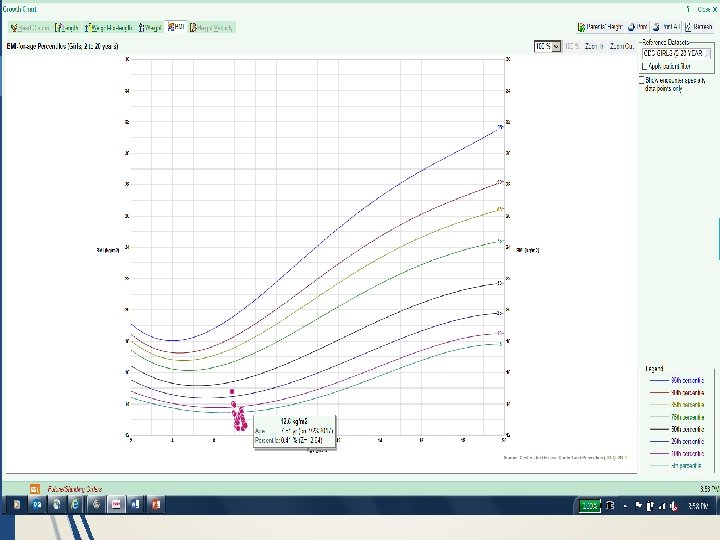
BMI for age Primary indicator Mild malnutrition Moderate malnutrition Severe malnutrition BMI for age z score -1 to -1. 9 z score -2 to -2. 9 z score -3 or greater z score
Length/Height z score Primary indicator Mild malnutrition Moderate malnutrition Severe malnutrition Length / height z score No data -3 z score
Mid Upper Arm Circumference (MUAC) Independent anthropometric assessment tool to determine malnutrition in children 6 months to 5 years (60 months) of age Has been correlated to BMI Serial measurements can be used to detect changes in body composition when z scores are n/a More sensitive prognostic indicator for mortality than weight for length parameters in malnourished patients
When to use MUAC When weight is affected by fluid When serial z scores for anthropometrics unavailable When unable to obtain accurate Ht Conjoined twins Casts/ Prosthetics
Mid-Upper Arm Circumference Primary indicator Mild malnutrition Moderate malnutrition Severe malnutrition Mid-upper arm circumference Less than – 1 z score for age/ 12. 5 -13. 4 cm Less than -2 z score for age / 11. 5 -12. 4 cm Less than – 3 z score for age / <11. 5 cm.
Performing Mid Upper Arm Circumference (MUAC) Find Mid-point Value at Intersection Document which arm used to ensure repeat measurements are on the same arm
Primary Indicators: Multiple Data Point Mild malnutrition Moderate malnutrition Severe malnutrition Weight gain velocity (< 2 years of age) Less than 75% of the norm for expected weight gain Less than 50% of the norm for expected weight gain Less than 25% of the norm for expected weight gain Weight loss (2 -20 years of age) 5% usual body weight 7. 5% usual body weight 10% usual body weight Deceleration in weight for length / BMI z score Decline of 1 z score Decline of 2 z score Decline of 3 z score Inadequate nutrient intake 51 -75% estimated energy / protein need 26 -50% estimated energy / protein need ≤ 25% estimated energy / protein need
Weight Gain Velocity Mild malnutrition Moderate malnutrition Severe malnutrition Weight gain velocity (< 2 years of age) Less than 75% of the norm Less than 50% of the norm Less than 25% of the norm for expected weight gain
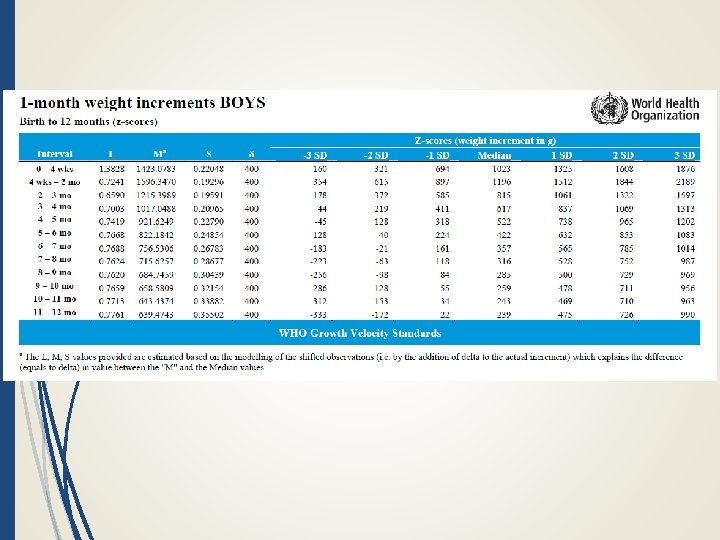
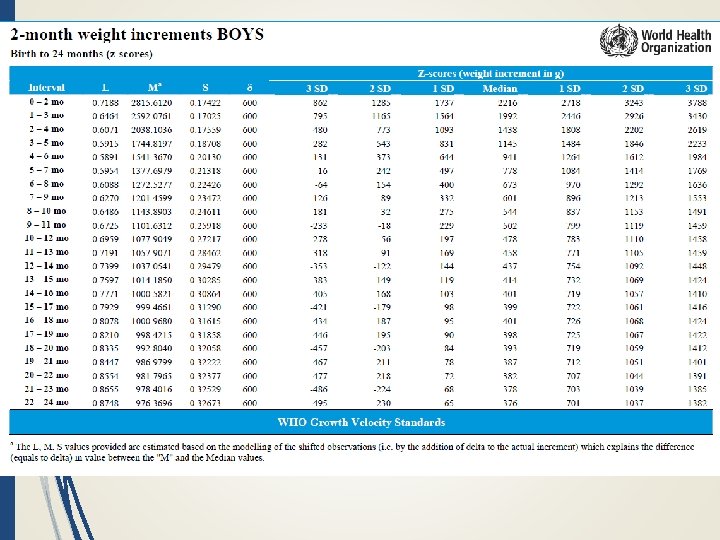
WHO Growth Standards Multiple data points; short term assessment Can track progress over time Decelerate/Accelerate Plotted points moving towards the medium is the goal (z=0) Monthly tables Use the table that most closely matches the interval between visits Daily assessment for infants
Weight gain velocity assessment: Age / boys Grams per day (median) Grams per month (median) Mild malnutrition <75% norm/median Moderate malnutrition Severe malnutrition <50% norm/median <25% norm/median g. per day g. per monthly Interval . interval g. per day g. per monthly . interval 0 -30 days 34 1023 25 766 17 510 8 254 30 -60 days 39 1196 29 895 19 596 9 297
Weight Loss Mild malnutrition Moderate malnutrition Severe malnutrition Weight loss (2 -20 years of age) 5% usual body weight 7. 5% usual body weight 10% usual body weight
Weight loss percentage of usual body weight Teenage male. Age 15 years Diagnosis: Hodgkin’s Lymphoma. In patient stay: on parenteral nutrition support due to mucositis. June to July 2015. Patient was discharged home on po ad lib August 1, 2015. Outpatient visits: reports of poor po intake, grazing throughout the day on small amounts of snack foods. No meals or oral nutritional supplements per nutrition history.
Case Study for Weight loss ages 2 to 20 years Indicator: Date Height Weight % wt loss BMI for age July 1 2015 173. 5 cm / HZA 0. 09 55 kg UBW 18. 33 - 0. 48 July 15, 2015 174 cm / HZA 0. 08 53. 4 kg 2% 17. 8 - 0. 68 August 1, 2015 174 cm / HZA 0. 08 51 kg 7% 17 - 1. 15 August 15, 2015 173. 5 cm / HZA 0. 09 49 Kg 10% 16. 33 - 1. 25 September 1, 2015 173. 5 cm / HZA 0. 1 48. 2 kg 12% 16 - 1. 31 October 1, 2015 173. 5 cm / HZA 0. 1 47. 6 Kg 13. 6% 15. 86 - 1. 46
Deceleration in Wt/Lt or BMI for age Mild malnutrition Moderate malnutrition Severe malnutrition Deceleration in weight for length / BMI z score Decline of 1 z score Decline of 2 z score Decline of 3 z score
Inadequate Nutrient Intake Mild malnutrition Moderate malnutrition Severe malnutrition Inadequate nutrient intake 51 -75% estimated energy / 26 -50% estimated energy / ≤ 25% estimated energy / protein need
Mehta, N. , Corkins, M. , Lyman, B. , Malone, A. , Goday, P. , Carney, L. , Monczka, J. , Plogsted, S. , Schwenk, F. , ASPEN Board of Directors. (2013). Defining pediatric malnutrition: A paradigm shift toward etiology-related definitions. JPEN: 37(4): 460 -81.
Case Studies
7 yo F, Wilm’s tumor, chemoinduced cardiomyopathy Indicators Data Malnutrition? Height: 121. 5 cm 29%ile (Z = -0. 57) None Weight: 18. 6 kg 3 %ile (Z= -1. 86) BMI: 12. 6 < 3 rd %ile, z - 2. 64 Moderate Change in BMI z score (11/16): 0. 4 (7/17): -2. 64 Moderate MUAC 11. 4 cm Severe Weight Loss 17% over 5 month Severe period Nutrient intake 50% of needs Moderate Severe chronic malnutrition (illness-related; cancer) related to decreased nutrient intake as evidenced by 17% wt loss over the past 5 months, MUAC 11. 4.
2 mon F, h/o emesis, feeding refusal, volume limitation x 2 mon, GERD Indicators Data Malnutrition? Height: 55 cm 1 %ile (Z = -2. 28) None Weight: 3. 915 kg <1 %ile (Z= -3. 29) Wt for Lt 3 %ile, z – 1. 79 Mild Wt gain velocity 11. 5 g/day gain x 1 month (<50% goal) Moderate MUAC and Wt loss n/a Deceleration in wt Decrease by 1. 14 Mild for lt z x 1 month Nutrient intake >100% of needs None Moderate acute malnutrition (illness-related; GERD) related to decreased nutrient intake, nutrient loss as evidenced by wt gain velocity <50% of goal over the past 1 month.
Next Steps: Nutrition Care Process Nutrient Delivery Coordination of Nutrition Care Nutrition Intervention Nutrition Counseling Nutrition Education
Nutrition Intervention for Mild Malnutrition High Kcal, High Protein diet: 1. 25 -1. 5 x estimated needs Oral nutritional supplements to meet 50% estimated kcal/protein requirements Protein / calorie boosters Analysis of nutrient intake
Nutrition Interventions for Moderate Malnutrition Mild Malnutrition Nutrition Therapy Protocol with close monitoring for improvement If weight gain goals not met, provide enteral nutrition support up to 50% of estimated kcal/protein needs until weight goals are met Non-functioning gut: parenteral nutrition support
Nutrition Interventions for Severe Malnutrition Provide 100% nutrient needs via nutrition support until child meets weight gain goals or meets criteria for moderate malnutrition Then implement moderate malnutrition protocol If there is a functioning gut: use it Enteral nutrition support Standard pediatric enteral formula Peptide based enteral formula Amino acid based formula Non-functioning gut: parenteral nutrition support
Refeeding Syndrome Described as “the electrolyte depletion, fluid retention, and altered glucose homeostasis that occurs in malnourished patients on commencing oral, enteral, or parenteral nutrition”
Refeeding pathophysiology. Christian D. Pulcini et al. Pediatrics in Review 2016; 37: 516523 © 2016 by American Academy of Pediatrics
Refeeding Syndrome Initial Refeeding MUST be slow Start @25 -50% of estimated kcal needs Advance over 3 -7 days, with kcal increases of 10 -25% daily Baseline and at least daily metabolic panel 100 -300 mg/day oral thiamine (50 -100 mg IV) prior to feeding and continue for 3 days Daily MV Monitor fluid overload; initial provision of maintenance fluid reasonable Correct electrolyte disturbances while starting refeeding
Malnutrition ICD-10 codes E 44. 0 • Malnutrition of Moderate Degree E 44. 1 • Malnutrition of MILD degree E 46 • Unspecified proteincalorie malnutrition E 4 3 • Other Severe Protein-Calorie Malnutrition Complicating Conditions (CC) Major Complicating Conditions (MCC)
Call to Action: Next Steps Use the recommended diagnostic indicators to identify and document nutritional status Make every effort to obtain accurate anthropometrics, including MUAC, and enter in electronic charting system to allow for improved tracking between visits and between institutions Members of healthcare team should determine strategies for implementation compatible with own institutions policies and procedures
Questions?
References: Mehta, N. , Corkins, M. , Lyman, B. , Malone, A. , Goday, P. , Carney, L. , Monczka, J. , Plogsted, S. , Schwenk, F. , ASPEN Board of Directors. (2013). Defining pediatric malnutrition: A paradigm shift toward etiology-related definitions. JPEN: 37(4): 460 -81. Becker, P. , Carney, L. , Corkins, M. , Monczka, J. , Smith, E. , Smith, S. , Spear, B. , White, J. , Academy of Nutrition and Dietetics, American Society for Parenteral and Enteral Nutrition. (2015). Nutrition in Clinical Practice: 30(1): 147 -61. WHO child growth standards: Training course on child growth assessment. Geneva: World Health Organization, 2008. WHO Child Growth Standards: Methods and development. Growth velocity based on weight, length and head circumference WHO Multi-center Growth Reference Study Group. WHO Child Growth Standards: Growth velocity based on weight, length and head circumference: Methods and development. Geneva: World Health Organization, 2009 Groleau, V. , Thibault, M. , Doyon, M. , Brochu, E. , Roy, C. , Babakissa, C. (2014). Malnutrition in hospitalized children: prevalence, impact, and management. Canadian Journal of Dietetic Practice and Research: 75(1): 29 -34. Hecht, C. , Weber, M. , Grote, V. , Daskalou, E. , Dell’Era, L. , Flynn, D. , Gerasimidis, K. , gottrand, F. , Harman, C. , Hulst, J. , Joosten, K. , Karagiozoglou-Lampoudi, T. , Koetse, H. , Kolacek, S. , Ksiazyk, J. , Niseteo, T. , Olszewska, K. , Pavesi, P. , Piwowarczyk, A. , Rousseaux, J. , Shamir, R. , Sullivan, P. , Szajewska, H. , Vernon-Roberts, A. , Koletzko, B. (2014). Disease associated malnutrition correlates with length of hospital stay in children. Clinical Nutrition (34): 53 -59. Leite, H. , Peixoto de Lima, L. , Brasil de Oliveira Iglesias, S. , Pacheco, J. , Brunow de Carvalho, B. (2012). Malnutrition may worsen the prognosis of critically ill children with hyperglycemia and hypoglycemia. JPEN: 37(3): 335 -41. Pulcini, C. , Zettle, S. , Srinath, A. (2015). Refeeding syndrome. Pediatrics in Review: 37: 516. Calleja Fernandez, A. , Pintor de la Maza, B. , Vidal Casariego, A. , Villar Taibo, R. , Lopez Gomez, J. , Cano Rodriguez, I. , Ballesteros Pomar, M. (2015). Food intane and nutritional status influence outsomes in hospitalized hematology-oncology patients. Nutr Hosp; 31(6): 2598 -605.