FTMW SPECTROSCOPY AND DETERMINATION OF THE 3 D


 heavy diatom")

 ・asymptotic term (attractive) q-dependence Legendre func.")
-F 12 b/aug-cc-p. V 5 Z 2016 grid points R :")


 FTMW spectroscopy (4 -40")


 Ar-C 34 S (MHz) A 27908. 04 A")
- Slides: 18
FTMW SPECTROSCOPY AND DETERMINATION OF THE 3 -D POTENTIAL ENERGY SURFACE FOR Ar-CS CHISATO NIIDA, MASAKAZU NAKAJIMA, and YASUKI ENDO Department of Basic Science, The University of Tokyo YOSHIHIRO SUMIYOSHI Department of Chemistry and Chemical biology, Gunma University YASUHIRO OHSHIMA Department of Photo-Molecular Science, Institute for Molecular Science HIROSHI KOHGUCHI Department of Chemistry, Hiroshima University, Higashi-Hiroshima
ATOM-DIATOM SYSTEM Possibility to determine the full 3 -dimensional potential energy surface Van Der Waals vibrations: R and q Diatom vibration: r Fit all the data including those of isotopomers and vibrationally excited states of diatom Ar S θ R r C
PREVIOUS STUDIES FOR ATOM–DIATOM SYSTEMS IN OUR LAB Rg-SH ・Y. Sumiyoshi et al. J. Chem. Phys. , 123, 054324 (2005) ・Y. Sumiyoshi et al. J. Chem. Phys. , 123, 054325 (2005) Rg-OH ・Y. Sumiyoshi et al. J. Chem. Phys. , 125, 124307 (2006) ・Y. Sumiyoshi et al. Mol. Phys. , 108, 2207 (2010) Rg-NO ・Y. Sumiyoshi et al. J. Chem. Phys. , 127, 184309 (2007) ・Y. Sumiyoshi et al. J. Phys. Chem. , 114, 4798 (2010) SH and OH systems: 3 -dimensional potential NO system: 2 -dimensional potential all are open-shell systems
CURRENT STATUS OF THE STUDIES OF ATOM –DIATOM SYSTEMS Ar-CO Analysis for all the reported data including microwave, mm, sub-mm wave, infrared is in progress to determine the 3 -d potential by Y. Sumiyoshi (Gumma University) Ar-CS Previously, 28 rotatinal lines have been observed, which were analyzed by a rigid rotor Hamiltonian. In the present study, we have determined the 3 -d potential
ENERGY LEVEL STRUCTURE OF THE ATOM– DIATOM SYSTEM Ar–CS (CS: 1 S) heavy diatom relatively large dipole moment (1. 8 D) limit of the free rotor model? Free Rotor Model j : internal rotation angular momentum of CS j L : overall rotation of the complex J=L+j K : projection of j and J onto the complex axis Ar J K j S L K C
HAMILTONIAN FOR THE SYSTEM Overall rotation with intermolecular potential Diatom intetnal rotation and vibration CS potential (fitted to the known data for CS)
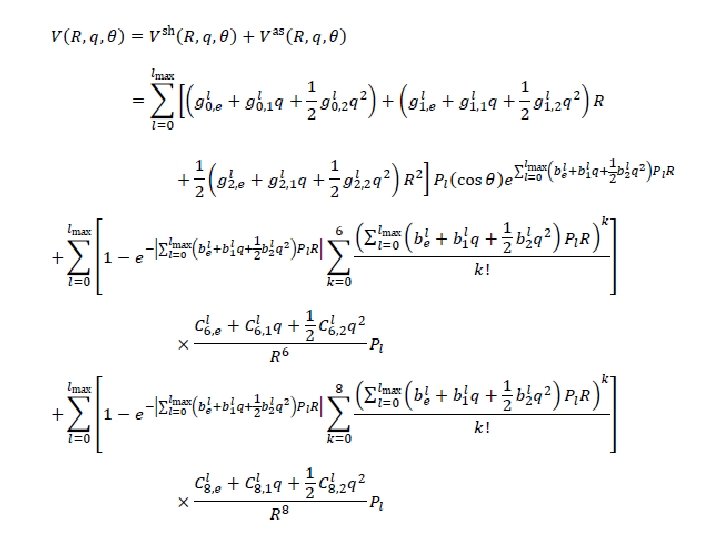
INTERMOLECULAR POTENTIAL ・short range term (repulsive) ・asymptotic term (attractive) q-dependence Legendre func.
INITIAL POTENTIAL PARAMETERS CCSD(T)-F 12 b/aug-cc-p. V 5 Z 2016 grid points R : 3. 0 – 15 Å, r : 7 points (re– 0. 15 Å – re+0. 15 Å) q : 0 – 180° at every 30° and 105°) The calculated energies were fitted to the function with 56 potential parameters including the q (= r – re) dependent terms. S θ R Ar r C
CALCULATION OF ENERGY LEVELS Basis Functions Over all Rotation and Diatom Rotation jmax = 20 Intermolecular stretch and monomer vibration vmax = 18 vsmax = 6 (anharmonic vibration) numerical diagonalization of the matrices up to N=10, 000
ENERGY LEVEL DIAGRAM OF AR–CS splitting of the energy levels by the anisotropic potential red: observed levels
OBSERVATON OF THE SPECTRA Ar + CS 2 (0. 1%) FTMW spectroscopy (4 -40 GHz) FTMW mm-wave DR (60– 70 GHz) electric discharge C 32 S vs=0 vs=1 vs=2 C 34 S vs=0 36 lines 24 lines 22 lines Ar-CS J, K = 2, 2– 3, 1 16 lines J, K = 1, 1– 1, 0
RESULTS All the observed data were fitted wih s = 46 k. Hz Adjusted 13 parameters among 56 pot. params. The fitted potential energy surface at q = 0 The most stable structure (T-Shaped) Ar S R = 3. 966 Å θ = 109. 5° C r = 1. 5348 Å q R
ENERGY ALONG THE MINIMUM ENERGY PATH Ar–SC Ar–CS fitted Large discrepancey at the linear config. ab initio present data: limited to the region around the energy minimum (amplitude of the vibration is smaller)
INTERMOLECULAR DISTANCE ALONG THE MINIMUM ENERGY PATH R/Å fitted ab initio 0. 022 Å 0. 030 Å 0. 0047 Å angle / ° fairly good agreement in a limited region
Q-DEPENDENCE OF THE POTENTIAL R/Å q = -0. 1 Å q= 0 Å q = 0. 1 Å energy / cm– 1 Potential is deeper when r (q) is larger
CONCLUSIONS More than 100 rotational transitions were observed for the Ar–CS complex, including those of excited vibrational states (vs = 1, 2) and the 34 S isotopomer. All the data were fitted to determine the 3 -d potential energy surface with the standard deviation 46 k. Hz. Fairly accurate potential energy surface has been determined around the minimum. However, a large discrepancy has been observed around the linear configuration.
Molecular constants Ar-C 32 S (MHz) Ar-C 34 S (MHz) A 27908. 04 A 27466. 58 B 1519. 16 B 1487. 39 C 1395. 03 C 1364. 56 ΔIeff. ― ΔIeff. 11. 49 amu・Å2 near prolate molecule H. Kohguchi, master’s thesis (1993)