FTIR 101 and FTIR ComplianceBased Methods Bryan Benaway

FTIR 101 and FTIR Compliance-Based Methods Bryan Benaway Spectrum Environmental Solutions May 25, 2017

FTIR 101 –Background/Theory • Invented in 1887 by Albert Michelson • 1907 Nobel Prize in Physics �Blackbody IR Radiation is “Organized” into a Usable Pattern by Michelson Interferometer �Interferogram FT Spectra

Deciphering the “Black Box” of FTIR PHOTON DISSAPEARS! photon carbon monoxide object d e ct R le f e passes straight through ABSORBANCE

Deciphering the “Black Box” of FTIR frequency
 Deciphering the “Black Box” of FTIR frequency")
amount of light lost (absorbance) Deciphering the “Black Box” of FTIR frequency

Deciphering the “Black Box” of FTIR constant

Advantages and Disadvantages Pros � Real-time measurements, processing and display � Simultaneous quantification of many compounds � Totally automated after initial setup � Remote access capability � Minimal calibration required � Uses full intensity of signal and full IR bandwidth at once, unlike CO CEMs for instance. � Sensitivity (low ppb DLs) � Stores spectra electronically – *Never lose sample Cons � Easy to obtain inaccurate data if not analyzed correctly � Skilled spectroscopist needed for proper analysis and validation of results � Existing FTIR-based EPA methods are somewhat complex and often require adaptation. � Extraction of reactive components can be challenging � Requires routine maintenance � Mobility - heavy and bulky � Relatively expensive � *Never lose sample

FTIR-Based Compliance Methods �EPA Method 320 – Measurement of Vapor Phase Organic and Inorganic Emissions by Extractive Fourier Transform Infrared (FTIR) Spectroscopy �ASTM D 6348 -12 Standard Test Method for Determination of Gaseous Compounds by Extractive Direct Interface Fourier Transform Infrared (FTIR) Spectroscopy �EPA Method 318 Extractive FTIR Method Measurement of Emissions from the Mineral Wool and Wool Fiberglass Industries �EPA 321 Gaseous Hydrogen Chloride Emissions at Portland Cement Kilns by FTIR

EPA 320 Overview �“Persons unfamiliar with basic elements of FTIR spectroscopy should not attempt to use this method” Ø “This Method is self-validating provided that results meet the performance requirement of the QA spike…and the results from a previous method validation study support the use of this method in the application”

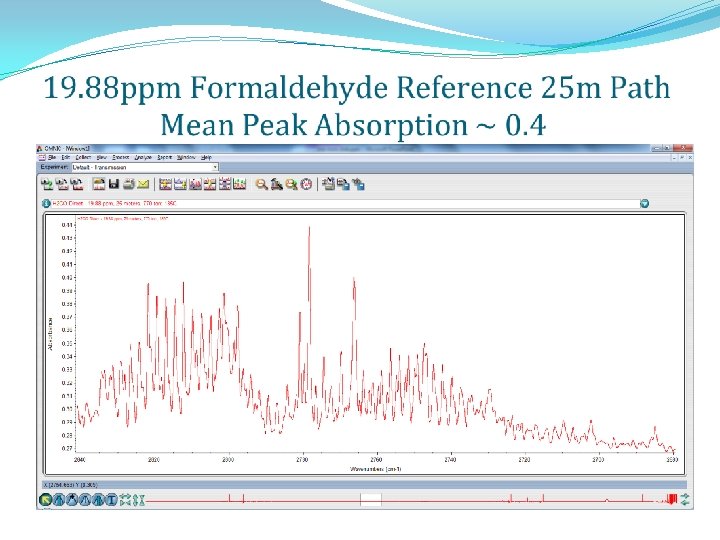
EPA Method 320 and ASTM D 6348 -12 Required QA Data EPA Method 320 � CTS – before and after each run – the peak absorbance must remain within 5% of mean � Used to verify line position and resolution � CTS standard must have at least 1 absorption band within 25% of wavenumber position of analytical regions of interest. � Commonly used to verify cell pathlength for adjustable path cells � QA Spikes – 3 independent samples before testing � Performed into extracted sample at no more than 10% of extracted volume. � Spiked concentration should be at or near native levels � 70 -130% recovery criterion � Response Time � Calculated from QA Spike � Time to reach a steady state ASTM Method D 6348 -12 � CTS - before and after entirety of testing or at beginning/end 0 f day � RPD of 5% or less � Commonly to verify cell pathlength for adjustable path cells � QA Spikes - � Direct inject within 10% or 5 ppm (for reactive analytes) of certified concentration � into extracted sample at no more than 10% of extrconcentrationacted volume. � Spiked should approximate (or be within ± 50% of) the native levels � 70 -130% recovery criterion � Response Time � Verified 3 ways – mechanical response time, equilibrium response and zero test � Time to get to 95% of cylinder or native values

Typical 320 Sampling Setup

Leak Checking ASTM Method D 6348 -12 �Not required if mechanical response test performed in the field and passes. � Must run Mechanical Response test at similar pressure/vacuum conditions as during testing �Only performed pre-test! �No other guidance in ASTM Method regarding leak checks. � As a rule, we perform pre- and post-leak checks of the entire system using 0 -1 (or smaller) lpm rotometers attached on the pump side of the FTIR. � Passing criteria < 0. 2 lpm

Leak Checking EPA Method 320 �Independent FTIR cell and sample system leak checks and only required pre-test 1. 2. Evacuate sample system to terminal vacuum and monitor rotometer on pump side of FTIR. Flow out must be <0. 2 lpm –Be sure to use a rotometer with adequately resolved graduations. Evacuate FTIR cell to terminal vacuum and isolate from the pump. Monitor the pressure increase over 2 min. Calculate % volume leaked (%VL). %VL must be less than 4% of the sample volume (<4% dilution).

Minimum Detection Limits �M 320 has ~6 way to determine DL/uncertainty but only considers 4 ways � OFU=Max(FMU, FCU, FAU, FRU)=FMU �Alternate is 3*Standard Deviation of a data set containing the sample matrix but absent of the analyte � Straight from statistics books and represents >99. 7% confidence level

NEA Spectra and their value �NEA=Noise Equivalent Absorbance = Zero Spectrum � Used to calculate RMS and peak-to-peak instrument noise. �Required for both EPA 320 and ASTM D 6348 Methods �Demonstrates that FTIR is properly aligned and has no other serious issues. �Main use is to calculate a Noise-based Minimum Detection Limit � The analyte concentration at which its peak absorption is equal to the absorption due to the inherent noises from the instrument

System Noise on 28 m Pathlength System RMS = 0. 0001428

• Best case DL occurs when ABSsys is minimized down to the instrument’s noise floor, the noise-limited minimum detection limit NMDL �

EPA 320 and ASTM Analyte Spikes �Both the QA and validation spikes are performed by injecting gas standard into the extracted sample � 320 QA Spike(s) �Performed in triplicate, at onset of project, for each Analyte �Use assumes validation has been performed �ASTM QA Spikes – One required at onset per project � 320 (301 -like) Method Validation �Performed once per source � 12 spiked and 12 unspiked pairs �More extensive statistical validation � Used to determine applicability, tstat, systematic bias, precision and correction factor �Not required for ASTM Method �Common practice to use a tracer to calculate dilution
 Directly inject standard into FTIR cell and record FGHG and")
QA Spiking Procedure 1) Directly inject standard into FTIR cell and record FGHG and tracer concentrations (Analytedir & Trdir) 2) Spike standard into extracted flow (3 times per 320, once per ASTM) & record analyte and tracer concentrations � Spike flow < 10% of extracted flow 3) Calculate dilution factor DF=Trspike/Trdir 4) Calculate expected concentration � CE = DF*Analytedir + (1 -DF)*Native Acceptance Criterion is ± 30% of CE

The End Thank You, Questions?
- Slides: 21