
FT dating a convenient radiometric dating method for






- Slides: 44
FT-α dating: a convenient radiometric dating method for geological glasses using natural fission-track measurement and alpha-ray spectrometry with CR-39 nuclear track detectors Tatsuo Suzuki Faculty of Education, Kagoshima University
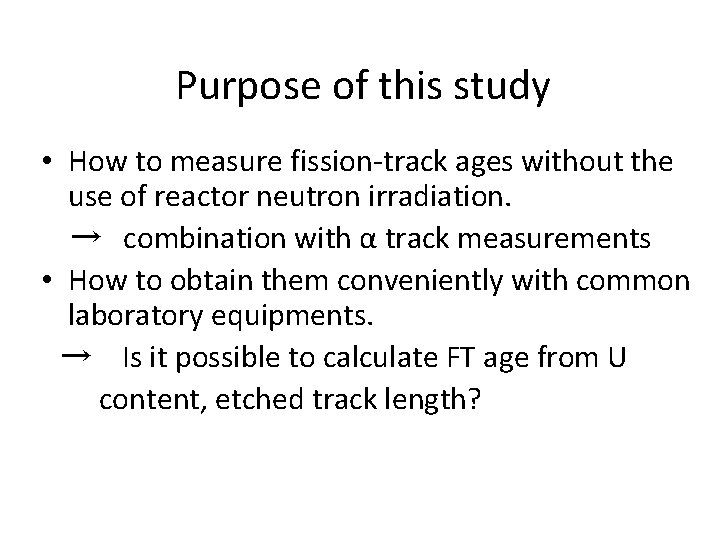
Purpose of this study • How to measure fission-track ages without the use of reactor neutron irradiation. → combination with α track measurements • How to obtain them conveniently with common laboratory equipments. → Is it possible to calculate FT age from U content, etched track length?
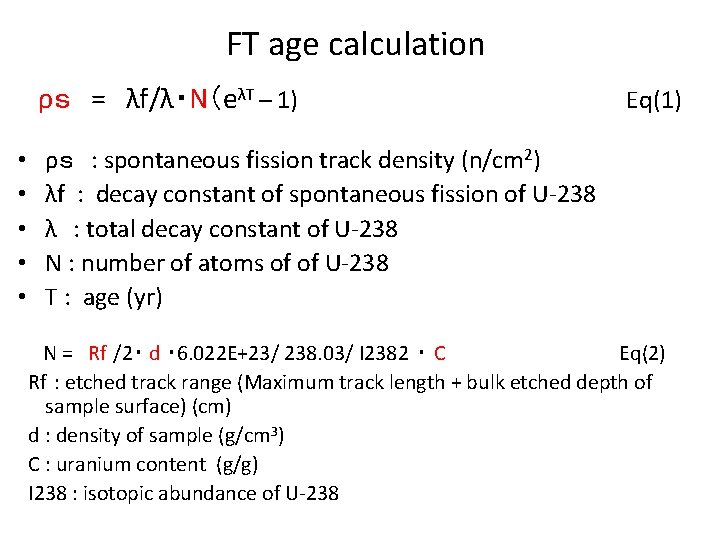
FT age calculation ρs = λf/λ・N(eλT – 1) • • • Eq(1) ρs : spontaneous fission track density (n/cm 2) λf : decay constant of spontaneous fission of U-238 λ : total decay constant of U-238 N : number of atoms of of U-238 T : age (yr) N = Rf /2・ d ・ 6. 022 E+23/ 238. 03/ I 2382 ・ C Eq(2) Rf : etched track range (Maximum track length + bulk etched depth of sample surface) (cm) d : density of sample (g/cm 3) C : uranium content (g/g) I 238 : isotopic abundance of U-238
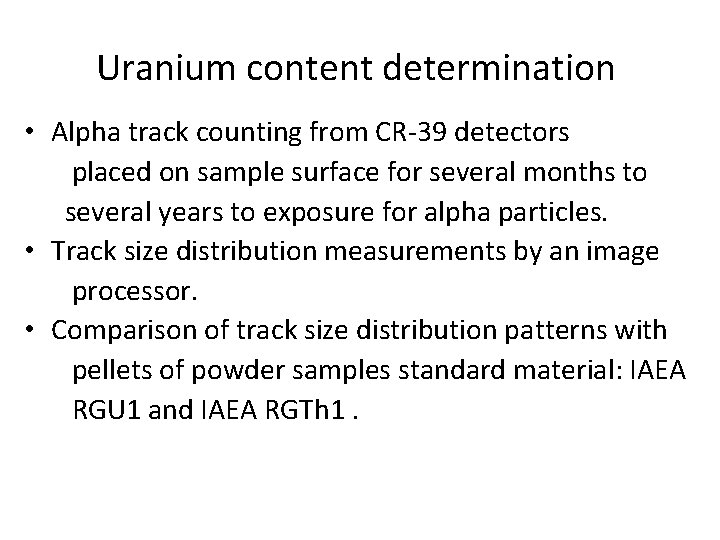
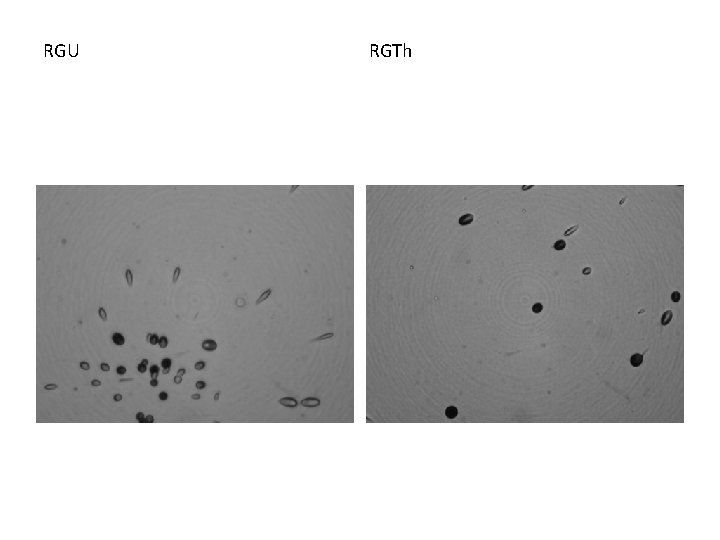
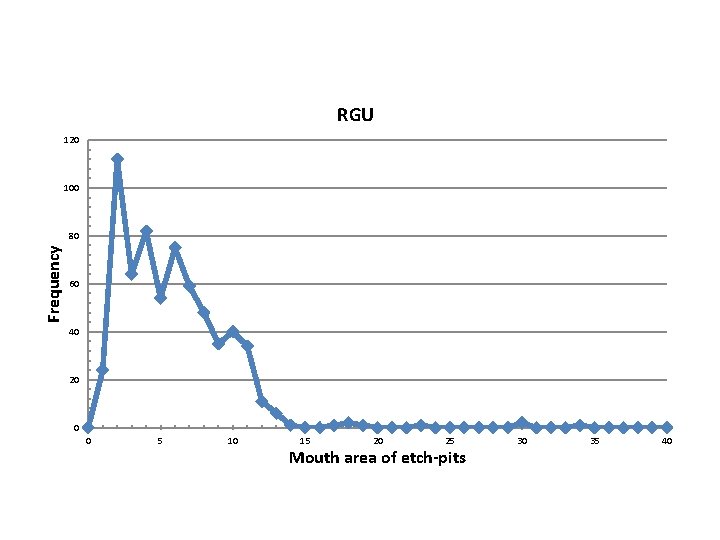
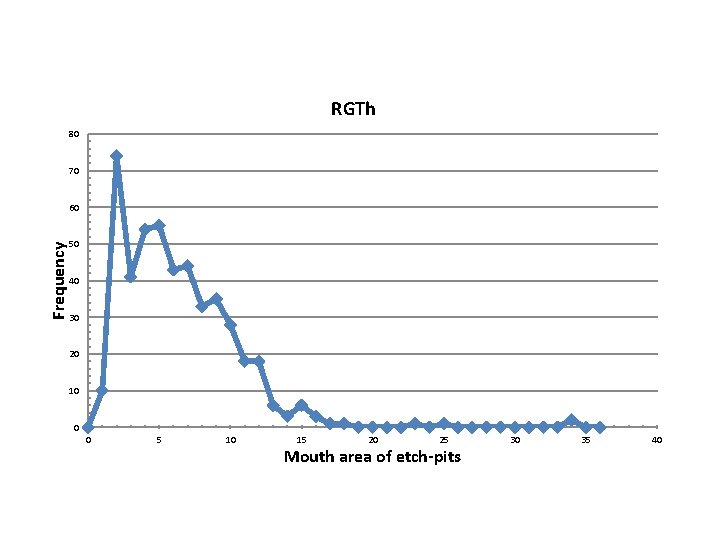
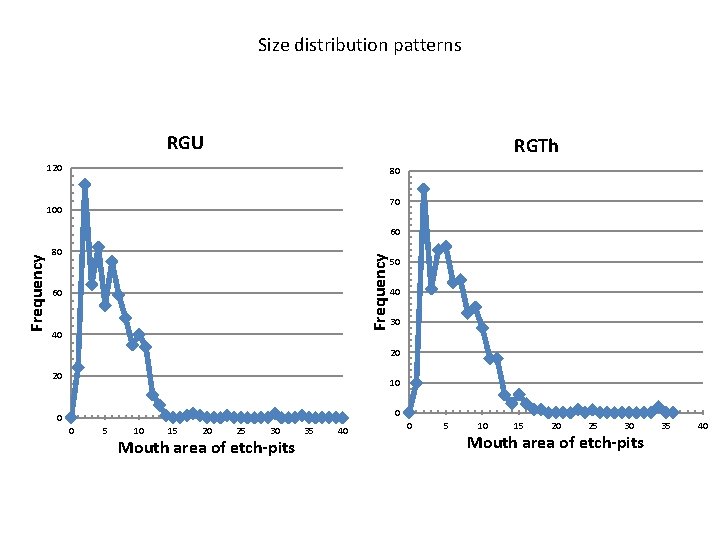
Uranium content determination • Alpha track counting from CR-39 detectors placed on sample surface for several months to several years to exposure for alpha particles. • Track size distribution measurements by an image processor. • Comparison of track size distribution patterns with pellets of powder samples standard material: IAEA RGU 1 and IAEA RGTh 1.
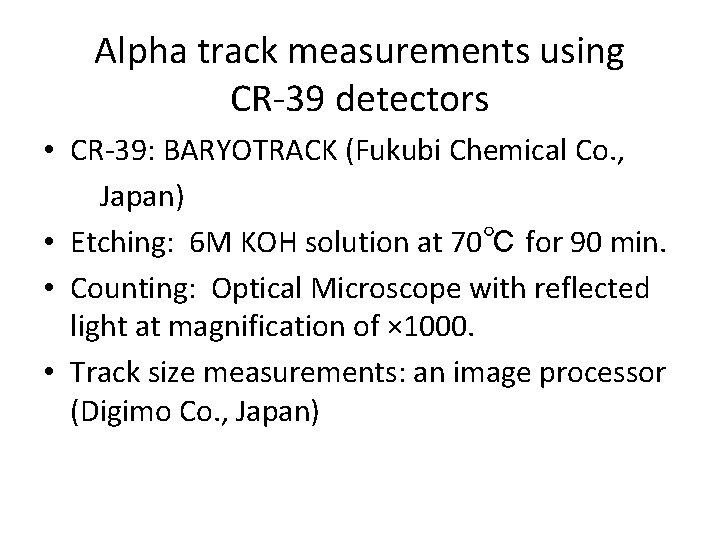
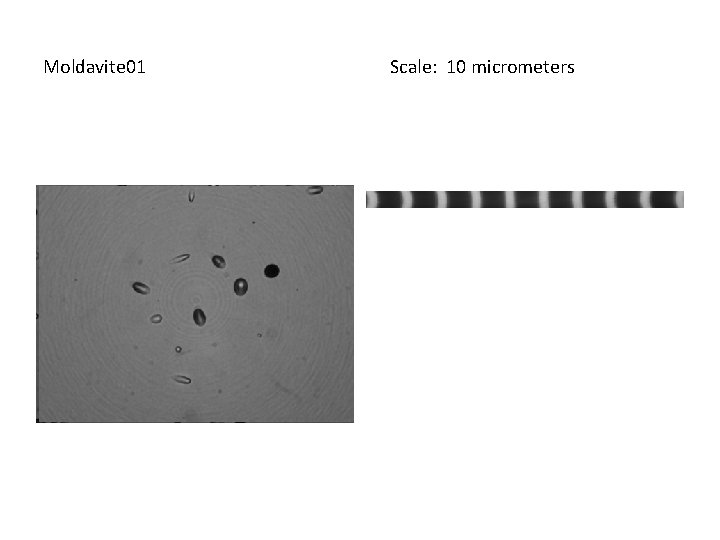
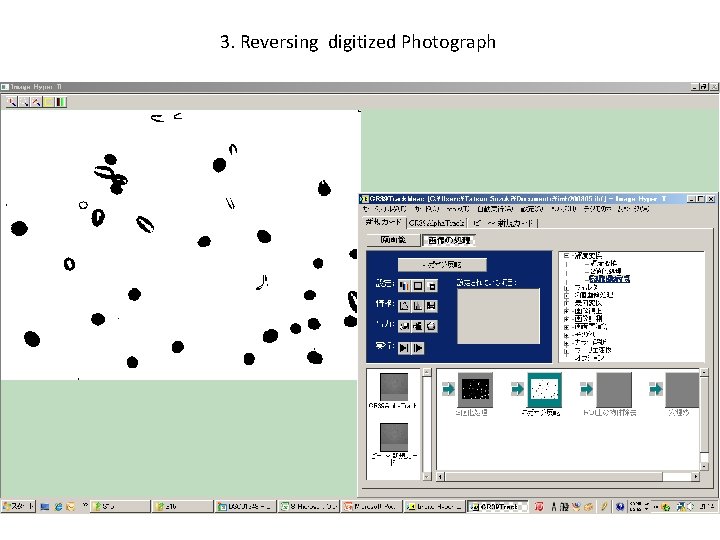
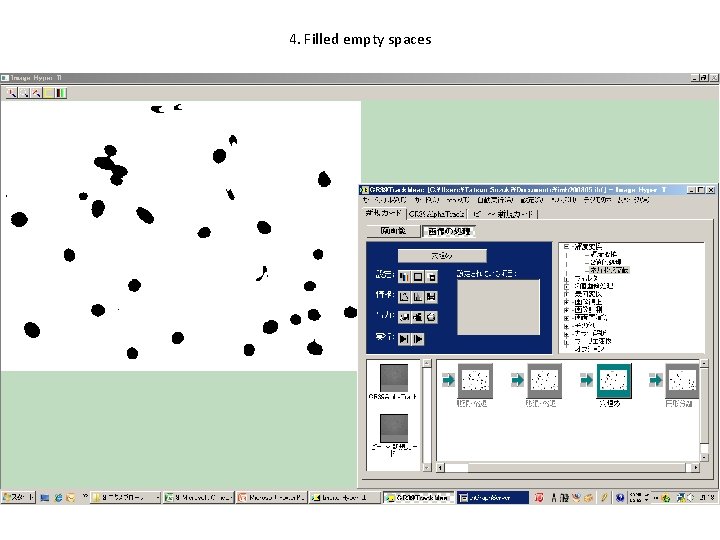
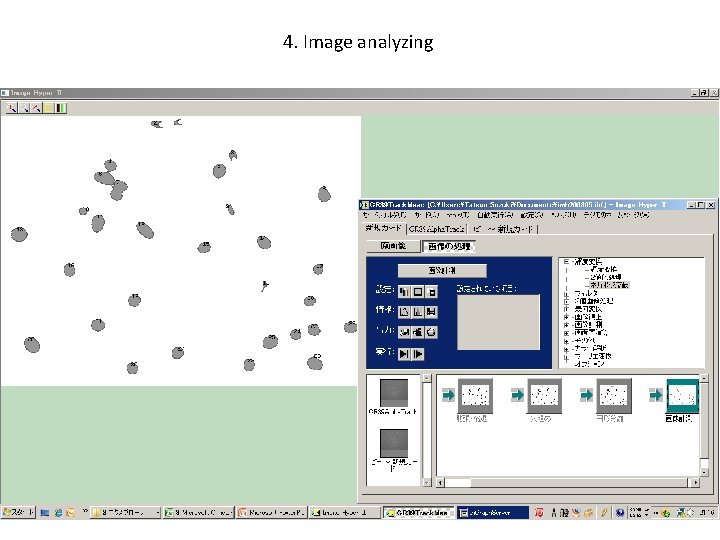
Alpha track measurements using CR-39 detectors • CR-39: BARYOTRACK (Fukubi Chemical Co. , Japan) • Etching: 6 M KOH solution at 70℃ for 90 min. • Counting: Optical Microscope with reflected light at magnification of × 1000. • Track size measurements: an image processor (Digimo Co. , Japan)
Moldavite 01 Scale: 10 micrometers
RGU RGTh
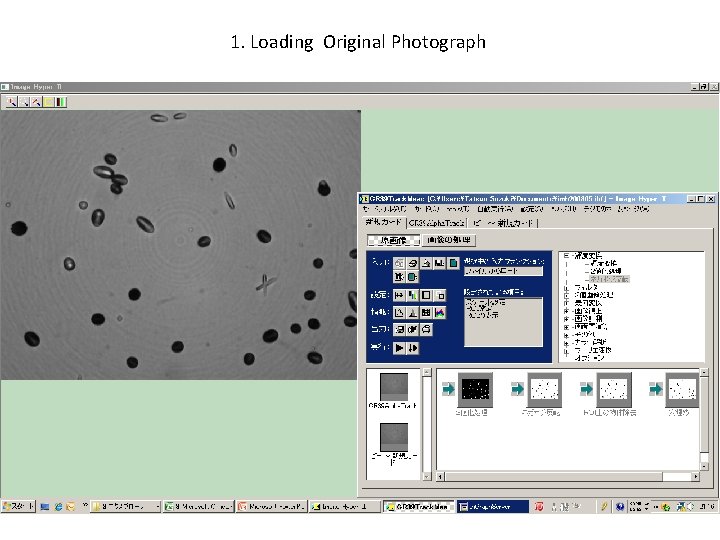
1. Loading Original Photograph
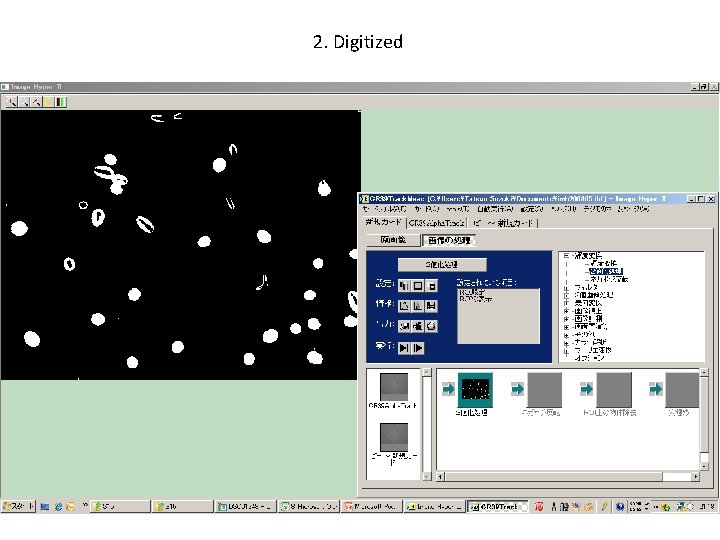
2. Digitized
3. Reversing digitized Photograph
4. Filled empty spaces
4. Image analyzing
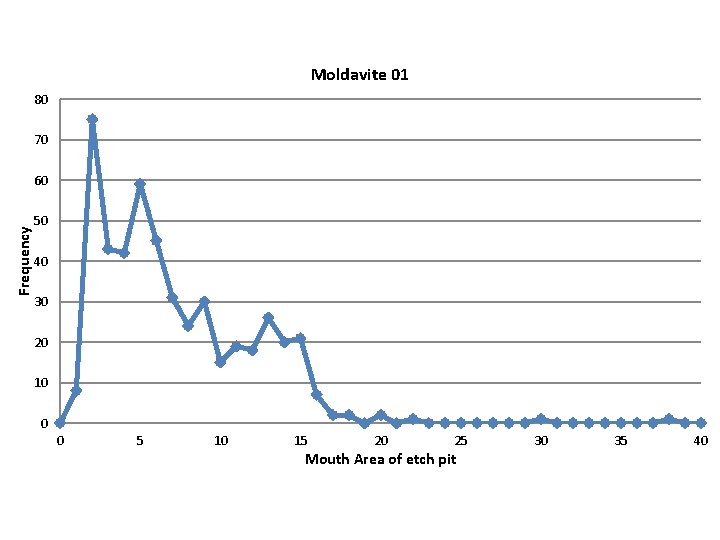
Moldavite 01 80 70 Frequency 60 50 40 30 20 10 0 0 5 10 15 20 25 Mouth Area of etch pit 30 35 40
RGU 120 100 Frequency 80 60 40 20 0 0 5 10 15 20 25 Mouth area of etch-pits 30 35 40
RGTh 80 70 Frequency 60 50 40 30 20 10 0 0 5 10 15 20 25 Mouth area of etch-pits 30 35 40
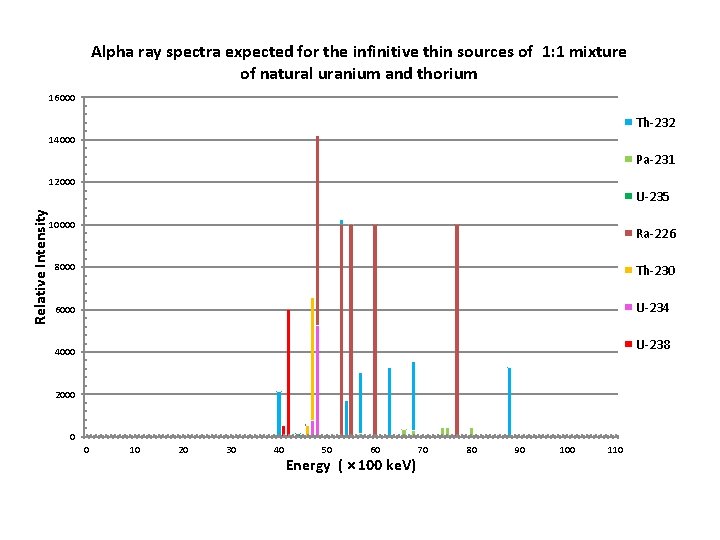
Alpha ray spectra expected for the infinitive thin sources of 1: 1 mixture of natural uranium and thorium 16000 Th-232 14000 Pa-231 Relative Intensity 12000 U-235 10000 Ra-226 8000 Th-230 6000 U-234 U-238 4000 2000 0 0 10 20 30 40 50 60 Energy ( × 100 ke. V) 70 80 90 100 110
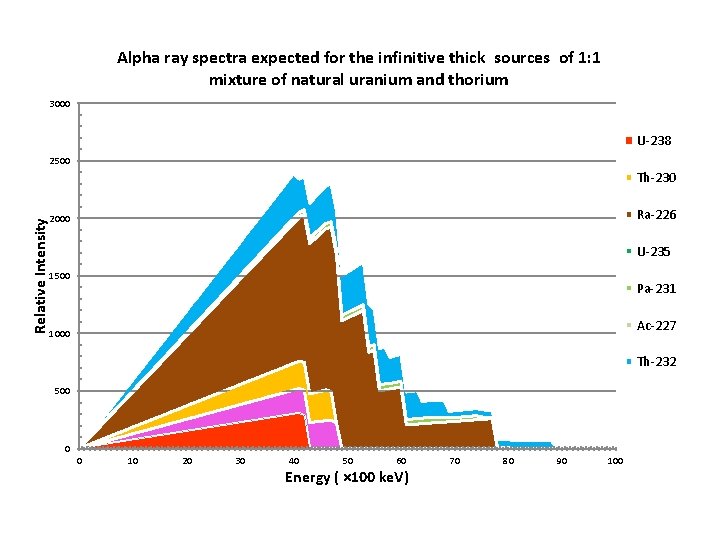
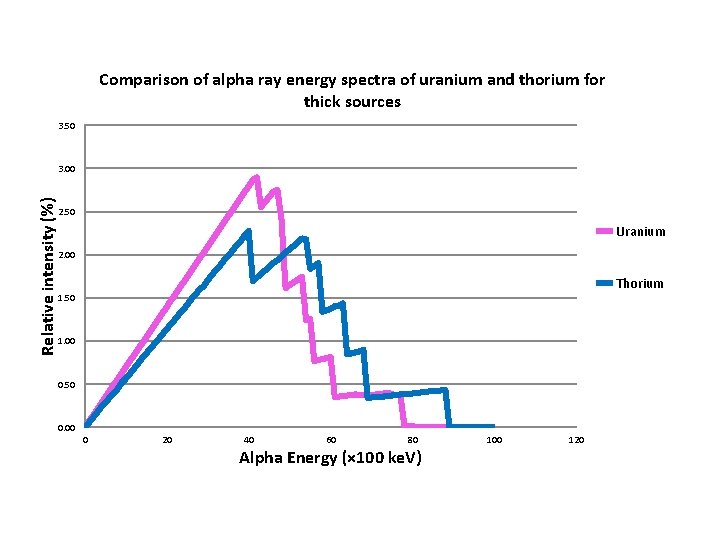
Alpha ray spectra expected for the infinitive thick sources of 1: 1 mixture of natural uranium and thorium 3000 U-238 2500 Relative Intensity Th-230 Ra-226 2000 U-235 1500 Pa-231 Ac-227 1000 Th-232 500 0 0 10 20 30 40 50 60 Energy ( × 100 ke. V) 70 80 90 100
Size distribution patterns RGU RGTh 120 80 70 100 80 Frequency 60 60 40 50 40 30 20 20 10 0 5 10 15 20 25 30 Mouth area of etch-pits 35 40
Comparison of alpha ray energy spectra of uranium and thorium for thick sources 3. 50 Relative intensity (%) 3. 00 2. 50 Uranium 2. 00 Thorium 1. 50 1. 00 0. 50 0. 00 0 20 40 60 80 Alpha Energy (× 100 ke. V) 100 120
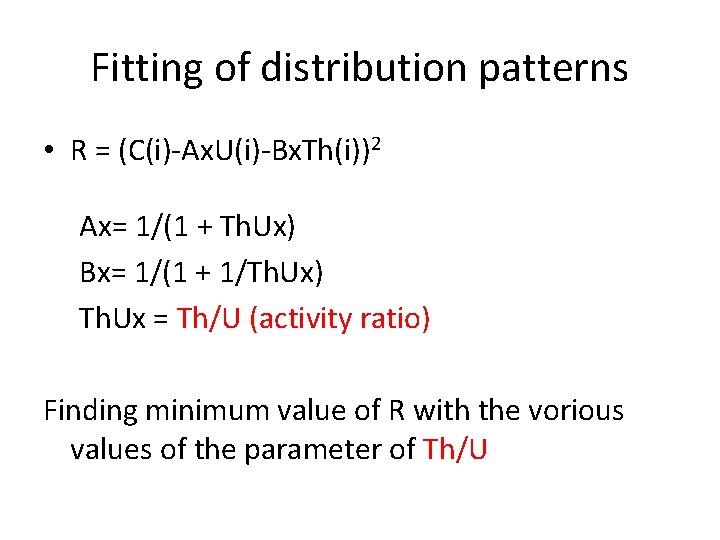
Fitting of distribution patterns • R = (C(i)-Ax. U(i)-Bx. Th(i))2 Ax= 1/(1 + Th. Ux) Bx= 1/(1 + 1/Th. Ux) Th. Ux = Th/U (activity ratio) Finding minimum value of R with the vorious values of the parameter of Th/U
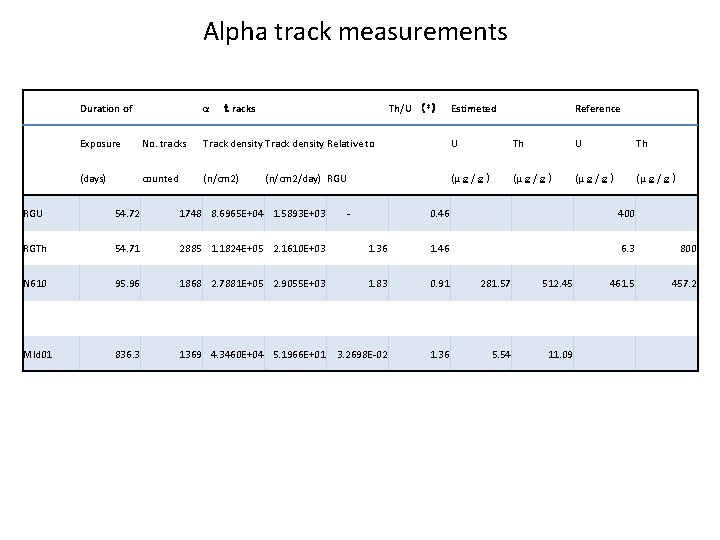
Alpha track measurements Duration of α Th/U (*) Estimeted tracks Reference Exposure No. tracks Track density Relative to U Th (days) counted (n/cm 2) (μg/g) (n/cm 2/day) RGU 54. 72 1748 8. 6965 E+04 1. 5893 E+03 RGTh 54. 71 2885 1. 1824 E+05 2. 1610 E+03 N 610 95. 96 Mld 01 836. 3 - 0. 46 400 1. 36 1. 46 6. 3 800 1868 2. 7881 E+05 2. 9055 E+03 1. 83 0. 91 281. 57 512. 45 461. 5 457. 2 1369 4. 3460 E+04 5. 1966 E+01 3. 2698 E-02 1. 36 5. 54 11. 09
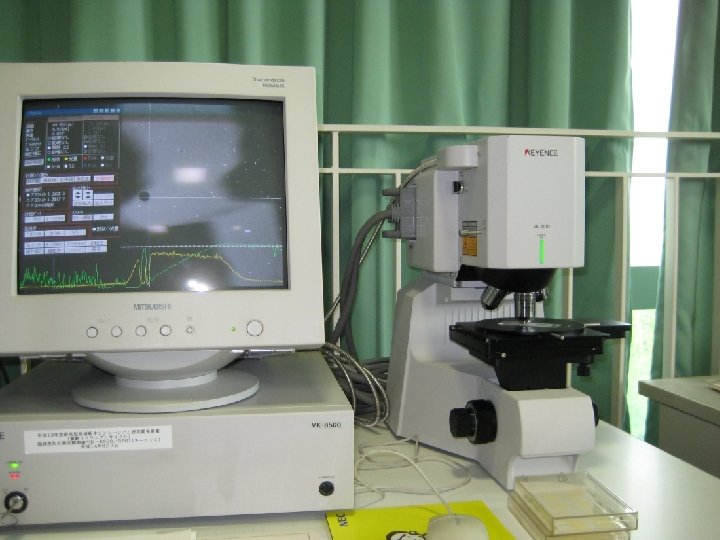
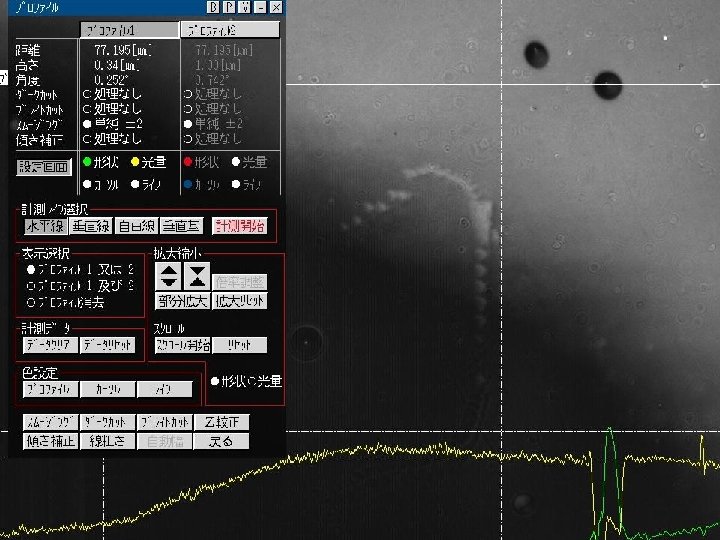
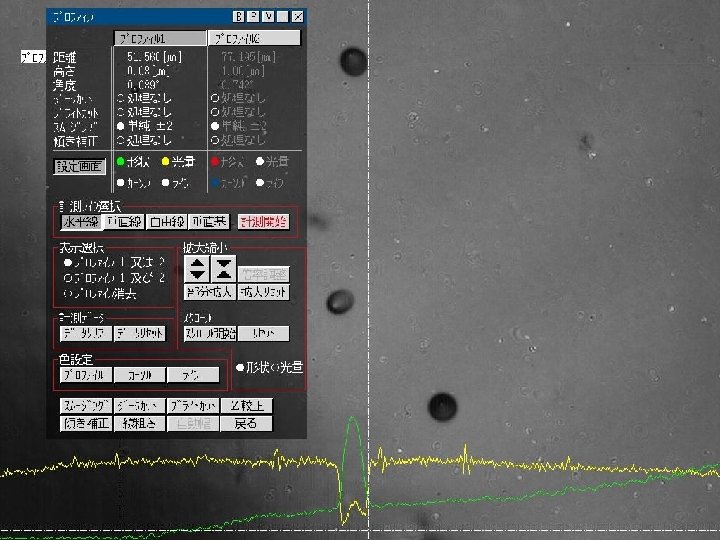
Etched track length measurements • Making replicas of etched surface using silicon resin. • Measurements of etch pit heights of vertical tracks (Vt) to the surface by Laser Scanning Microscope. • Measurements of etched depth (Vb) of the surface by comparison with the area covered by wax during the etching with 48% HF for glasses also by Laser Scanning Microscope (VK 8500, Keyence Co. , Japan) • Rf = Vt + Vb
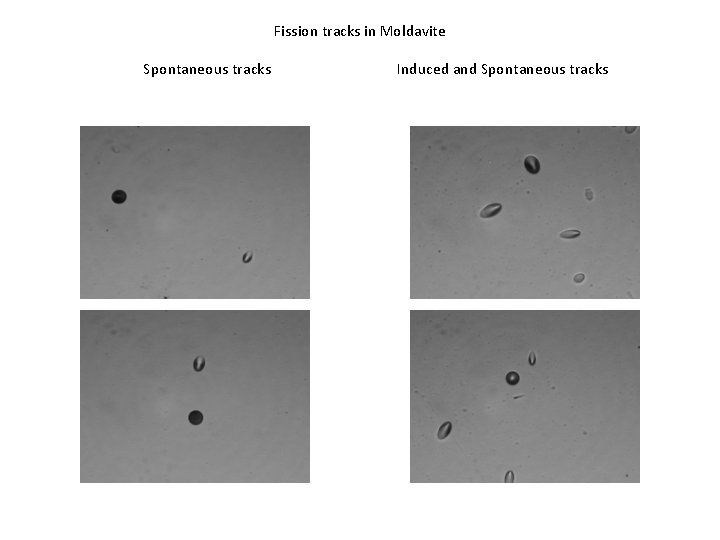
Fission tracks in Moldavite Spontaneous tracks Induced and Spontaneous tracks
Calculation of FT-α age for Moldavite • • • U: 5. 54 μg/g Th: 11. 1 μg/g Rf = 2. 61 μm d ≈ 2 g/cm 3 λf = 8. 45 × 10 -17/yr • T = 13. 6 Ma
Conclusions • Conventional age determination using spontaneous fission track counting and uranium content estimation from alpha spectrometry based on track size measurements with an image processer and CR-39 nuclear track detectors was tentatively applied to determine the age of Moldavite. • Uranium and thorium content of IAEA reference samples usually used for gamma radiation measurements are also useful for alpha track measurements but it would be much better to pulverize them as much more fine state. • These experiments can be applied also to other geological glasses although it needs long exposure duration as several years for alpha particles.
References • • • Browne, E. , Firestone, R. B. and Shirley, V. S (1986) Table of Radioactive Isotopes. Wiley-Interscience Hadler N. , J. C. , Iunes, P. J. , Osorio A, A. M. and Paulo, S. R. (1991) Relationship between track size and energy for alpha particles in CR-39. Nucl. Tracks Radiat. Meas. , 19, 1 -4, 313 -317. Hadler N. , J. C. , Iunes, P. J. , Paulo, S. R. , Policatro, A. P. and Tello S. , C. A. (1995) A discussion on the reliability of alpha-spectroscopy using CR-39 and an image processor. Radiat. Meas. , 25, 1 -4, 749 -752. Hosoe, M. , Takami, Y. , Shiraishi, F. and Tomura, T. (1984) Stopping power measurement using thick alpha sources. Nucl. Instr. Methods Phys. Res. , 223, 377 -381. Takami, Y. , Hashimoto, T. , Shiraishi, F. and Voss, K. (1986) Quantitative analysis of alpha activities in thick sources using Si detectors. IEEE Tracsact. Nucl. Sci. , 33, 1, 639 -642.
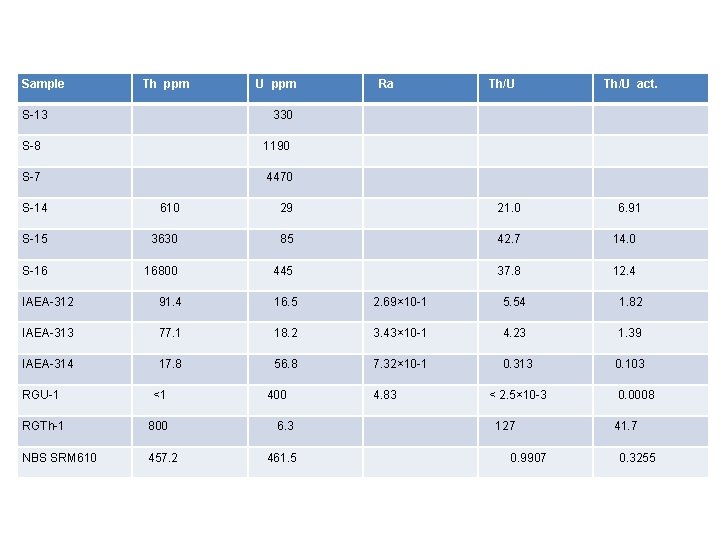
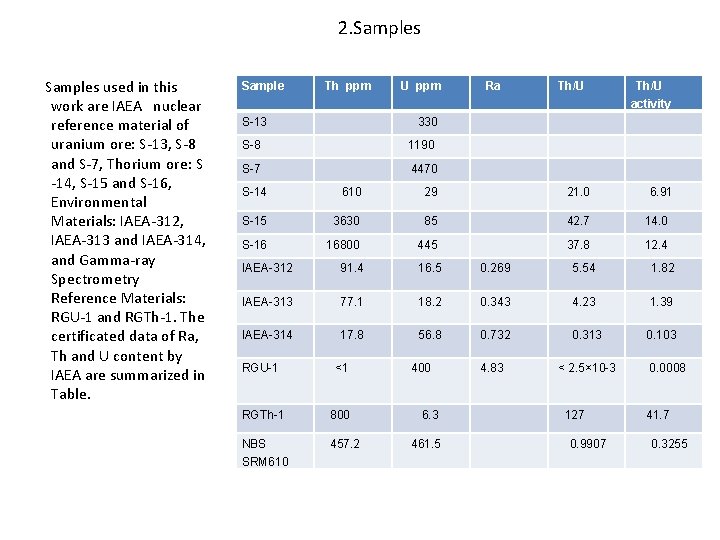
Sample Th ppm S-13 U ppm Ra Th/U act. 330 S-8 1190 S-7 4470 S-14 610 29 21. 0 6. 91 S-15 3630 85 42. 7 14. 0 S-16 16800 445 37. 8 12. 4 IAEA-312 91. 4 16. 5 2. 69× 10 -1 5. 54 1. 82 IAEA-313 77. 1 18. 2 3. 43× 10 -1 4. 23 1. 39 IAEA-314 17. 8 56. 8 7. 32× 10 -1 0. 313 0. 103 RGU-1 <1 RGTh-1 800 NBS SRM 610 457. 2 400 6. 3 461. 5 4. 83 < 2. 5× 10 -3 127 0. 9907 0. 0008 41. 7 0. 3255
2. Samples used in this work are IAEA nuclear reference material of uranium ore: S-13, S-8 and S-7, Thorium ore: S -14, S-15 and S-16, Environmental Materials: IAEA-312, IAEA-313 and IAEA-314, and Gamma-ray Spectrometry Reference Materials: RGU-1 and RGTh-1. The certificated data of Ra, Th and U content by IAEA are summarized in Table. Sample Th ppm S-13 U ppm Ra Th/U activity 330 S-8 1190 S-7 4470 S-14 610 29 21. 0 6. 91 S-15 3630 85 42. 7 14. 0 S-16 16800 445 37. 8 12. 4 IAEA-312 91. 4 16. 5 0. 269 5. 54 1. 82 IAEA-313 77. 1 18. 2 0. 343 4. 23 1. 39 IAEA-314 17. 8 56. 8 0. 732 0. 313 0. 103 4. 83 < 2. 5× 10 -3 RGU-1 <1 RGTh-1 800 NBS SRM 610 457. 2 400 6. 3 461. 5 127 0. 9907 0. 0008 41. 7 0. 3255
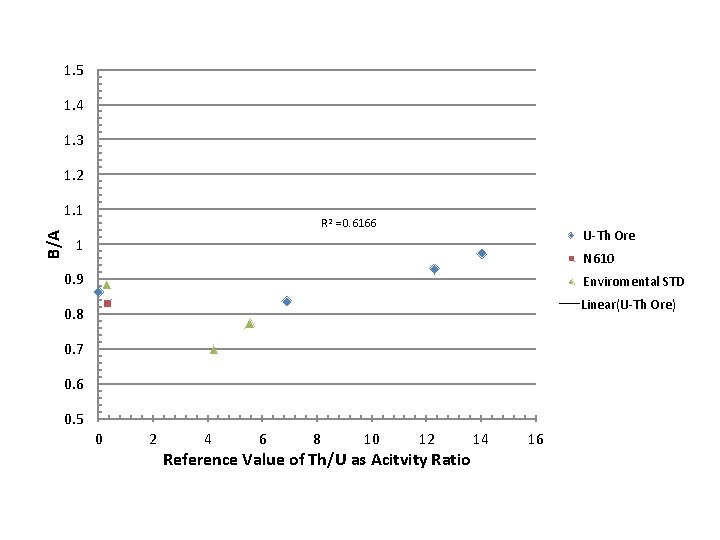
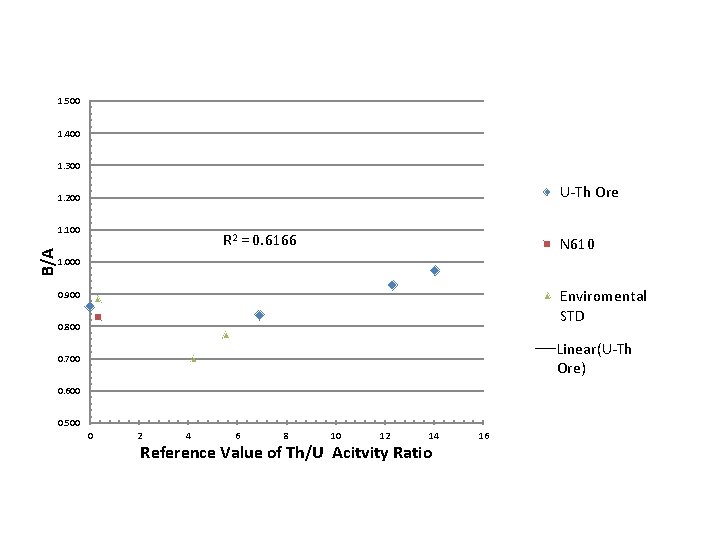
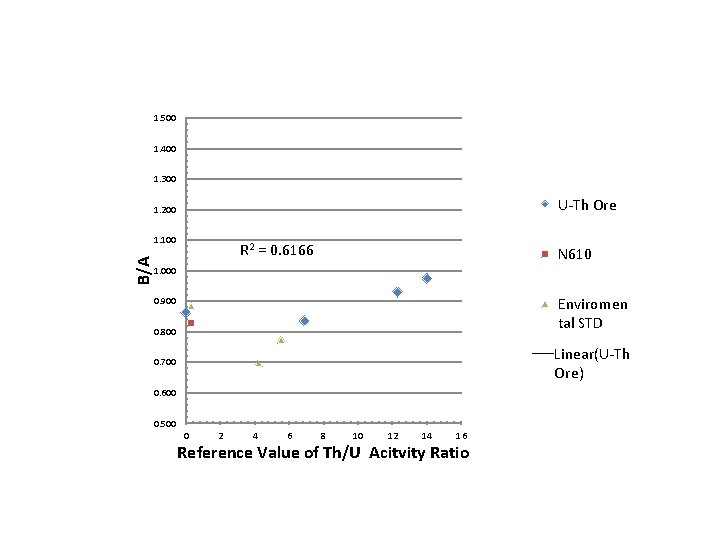
1. 5 1. 4 1. 3 1. 2 B/A 1. 1 R 2 = 0. 6166 U-Th Ore 1 N 610 0. 9 Enviromental STD Linear(U-Th Ore) 0. 8 0. 7 0. 6 0. 5 0 2 4 6 8 10 12 Reference Value of Th/U as Acitvity Ratio 14 16
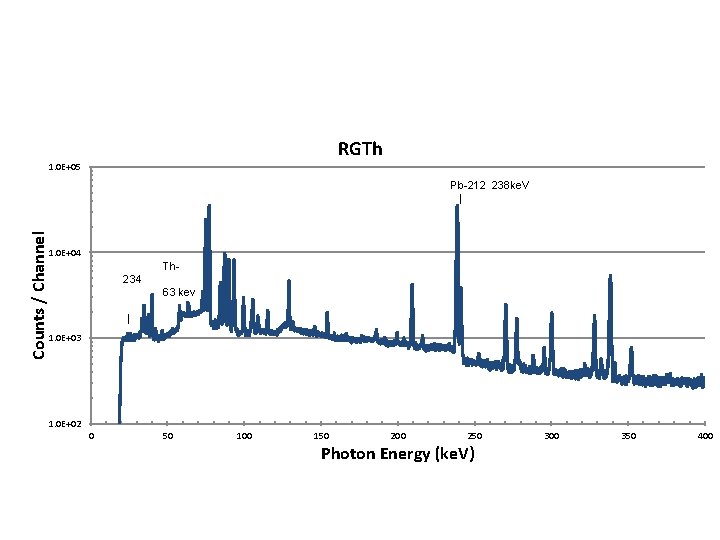
RGTh 1. 0 E+05 Counts / Channel Pb-212 238 ke. V | 1. 0 E+04 Th 234 63 kev | 1. 0 E+03 1. 0 E+02 0 50 100 150 200 250 Photon Energy (ke. V) 300 350 400
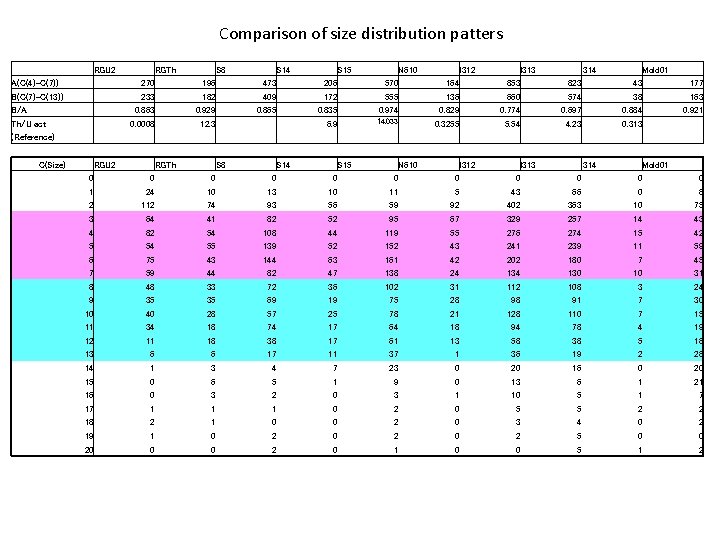
Comparison of size distribution patters RGU 2 RGTh S 8 S 14 S 15 N 610 I 312 I 313 i 314 Mold 01 A(C(4)-C(7)) 270 196 473 206 570 164 853 823 43 177 B(C(7)-C(13)) 233 182 409 172 555 136 660 574 38 163 0. 863 0. 929 0. 865 0. 835 0. 974 0. 829 0. 774 0. 697 0. 884 0. 921 0. 0008 12. 3 6. 9 14. 033 0. 3255 5. 54 4. 23 0. 313 B/A Th/U act (Reference) C(Size) RGU 2 RGTh S 8 S 14 S 15 N 610 I 312 I 313 i 314 Mold 01 0 0 0 1 24 10 13 10 11 5 43 66 0 8 2 112 74 93 56 59 92 402 363 10 75 3 64 41 82 52 95 67 329 257 14 43 4 82 54 108 44 119 55 276 274 15 42 5 54 55 139 52 152 43 241 239 11 59 6 75 43 144 63 161 42 202 180 7 45 7 59 44 82 47 138 24 130 10 31 8 48 33 72 36 102 31 112 108 3 24 9 35 35 69 19 75 28 98 91 7 30 10 40 28 57 25 78 21 128 110 7 15 11 34 18 74 17 64 18 94 78 4 19 12 11 18 38 17 61 13 58 38 5 18 13 6 6 17 11 37 1 36 19 2 26 14 1 3 4 7 23 0 20 16 0 20 15 0 6 5 1 9 0 13 6 1 21 16 0 3 2 0 3 1 10 5 1 7 17 1 1 1 0 2 0 5 5 2 2 18 2 1 0 0 2 0 3 4 0 2 19 1 0 2 0 2 5 0 0 20 0 0 2 0 1 0 0 5 1 2
1. 500 1. 400 1. 300 U-Th Ore 1. 200 B/A 1. 100 R 2 = 0. 6166 N 610 1. 000 Enviromental STD 0. 900 0. 800 Linear(U-Th Ore) 0. 700 0. 600 0. 500 0 2 4 6 8 10 12 14 Reference Value of Th/U Acitvity Ratio 16
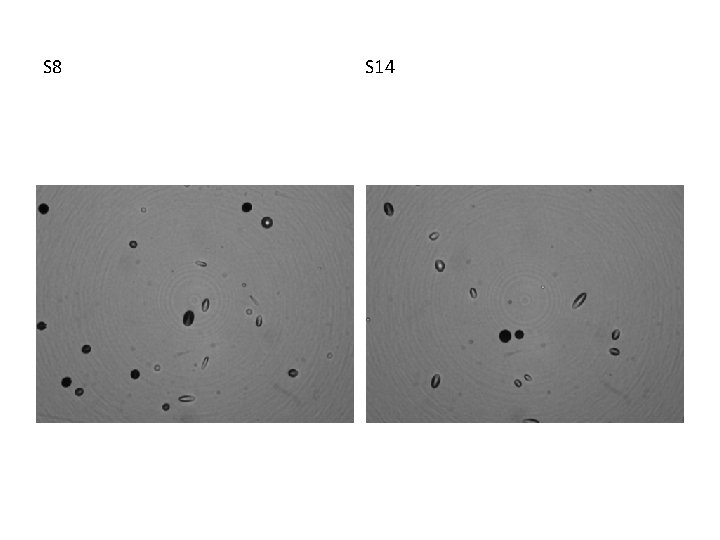
S 8 S 14
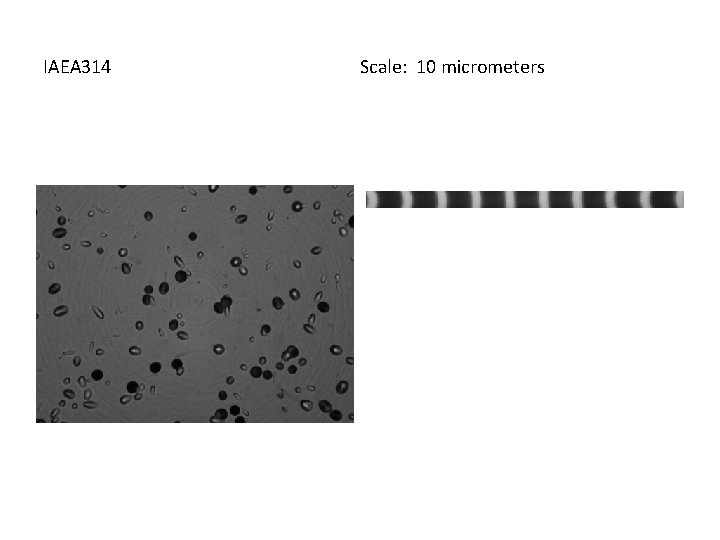
IAEA 314 Scale: 10 micrometers
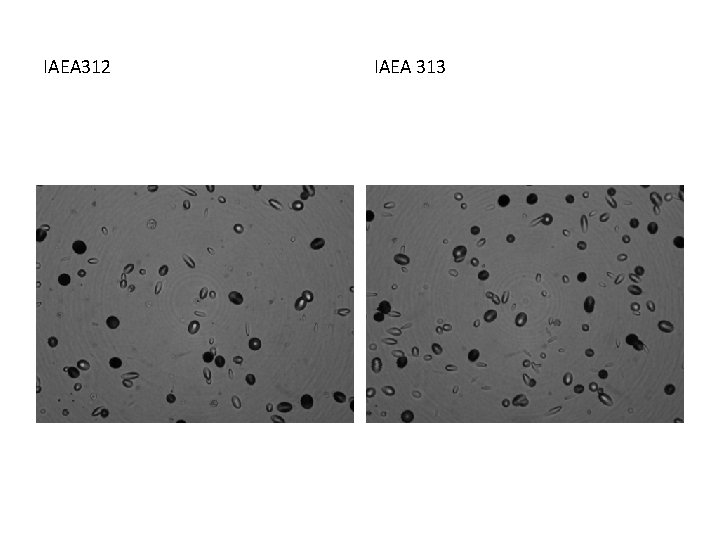
IAEA 312 IAEA 313
1. 500 1. 400 1. 300 U-Th Ore 1. 200 B/A 1. 100 R 2 = 0. 6166 N 610 1. 000 Enviromen tal STD 0. 900 0. 800 Linear(U-Th Ore) 0. 700 0. 600 0. 500 0 2 4 6 8 10 12 14 16 Reference Value of Th/U Acitvity Ratio