
FRS 123 Technology in Art and Cultural Heritage
- Slides: 21
FRS 123: Technology in Art and Cultural Heritage Color
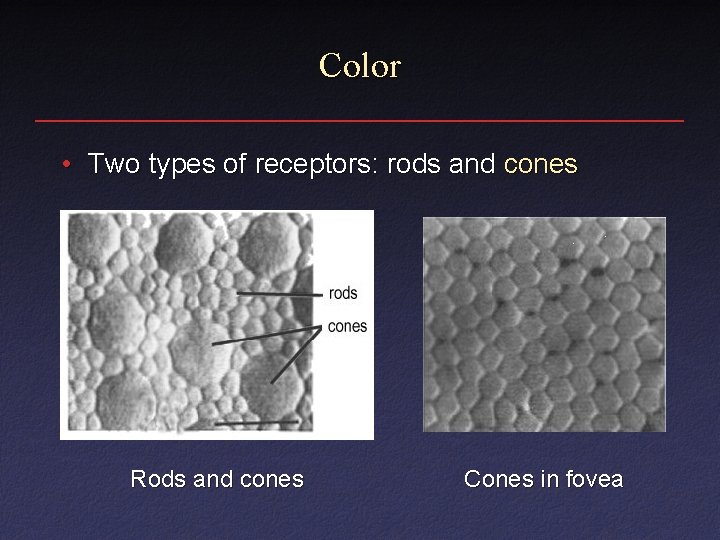
Color • Two types of receptors: rods and cones Rods and cones Cones in fovea
Rods and Cones • Rods – More sensitive in low light: “scotopic” vision – More dense near periphery • Cones – Only function with higher light levels: “photopic” vision – Densely packed at center of eye: fovea – Different types of cones color vision
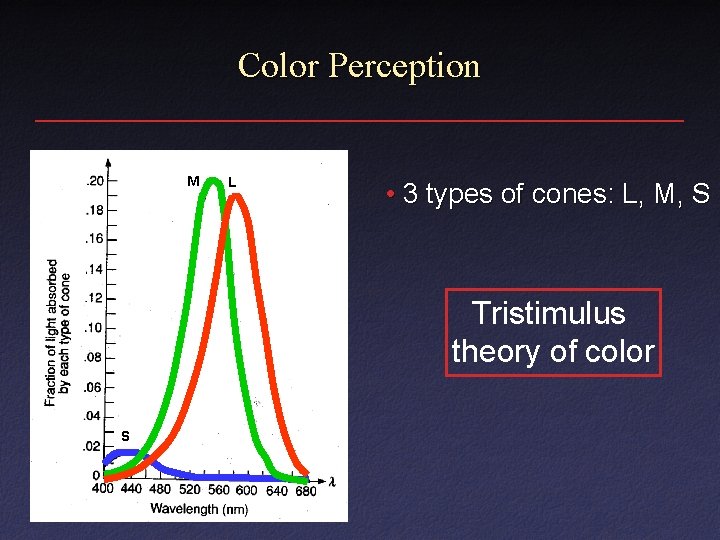
Color Perception M L • 3 types of cones: L, M, S Tristimulus theory of color S
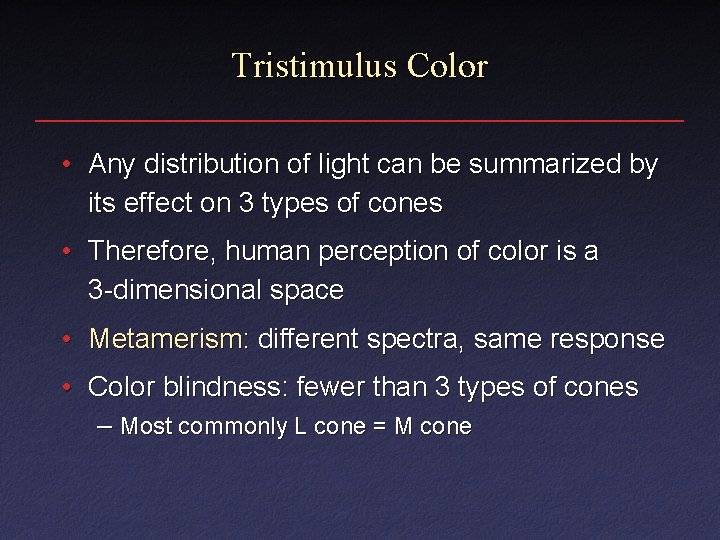
Tristimulus Color • Any distribution of light can be summarized by its effect on 3 types of cones • Therefore, human perception of color is a 3 -dimensional space • Metamerism: different spectra, same response • Color blindness: fewer than 3 types of cones – Most commonly L cone = M cone
Color Models • RGB • CMY • HSV • XYZ • …etc
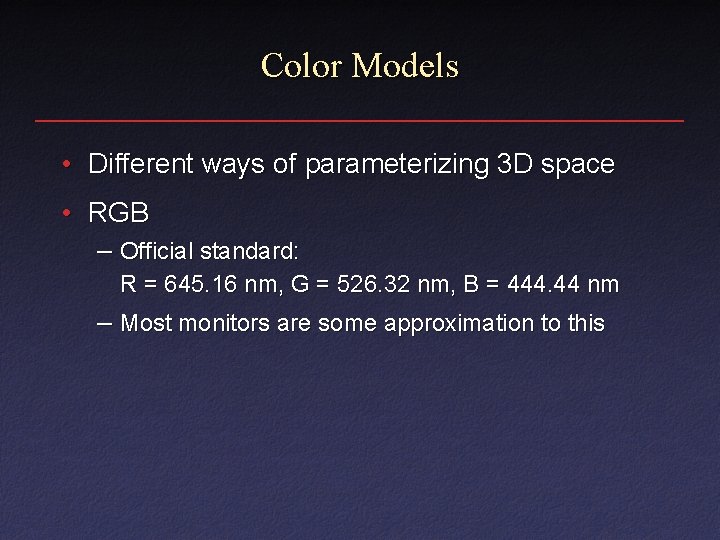
Color Models • Different ways of parameterizing 3 D space • RGB – Official standard: R = 645. 16 nm, G = 526. 32 nm, B = 444. 44 nm – Most monitors are some approximation to this
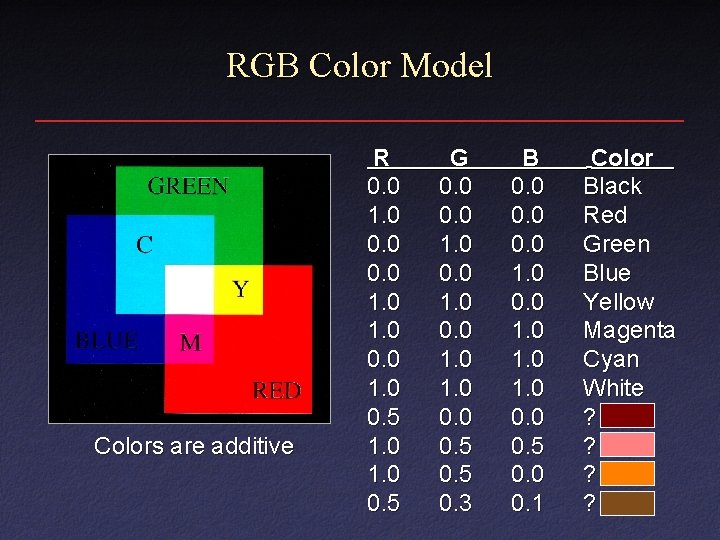
RGB Color Model Colors are additive R 0. 0 1. 0 0. 5 1. 0 0. 5 G 0. 0 1. 0 0. 5 0. 3 B 0. 0 1. 0 0. 5 0. 0 0. 1 Color Black Red Green Blue Yellow Magenta Cyan White ? ?
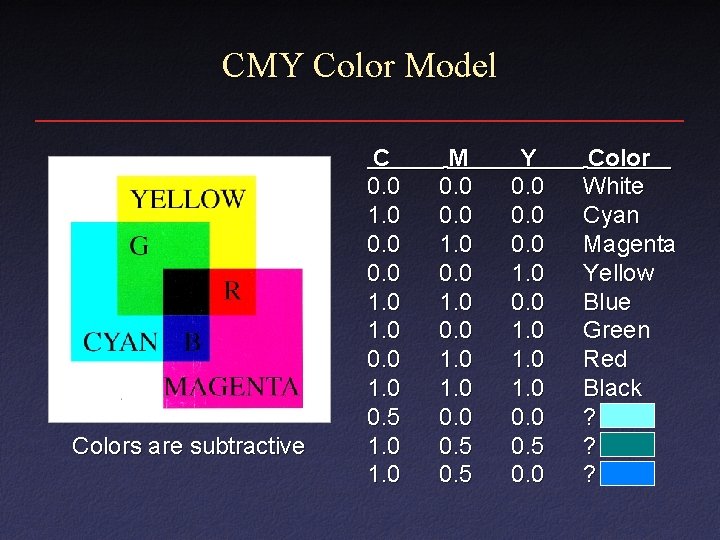
CMY Color Model Colors are subtractive C 0. 0 1. 0 0. 5 1. 0 M 0. 0 1. 0 0. 5 Y 0. 0 1. 0 0. 5 0. 0 Color White Cyan Magenta Yellow Blue Green Red Black ? ? ?
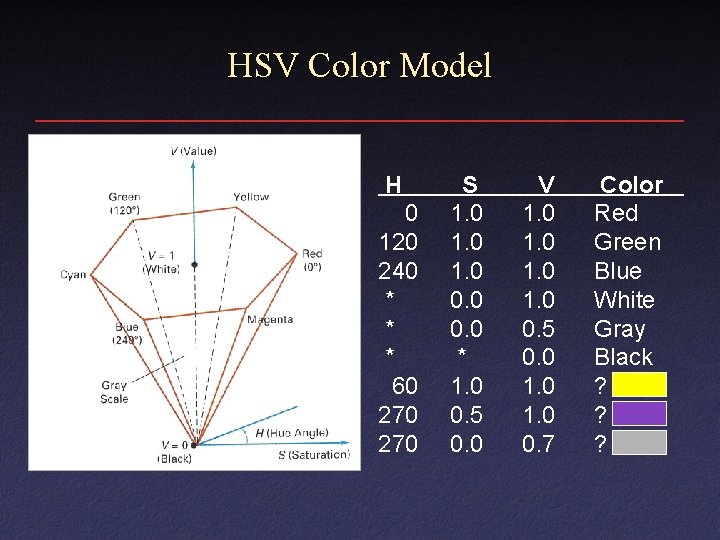
HSV Color Model H 0 120 240 * * * 60 270 S 1. 0 0. 0 * 1. 0 0. 5 0. 0 V 1. 0 0. 5 0. 0 1. 0 0. 7 Color Red Green Blue White Gray Black ? ? ?
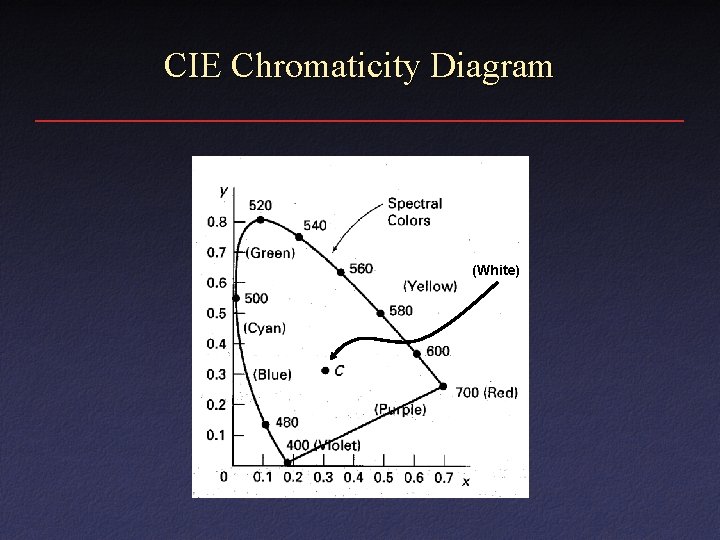
XYZ Colorspace • RGB can’t represent all pure wavelengths with positive values – Saturated greens would require negative red • XYZ colorspace is a linear transform of RGB so that all pure wavelengths have positive values
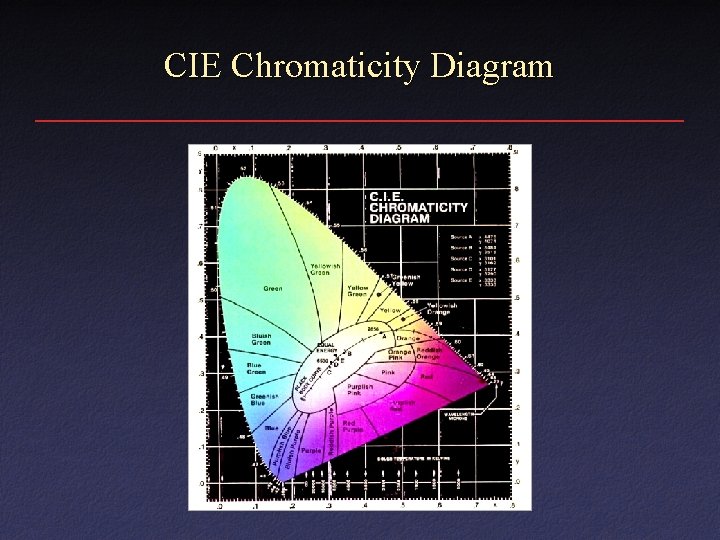
CIE Chromaticity Diagram
CIE Chromaticity Diagram (White)
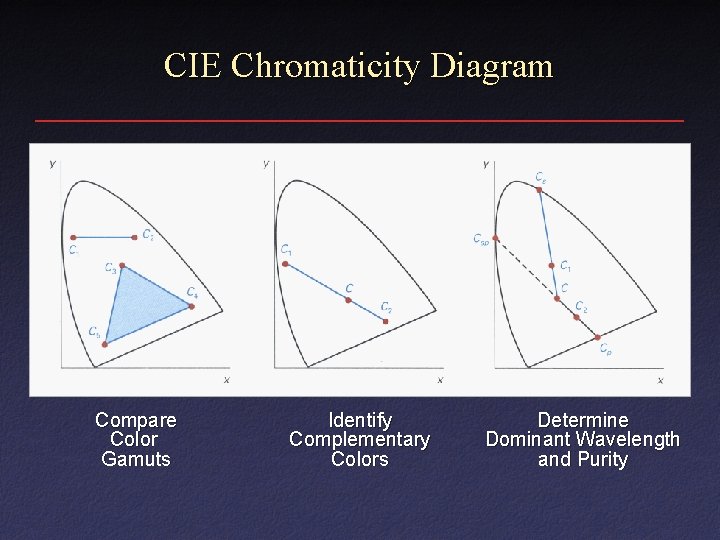
CIE Chromaticity Diagram Compare Color Gamuts Identify Complementary Colors Determine Dominant Wavelength and Purity
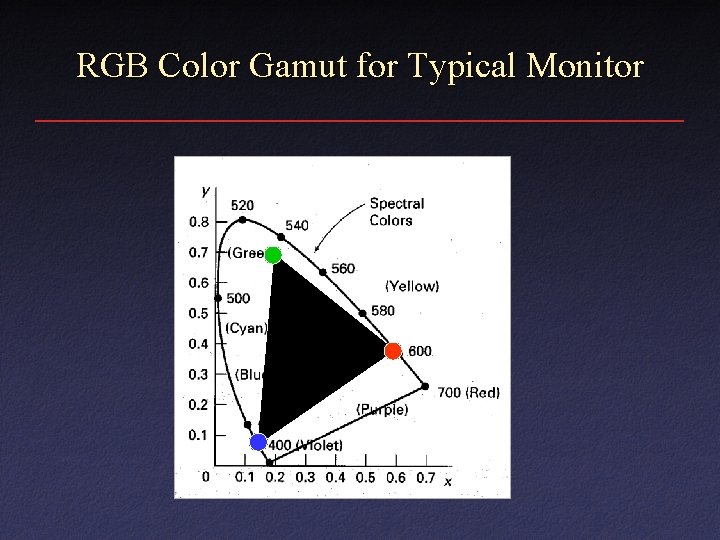
RGB Color Gamut for Typical Monitor
Colorspaces for Television • Differences in brightness more important than differences in color • YCr. Cb, YUV, YIQ colorspaces = linear transforms of RGB – Lightness: Y=0. 299 R+0. 587 G+0. 114 B – Other color components typically allocated less bandwidth than Y
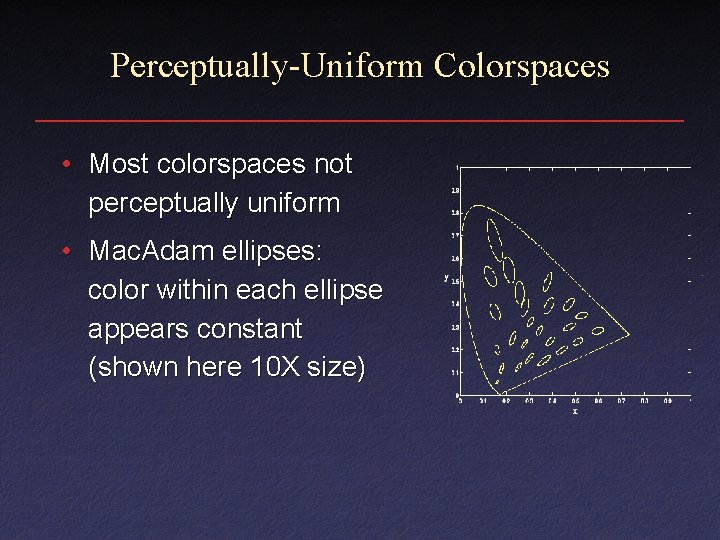
Perceptually-Uniform Colorspaces • Most colorspaces not perceptually uniform • Mac. Adam ellipses: color within each ellipse appears constant (shown here 10 X size)
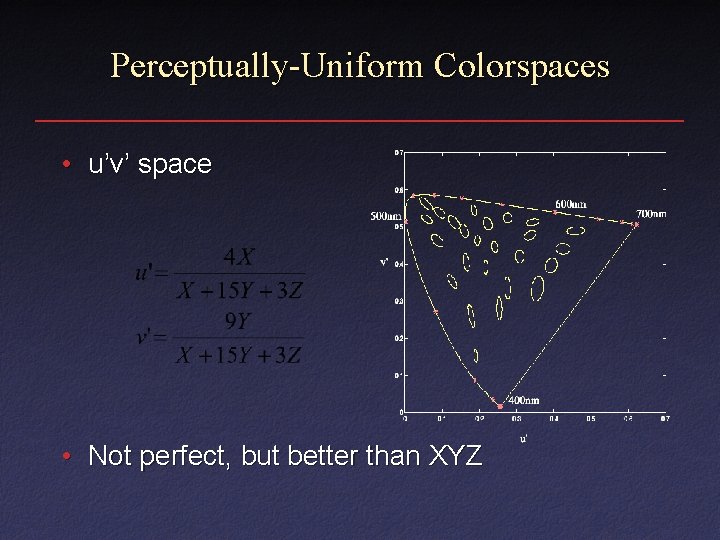
Perceptually-Uniform Colorspaces • u’v’ space • Not perfect, but better than XYZ
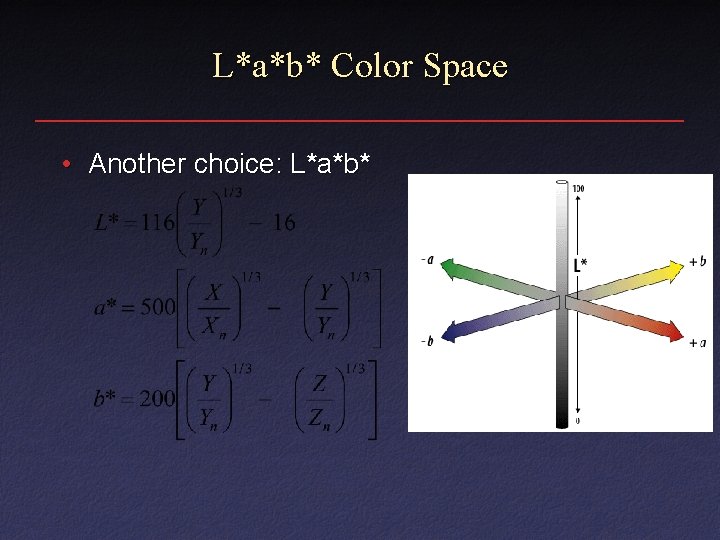
L*a*b* Color Space • Another choice: L*a*b*
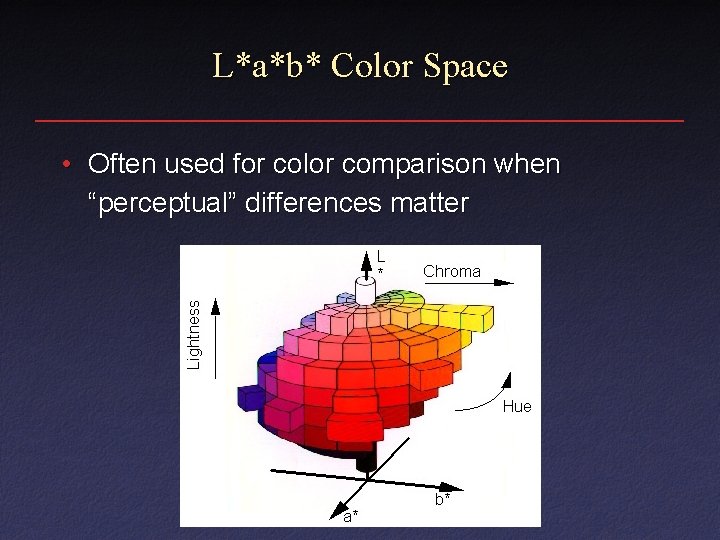
L*a*b* Color Space • Often used for color comparison when “perceptual” differences matter
Summary • Perception and representation of – Intensity, frequency, color • Color – Tristimulus theory of color – CIE Chromaticity Diagram – Different color models