From Sample to Population Inferential Statistics Understanding Inferential


")


 l One sample Z score l l T-distribution")


 Tests differences between 2 group means l")


- Slides: 36
From Sample to Population: Inferential Statistics Understanding Inferential Statistics
Review l What scale of measurement is used for each of the variables? l Type of M&M you were given l “Yummy scale” Scores l Number of green M&Ms
Create a bar graph showing the color frequencies for all “whole” M&Ms.
Research Questions: l How closely does the contents of your bag match the typical fun size pack? l Do you have a typical number of green M&Ms? l l To Is your bag really unusual or pretty common? know the answer we have to know the distribution of green M&Ms for many samples.
Sampling Distribution of the Mean A theoretical value generated by taking samples over and over again from the same population.
How it works? 1. Choose a sample size (e. g. , n = 20) (1 fun size packet of M&Ms) 2. Take every possible sample of that size from the population 3. Calculate the mean of each sample and plot it on a frequency histogram.
Our class sample distribution 0 1 2 3 4 5 6 7 8 9 10 11 12 Number of Green M&Ms
Sampling Error How accurately does your sample mean represent the population? How accurately does our class sample mean represent the population? (Mars, Inc. says that in a fun-size packet we should find about 2. 5 green M&Ms) Were we close?
Two determinants of Sampling Error: 1. Sample size: N 2. Variability: SD So, 1 fun size packet of M&Ms (or a small sample of people) is less likely to be representative of the population especially if there is lots of variability in the population.
Sampling Error and Confidence Intervals Confidence intervals: l When we report a 95% CI for a sample mean we are saying that within this range of values lies the “true population mean” and we are 95% confident about that range. l l The bigger the range, the larger the error.
Calculate for Green M & Ms. l http: //www. miniwebtool. com/standard-errorcalculator/ Take the mean. l Multiply the Standard error by 2 l Add and subtract this number from the mean to get the 95% CI l (Mars, Inc. says that in a fun-size packet we should find about 2. 5 green M&Ms) Were we close? Does 2. 5 fall in our range?
In-Class Confidence Interval Work
Testing a Hypothesis l What l Will if our question is… there be a difference in the mean “yummy” rating for Peanut and Plain M&Ms?
Null Hypothesis Testing Accepting vs. rejecting hypotheses
The Null Hypothesis l Assumes that the IV had no effect at all; Any difference b/w the mean ratings was due to chance (sampling error). l Stated: There will be NO differences between plain and peanut M & M yummy ratings.
Null vs. Alternative l The null hypothesis assumes NO effect. l Your alternative hypothesis assumes there will be a difference or an effect. l Directional = Plain > Peanut l Non-directional = Plain ≠ Peanut
Testing our Null Hypothesis l To test this we need a sampling distribution based on this type of Null Hypothesis. l No difference between two means
Types of Sampling Distributions (“magic tables”) l One sample Z score l l T-distribution (Student’s t-test) l l Tests the null assumption that two sample means are similar enough that they probably came from the same population. ANOVA (F test) l l Tests the null assumption that our sample mean is equal to some pre-determined mean. Tests the null hypothesis that more than two sample means are equal. Correlation (r) l Tests the null hypothesis that two variables are unrelated.
5 Steps to test your hypothesis 1. State the Null Peanut M&M mean = Plain M&M mean. The alternative is always your research hypothesis. Group A >/< than Group B We don’t actually state the null in our papers, but it is assumed since we can only disprove the null; you can never prove your alternative.
2. Select your statistic Examples l t-test l ANOVA l Correlation l Chi-Square l For our example, we will use a t-test since it uses an appropriate sampling distribution for our null hypothesis.
3. Calculate the actual difference in group means and standardize this mean difference. You could use software, such as SPSS, on -line calculators for common statistics or compute by hand. We’ll use this online calculator.
4. Determine Probability Determine the probability that your findings could occur by chance alone. (Refer to a distribution table or get the exact p -value from a stats program. ) You’ll need the degrees of freedom too (based on the size of groups). (our example: DF = n 1 + n 2 minus 2)
5. Draw your conclusion. p <. 05; reject the null and accept your hypothesis p >. 05; accept the null MEMORIZE THIS!
5. Draw your conclusion from the p-value stands for probability and is equivalent to a percentage. e. g. , p =. 03 (3% probability) e. g. , p =. 45 (45% probability) p <. 05; reject the null and accept your hypothesis p >. 05; accept the null MEMORIZE THIS!
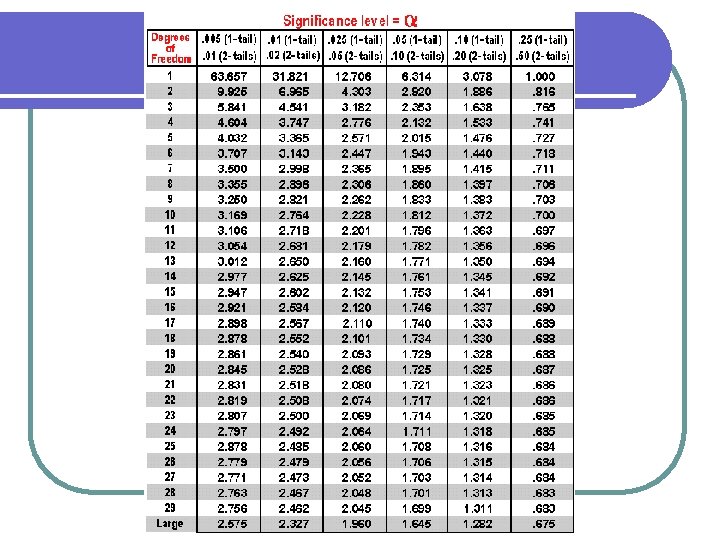
Review: How to Use a Stats Table Obtain your “computed” t-value by calculating a t-test. l Look up the “critical” t-value in a table for the pvalue associated with the level of risk you are willing to take (using your df to find the right number). l If your computed t-value is equal to or greater than the critical t-value in the table then your results are unlikely to have happened by chance! l l
Write it up in APA style There was/was not a significant difference in the mean yummy ratings between peanut and plain M & Ms, t(#), #, p = #. The yummy rating for peanuts (M = #, SD = #) compared to plain (M = #, SD = #). # = DF (number of responses) # = calculated statistic result # = probability value associated with that statistical result
Quick Quiz 1. Is a p-value of. 50 statistically significant? 2. What is the probability (percentage) associated with a p-value =. 023 3. If the p-value =. 04 will you accept or reject the null? 4. What could happen to your sampling error if you widen your sample to include international students?
Understanding Significance If the probability that a particular difference or relationship could be found by chance alone is small then it is statistically significant. l Level l l Is of significance is arbitrary (why 5%? ). Alpha (5%) is set by an experimenter. not the same as practical significance.
One-Tailed vs. Two Tailed l One-tailed: directional; you only have to look at 1 side of the distribution. l Alpha =. 05 l Two-tailed: nondirectional; you have to look at both sides of the distribution. l Alpha =. 025 l Tables vs. SPSS
Errors in Inferential Conclusions l Type I: Assuming your IV had an effect when it was just due to chance. l Related directly to the p -value or alpha l Type II: Assuming your IV didn’t have an effect when it did (perhaps just too small to detect). l Who knows how often this happens!
Common Inferential Tests l t-test l (t) Tests differences between 2 group means l Correlation l Tests for the strength of relationship between 2 variables l Analysis l (r) of Variance (ANOVA) (F) Tests differences between 3 or more group means Each test requires its own unique theoretical distribution and its own formula for standardizing scores to it.
Let’s Practice My hypothesis is that Men will rate attractiveness as more important than women when selecting a mate. l What distribution will I use? (t, F, r) l If I survey 20 men and 22 women what is my DF? l What will my critical value be? l l l . 05. 01 If my computed value = 1. 80, should I accept or reject my hypothesis?
Let’s Practice My hypothesis is that people will react differently to negative messages depending on whether they are sent by text, email or handwritten note. l What distribution should I use? t, F, r l If I have 33 people in all, what is my DF? l What is my critical value if alpha is l l l . 05. 01 If my computed value = 4. 1, should I reject or accept my hypothesis?
Places to Go to Learn More l http: //www. sdecnet. com/psychology/stat help. htm l http: //psychology. ucdavis. edu/sommerb/ sommerdemo/stat_inf/intro. htm