From Export Promotion to Import substitution Comparative Experience

From Export Promotion to Import substitution: Comparative Experience of China and Mexico Mehdi Shafaeddin Director: Global Vision (Training & Consultancy) Affiliated to the Institute of Economic Research, University of Neuchatl, Switzerland

The QUESTIONS • What is the experience of China and Mexico in export processing? • Why is China more successful than Mexico • Can the experience of China be replicated? In two papers

Outline • The literature • Performance of trade, MVA & GDP • Performance of Processing Industries • Conclusions: Prospects for the future

The literature • Import Substitution and Export Promotion as Alternative Strategies • The process of MS & Prebisch’s thinking • MS as prerequisite to EP • Common Argument: Emphasize on learning – MS: Learning by doing – (outward-orientation )EP: Transfer of knowledge & Tech. – Opening up: imitation; catch-up opportunities; innovation • Differences – MS: need for Gov. intervention – EP: Hands off

Critiques of MS, EP • Contribution to Learning: not much in either case • MS: often discouraged learning; – Reasons; lack of efficient Gov. policies – exceptions • EP: did not appreciate internal conditions for learning: – Simply exporting is not sufficient – Learning is not automatic – Gov policies required
: Productive Power (PP) and Learning • List: mental capita as main source")
Literature (2): Productive Power (PP) and Learning • List: mental capita as main source of PP – Role of socio-economic factors – Importance of gov. Policies in industrial learning and education ; – external economies of learning • Others : Arrow, Linder; Fellner: role of experience • Capability Building Theory – Role of tech. capability in a broad sense – Market failure – Need for intervention • Test of Impact of FDI: Experience of Costa Rica/ Ireland

Mexico &China : Similarities & differences • Similarities: – Opening up to trade; FDI and processing • Difference: performance: (table 1) – Growth of Xman. – Trade balance – FDI; national I – MVA; GDP (graph 1) – Trade in Parts (table 1. a
 China Growth rates")
Table 1: Comparative economic Performance of china and Mexico (1965 -2005) China Growth rates Mexico 65 -80 80 -90 90 -2000 -2005 2004 2005 60 -80 80 -90 90 -2000 -2005 2004 2005 Manufacturing value Added 10. 5 10. 8 12. 7 11. 3 10. 7 10 0. 9 1. 5 4. 3 0. 0 4. 0 1. 2 Gross Domestic Product 6. 6 10. 3 10. 6 9. 6 10. 1 9. 9 6. 3 1. 1 3. 1 1. 9 4. 1 3. 0 Gross Fixed Capital Formation 9. 7 9. 8 13. 9 14. 8 12. 4 14. 6 7. 7 -2. 7 4. 1 1. 8 7. 5 7. 6 Total Exports 12. 8 14. 5 23. 7 a 31 5. 9 16. 1 3. 5. a 14. 3 (Xman-Mman)/Xman. Initial period/%) -1. 65 4. 5 22. 6 18. 3 -67 -58 -13. 1 -16 Ratios 70/71 80/81 90/91 04/05 MVA/GDP 34. 4 39. 5 32. 8 44. 1 23. 1 22. 1 20. 7 17. 9 GFCF/GDP 24. 5 27. 5 26. 5 38. 4 19. 0 25. 6 18. 3 19. 5 FDI/GDP 0. 0 0. 1 1. 0 3. 5 0. 8 1. 1 1. 3 2. 3 Exports of Manufactures / Total
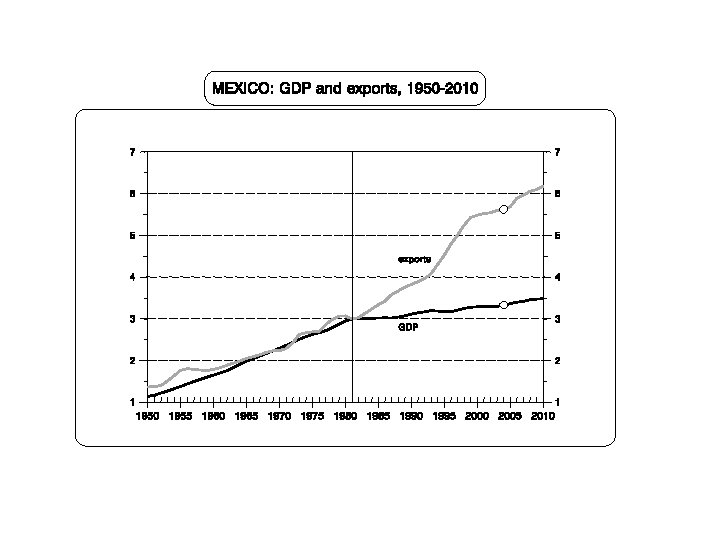

Table 1. a: Trade in Parts and Components: Manufactured Good; China and Mexico -------------------------------------------1992/3 2003/4 China : Value($b) Exports 3. 2 58. 4 Imports 9. 8 44. 6 Balance -6. 57 13. 8 Shares : Components/total X: 6. 3 17. 6 Mexico: Value($b) Exports 6. 8 26. 3 Imports 13. 8 33. 8 Balance -7. 5 Shares : Components/total X: 20. 2 23. 9 Meomo : balance of man. trade ($b): China -5. 8 125. 2 Mexico -17. 8 -1. 7

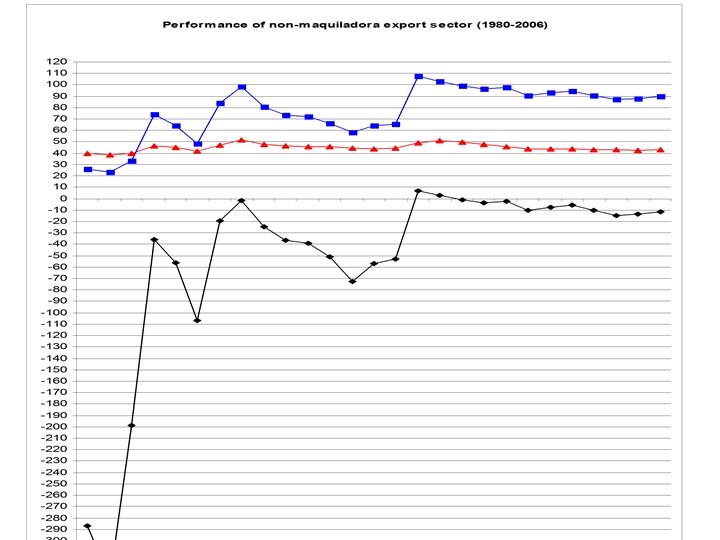
Performance of Maquila sector Mexico 1974 1985 2000 2006 Ratio 98/85 Ratio 06/98 - Gross output ($b) 0. 01 1. 3 669 1139 341 2. 6 - Local input: % -VA: % 0. 9 0. 7 2. 4 2. 8 2. 4 1. 3 36. 3 24. 9 22. 1 20. 4 0. 6 0. 9 RV. % 37. 2 25. 6 24. 5 23. 2 0. 93 1 Imported input: % 64. 3 75. 1 75. 6 76. 7 1. 2 1

Performance of Maquila and non-aquila: 1
 Ratios Xp Mp RV Xp/Xm RV/Xp")
Processing trade of China: Evolution year Value($10 m) Ratios Xp Mp RV Xp/Xm RV/Xp 1981 11 15 -3. 7 5 -32 1990 254 188 67 55 26 2000 1377 926 451 62 33 2006 4164 2740 1423 58 34

Prospects for the Future • What are the prospects for increasing value added in assembly operation of China and Mexico? • Evolution of pattern of CA • RCA indices: – Rx= [Xij/Xj]: Xwi/Xw]; – Rm = [M ij / Mj ] [ M wj / Mw ]; – Cr= (Change in R)/R

China: RCA in X • • • Choice of about 30 products=64% of X RCA in almost all 13 capital/tech. intensive; mostly elect. 14 L intensive Gain RCA (increase in Cr) in K/T, particularly elect. • Loss in Cr in most L intensive • So good prospects for X; BUT? How about production?

China: RCA & M: Components Assembly Operation or Production? • Choice pf products: 30: 67% of M • Intermediate/components: 19; bulk of M • Comparative advantage in assembly in all components: except automobile • Advantage in assembly increased in most cases • However in 4 cases (of components) adv. In production increased • How about finished good?

China: RCA & M: Finished products Production? • Increase in adv. In production of: – Telecommunication equipment – Specialized machinery – Textiles and leather machinery – Aircraft – Machine tools for working metals – Passenger cars

Mexico: RCA: X • Choice of products : similar to China • Mexico exports higher no. of K/T intensive products than china(18 out of 29) • Automotive &elect. 25 % of X • Gained adv. On components of auto. &data processing • Lost adv. In X on 11 K/T intensive finished goods • How about assembly operations?
with adv.")
Mexico: RCA: M Production? • Paperboard the only intermediate product (out of 13)with adv. in production; but adv. In assembly increased! • Finished goods: advantage in production in: – Automotive – Data processing Examine these cases

Auto. &data processing Prospects Exports R Rc Imports R Rc 1. Office machines and auto. data processing : Finished products: 751 0. 63 0. 45 0. 44 752 2. 076 3. 677 0. 91 Components: SITC 759 0. 801 1. 438 1. 277 0. 42 1. 48 3. 612 2. Automotive products: Finished products: 781 1. 518 782 4. 231 783 1. 58 0. 991 3. 388 20. 34 0. 672 1. 08 0. 25 5. 366 3. 81 0. 19 Components 784 1. 1 2. 32 3. 66 1. 7

Conclusions China Mexico Question?
- Slides: 22