
From Data Warehouse to Business Intelligence The Michigan
From Data Warehouse to Business Intelligence: The Michigan Journey Presenters: John Gohsman Sean Mallin University of Michigan i. Strategy Solutions
Michigan Facts • Three campuses – Ann Arbor (40, 000 students, 23, 000 faculty/staff) – Dearborn & Flint (12, 000 students, 1, 800 faculty/staff) • Health System – Includes: Medical School, 3 hospitals, 30 health centers and 120 outpatient clinics (13, 000 total employees) • Financial Picture – Annual Budget >$4 Billion (10% from State of Michigan) – $823 M research funding per year (NIH 47%, NSF 9%, DOD 8%) – Endowment: $6 billion • Michigan values its highly decentralized nature – “Coordinated autonomy”
i. Strategy Facts • Sean to complete…
Presentation Outline • • The Data Warehouse Foundation Moving to Business Intelligence Demonstrations What’s Next
The 80 s
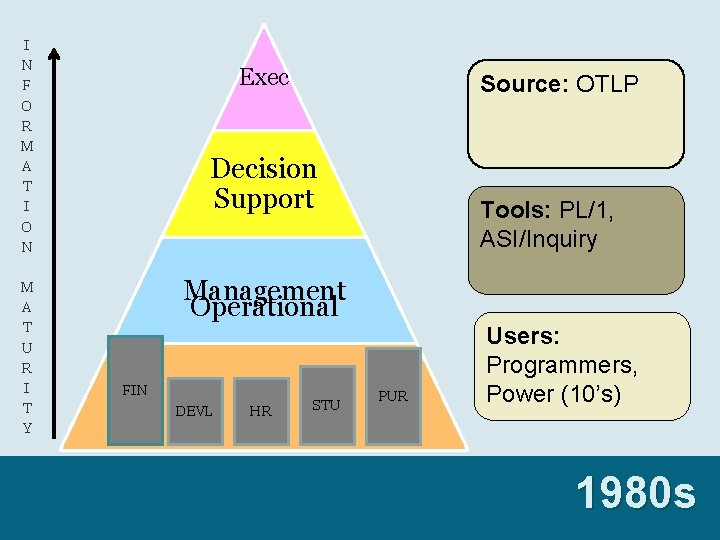
I N F O R M A T I O N M A T U R I T Y Exec Source: OTLP Decision Support Tools: PL/1, ASI/Inquiry Management Operational FIN DEVL HR STU PUR Users: Programmers, Power (10’s) 1980 s
The 90 s
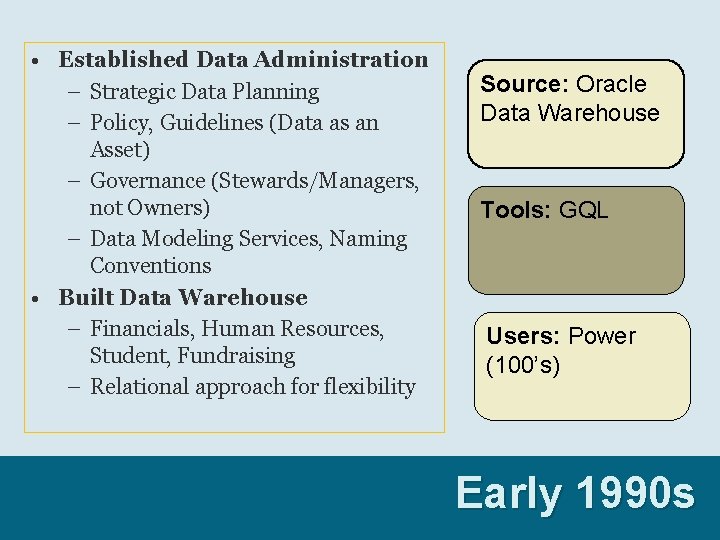
• Established Data Administration – Strategic Data Planning – Policy, Guidelines (Data as an Asset) – Governance (Stewards/Managers, not Owners) – Data Modeling Services, Naming Conventions • Built Data Warehouse – Financials, Human Resources, Student, Fundraising – Relational approach for flexibility Source: Oracle Data Warehouse Tools: GQL Users: Power (100’s) Early 1990 s 1980 s
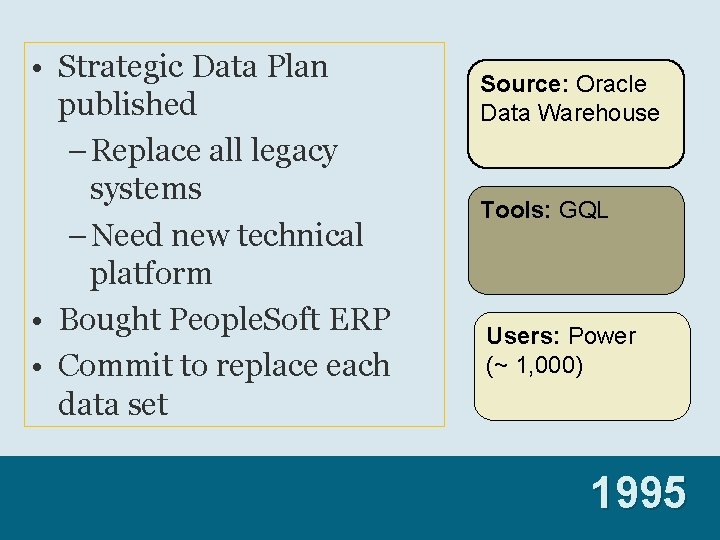
• Strategic Data Plan published – Replace all legacy systems – Need new technical platform • Bought People. Soft ERP • Commit to replace each data set Source: Oracle Data Warehouse Tools: GQL Users: Power (~ 1, 000) 1980 s 1995
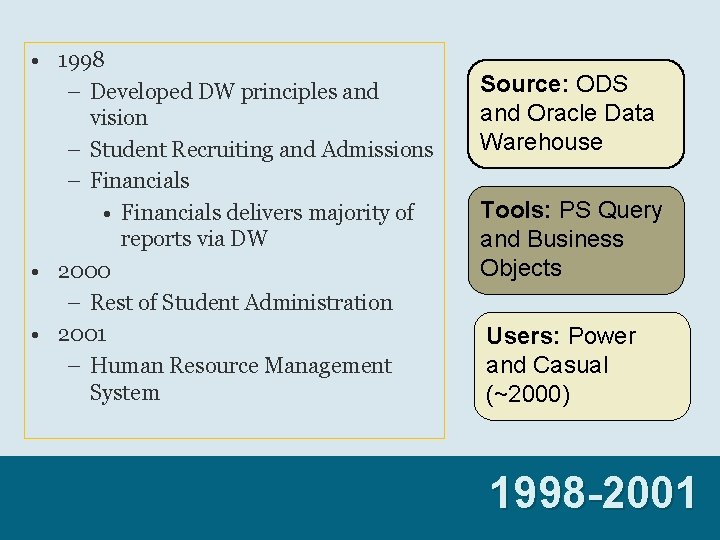
• 1998 – Developed DW principles and vision – Student Recruiting and Admissions – Financials • Financials delivers majority of reports via DW • 2000 – Rest of Student Administration • 2001 – Human Resource Management System Source: ODS and Oracle Data Warehouse Tools: PS Query and Business Objects Users: Power and Casual (~2000) 1998 -2001 1980 s
2000 and Beyond
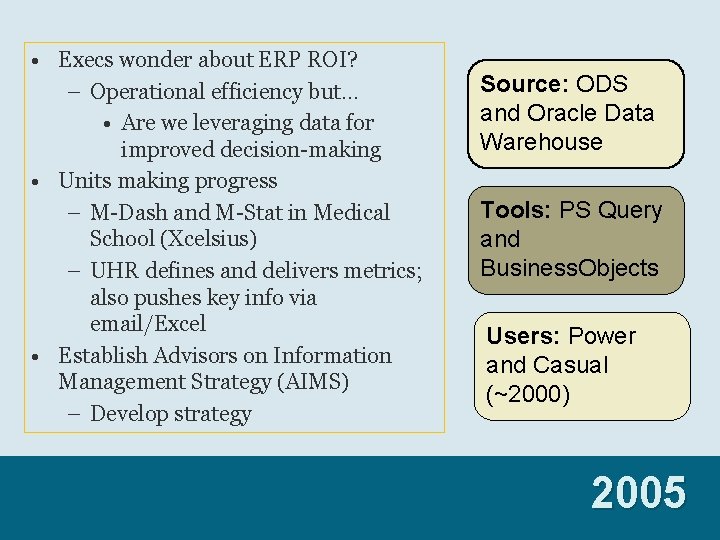
• Execs wonder about ERP ROI? – Operational efficiency but… • Are we leveraging data for improved decision-making • Units making progress – M-Dash and M-Stat in Medical School (Xcelsius) – UHR defines and delivers metrics; also pushes key info via email/Excel • Establish Advisors on Information Management Strategy (AIMS) – Develop strategy Source: ODS and Oracle Data Warehouse Tools: PS Query and Business. Objects Users: Power and Casual (~2000) 1980 s 2005
Presentation Outline • • The Data Warehouse Foundation Moving to Business Intelligence Demonstrations What’s Next
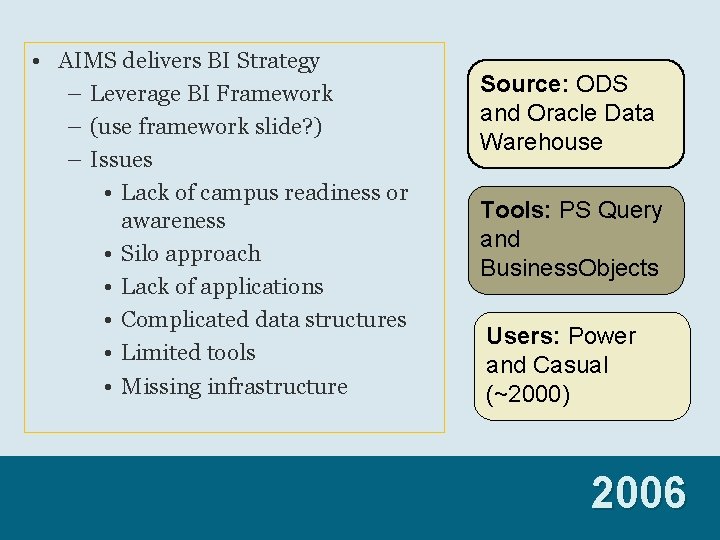
• AIMS delivers BI Strategy – Leverage BI Framework – (use framework slide? ) – Issues • Lack of campus readiness or awareness • Silo approach • Lack of applications • Complicated data structures • Limited tools • Missing infrastructure Source: ODS and Oracle Data Warehouse Tools: PS Query and Business. Objects Users: Power and Casual (~2000) 1980 s 2006
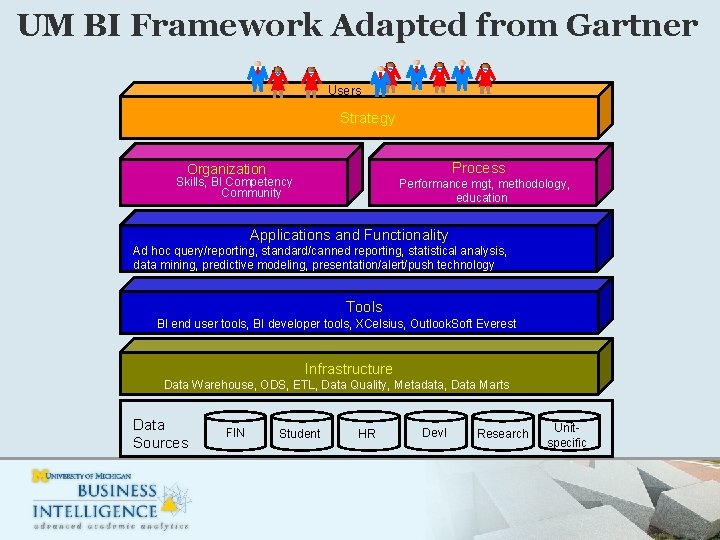
UM BI Framework Adapted from Gartner Users Strategy Process Organization Skills, BI Competency Community Performance mgt, methodology, education Applications and Functionality Ad hoc query/reporting, standard/canned reporting, statistical analysis, data mining, predictive modeling, presentation/alert/push technology Tools BI end user tools, BI developer tools, XCelsius, Outlook. Soft Everest Infrastructure Data Warehouse, ODS, ETL, Data Quality, Metadata, Data Marts Data Sources FIN Student HR Devl Research Unitspecific
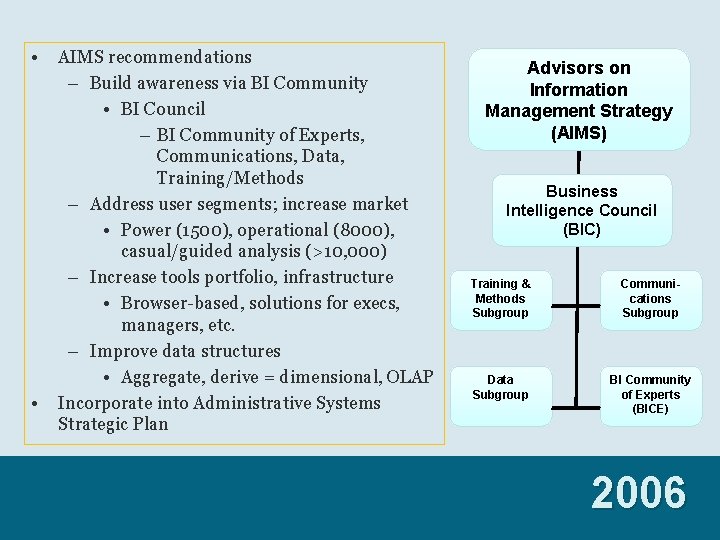
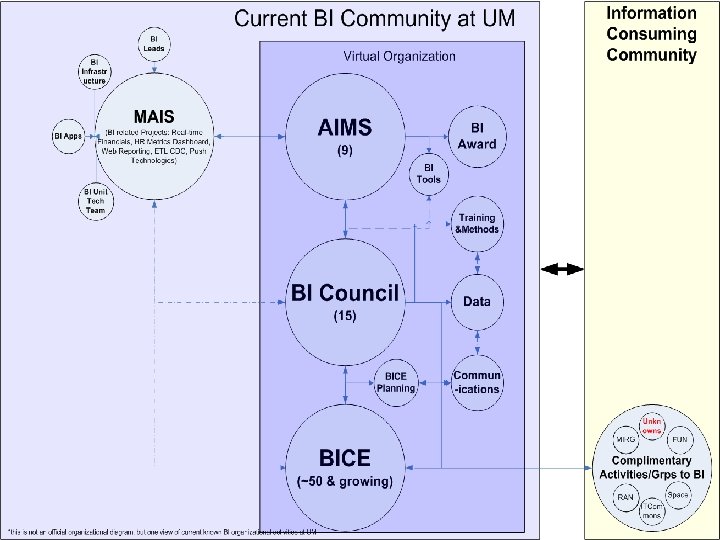
• • AIMS recommendations – Build awareness via BI Community • BI Council – BI Community of Experts, Communications, Data, Training/Methods – Address user segments; increase market • Power (1500), operational (8000), casual/guided analysis (>10, 000) – Increase tools portfolio, infrastructure • Browser-based, solutions for execs, managers, etc. – Improve data structures • Aggregate, derive = dimensional, OLAP Incorporate into Administrative Systems Strategic Plan Advisors on Information Management Strategy (AIMS) Business Intelligence Council (BIC) Training & Methods Subgroup Communications Subgroup Data Subgroup BI Community of Experts (BICE) 1980 s 2006
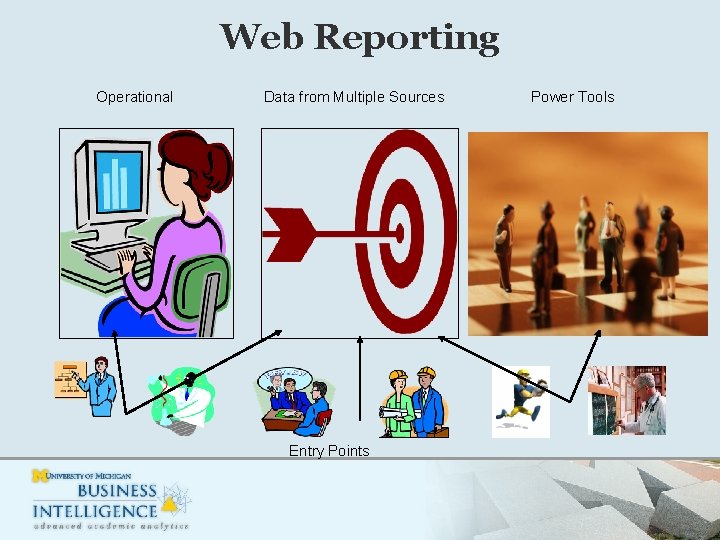
Web Reporting Operational Data from Multiple Sources Entry Points Power Tools
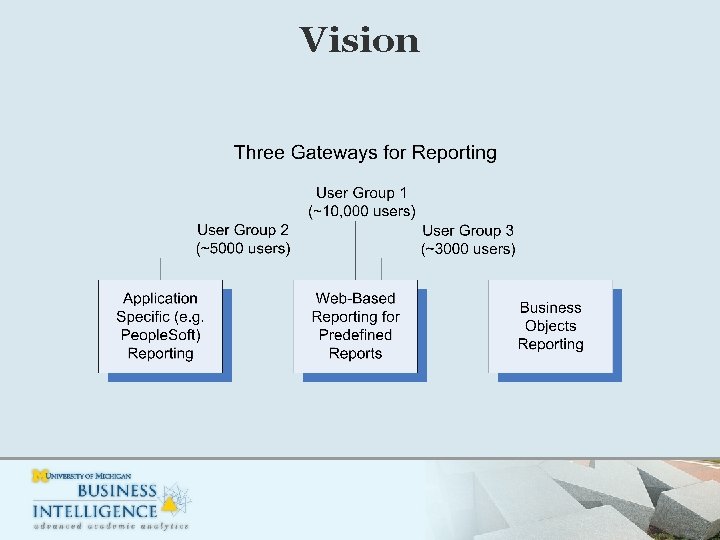
Vision
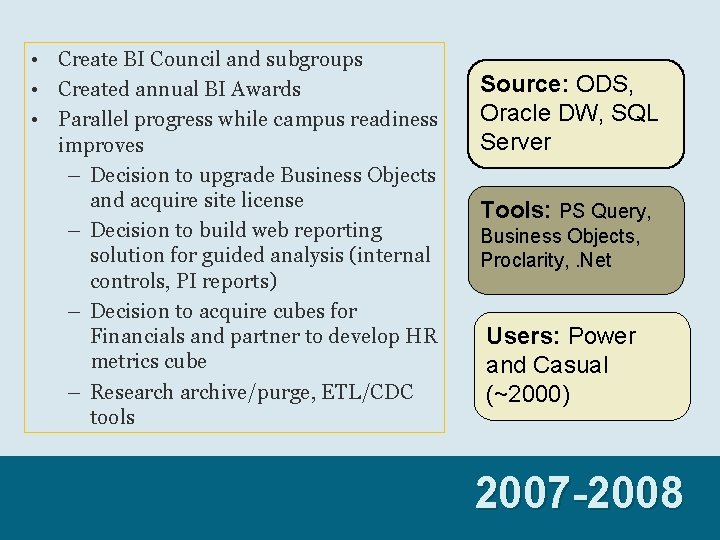
• Create BI Council and subgroups • Created annual BI Awards • Parallel progress while campus readiness improves – Decision to upgrade Business Objects and acquire site license – Decision to build web reporting solution for guided analysis (internal controls, PI reports) – Decision to acquire cubes for Financials and partner to develop HR metrics cube – Researchive/purge, ETL/CDC tools Source: ODS, Oracle DW, SQL Server Tools: PS Query, Business Objects, Proclarity, . Net Users: Power and Casual (~2000) 2007 -2008 1980 s
Presentation Outline • • The Data Warehouse Foundation Moving to Business Intelligence Demonstrations What’s Next
i. Strategy: HR Metrics
M-Reports
M-Reports Vision M-Reports will deliver business intelligence to users in a customizable user interface • Alerts, metrics and personalized reports based on user profile, preferences and role based security • Guided analysis through data • Data sourced from multiple underlying databases (production, ODS, Data Warehouse, unit data) • MAIS and University units can develop and publish content
Presentation Outline • • The Data Warehouse Foundation Moving to Business Intelligence Demonstrations What’s Next
Creating a BI Organization • Increase size of team • Expand mission, increase functions – Add Analytical skills – Increase Application Development – Enhance BI Community – Increase Consulting and Training – Enhance Data Administration – Improve Data Set Development – Increase Tools Support
Deliver More Solutions • • More cubes, dimensional models Broad content in M-Reports Dashboards (KPIs, personalized thresholds) Push (reports, alerts) Predictive Analytics Workflow Process Management
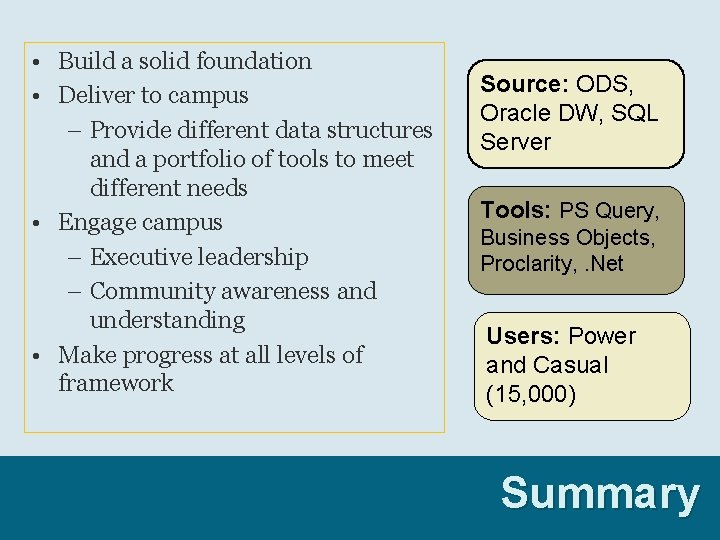
• Build a solid foundation • Deliver to campus – Provide different data structures and a portfolio of tools to meet different needs • Engage campus – Executive leadership – Community awareness and understanding • Make progress at all levels of framework Source: ODS, Oracle DW, SQL Server Tools: PS Query, Business Objects, Proclarity, . Net Users: Power and Casual (15, 000) Summary 1980 s
For More Information Visit: • • www. bi. umich. edu http: //www. mais. umich. edu/stratplan/index. html http: //www. mais. umich. edu/reporting/index. html http: //spg. umich. edu/pdf/601. 12. pdf Or contact: jgohsman@umich. edu smallin@istrategysolutions. com
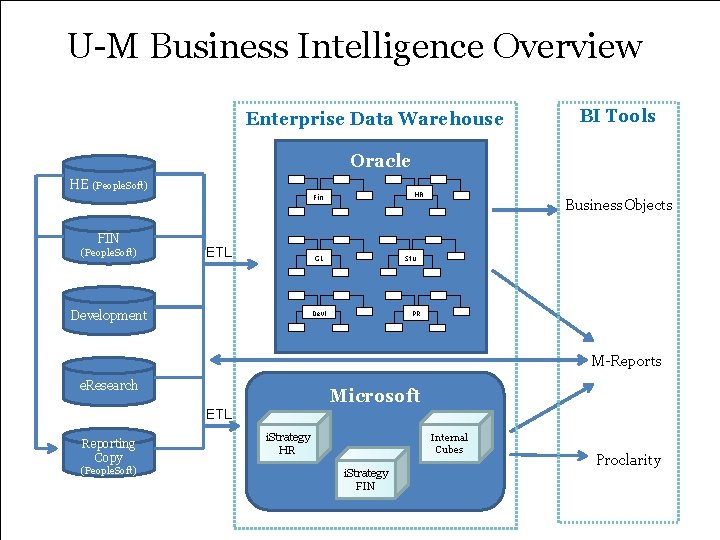
U-M Business Intelligence Overview Enterprise Data Warehouse BI Tools Oracle HE (People. Soft) HR Fin FIN (People. Soft) ETL GL Development Business. Objects Stu Devl PR M-Reports e. Research Microsoft ETL Reporting Copy (People. Soft) i. Strategy HR Internal Cubes i. Strategy FIN Proclarity
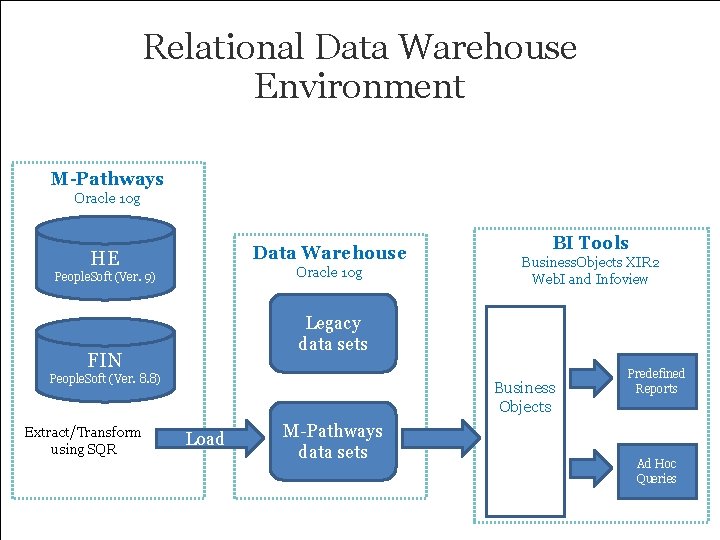
Relational Data Warehouse Environment M-Pathways Oracle 10 g Data Warehouse HE Oracle 10 g People. Soft (Ver. 9) Business. Objects XIR 2 Web. I and Infoview Legacy data sets FIN People. Soft (Ver. 8. 8) Extract/Transform using SQR BI Tools Business Objects Load M-Pathways data sets Predefined Reports Ad Hoc Queries
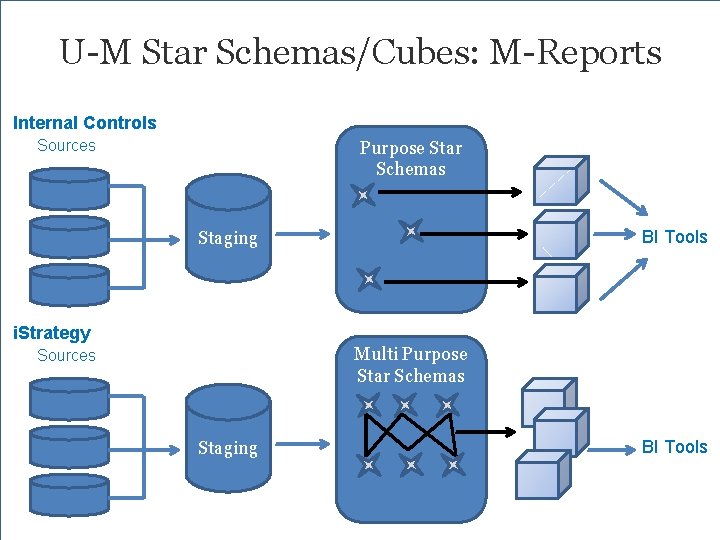
U-M Star Schemas/Cubes: M-Reports Single Internal Controls Sources Purpose Star Schemas BI Tools Staging i. Strategy Multi Purpose Star Schemas Sources Staging BI Tools
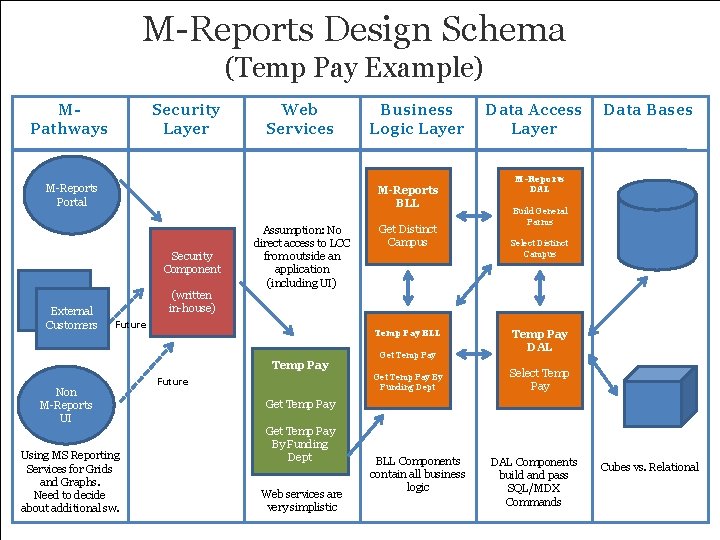
M-Reports Design Schema (Temp Pay Example) MPathways Security Layer Web Services M-Reports Portal M-Reports BLL Security Component External Customers Business Logic Layer Assumption: No direct access to LCC from outside an application (including UI) Get Distinct Campus Data Access Layer Data Bases M-Reports DAL Build General Parms Select Distinct Campus (written in-house) Future Temp Pay BLL Temp Pay Non M-Reports UI Using MS Reporting Services for Grids and Graphs. Need to decide about additional sw. Get Temp Pay By Funding Dept Future Temp Pay DAL Select Temp Pay Get Temp Pay By Funding Dept Web services are very simplistic BLL Components contain all business logic DAL Components build and pass SQL/MDX Commands Cubes vs. Relational
- Slides: 33