Friday lecture Oxygen therapy Dr YH Wong Chairman


 = 1 Bar = 760")
 Diffusion")
 = 160 mm. Hg (0. 21 bar) •")


 deliver low")
 • Duration (short term")


 •")


 • Reservoir volume")


, gas embolism on decompression")

- Slides: 57
Friday lecture: Oxygen therapy Dr YH Wong Chairman: Dr. Arthur CW Lau 19 Nov 2010
Introduction • Mammalian energy provided by anaerobic and aerobic respiration • Aerobic respiration renders most efficient ATP production • Substantial part of critical care is targeted at treating and / or preventing hypoxia
However…. • One of the rare signs in ICU is a patient who is not receiving supplemental oxygen to breathe • >50% of hospitalized patients were receiving oxygen without a written order Small D, Duha A, Wieskopf B, et al. Uses and misuses of oxygen in hospitalized patients. Am J Med 1992; 92: 591– 595.
The fact is…. • Tissues are normally hypoxic • Concentration of dissolved oxygen in tissue is determined by the PO 2 in the tissues and the solubility coefficient of oxygen in water • Total volume of oxygen in the tissues of human body = 13 ml
Whalen WJ, Riley J. A microelectrode for measurement of intracellular PO 2. J Appl Physiol 1967; 23: 798– 801.
Clinical observations show that severe degrees of hypoxemia are tolerated without evidence of inadequate tissue oxygenation
N. B. Standard indications for supplemental oxygen = Pa. O 2<60 mm. Hg or Sa. O 2 <90% Normal lactate level = <4 mmol/L Similar observation corroborated in ARDS Eldridge FE. Blood lactate and pyruvate in pulmonary insufficiency N Engl J Med 1966; 274: 878– 883.
In the resting patient, even the most severe clinical hypoxemia due to pulmonary insufficiency does not itself lead to generalized tissue anaerobiasis
The end-point of tissue oxygenation • Discrepancy between changes in Pa. O 2 and systemic oxygen transport • Pa. O 2 increases from 61 to 83 mm Hg (36% change, P < 0. 01) while the rate of oxygen transport decreases from 12. 8 to 12. 1 m. L/minute/kg (5% change, insignificant) • Increase in Pa. O 2 during oxygen inhalation should not be used as evidence for an increase in tissue oxygen availability • Consistent with the observation that oxygen inhalation does not protect against myocardial ischemia De. Gaute JP et al. Oxygen delivery in acute exacerbation of chronic obstructive pulmonary disease. Effects of controlled oxygen therapy. Am Rev Respir Dis 1981; 124: 26.
Physiology of oxygen delivery
SI units of pressure • 1 ATM (atmospheric pressure) = 1 Bar = 760 mm. Hg
Oxygen delivery pathway 1. 2. 3. 4. 5. 6. Convection into body (ventilation) Diffusion into blood (oxygen uptake) Hemoglobin binding Convective transport to tissues (cardiac output) Diffusion into cells and organelles Redox state of the cell
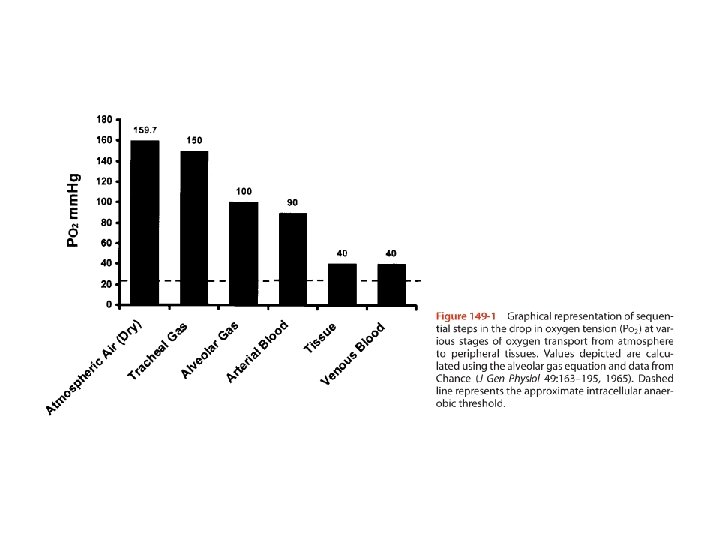
Ventilation • PO 2 (sea level) = 160 mm. Hg (0. 21 bar) • PO 2 (alveolus) = 100 mm. Hg (after air humidification and mixing with exhaled CO 2) • Much of oxygen therapy based on increasing oxygen delivery into the lungs
Oxygen uptake • Alveolar capillary membrane = 0. 3µm • Surface area of respiratory membrane = 50 -100 m 2 • Pa. O 2 in pulmonary capillaries = 90 mm. Hg Two important mechanisms of hypoxia: • Thickness and barrier effect of the space between alveolus and capillary • Ventilation / perfusion mismatch
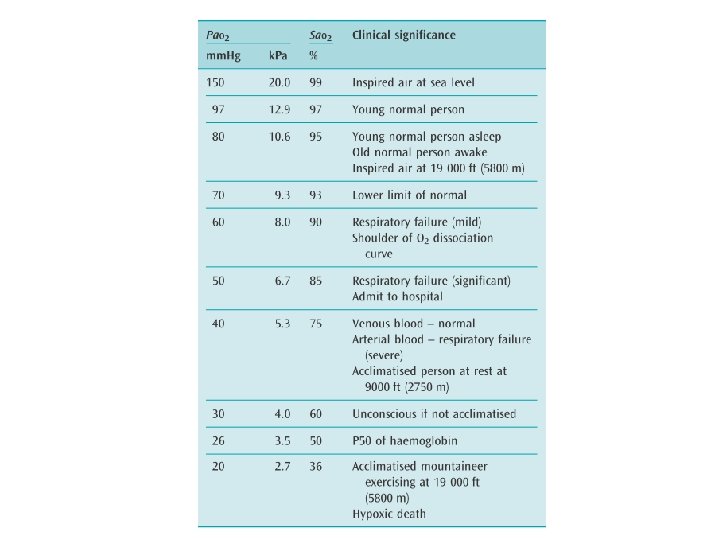
Hemoglobin binding • Oxygen poorly soluble in water • Hb-O 2 dissociation curve is not linear • P 50 = the Pa. O 2 at which 50% Hb is saturated
Factors influencing Hb dissociation curve Alteration of PCO 2 or p. H will therefore affect oxygen availability
Convective transport to tissues • • Cardiac output + local control of regional tissue perfusion Delivery of oxygen depends on its blood concentration Ca. O 2 α Hb α Sa. O 2 α Pa. O 2 (minor extent) Delivery of oxygen α CO x Ca. O 2 • Normal resting O 2 delivery = 1000 ml/min • Oxygen consumption at rest = 250 ml/min • Oxygen extraction ratio = 25% at rest (up to 70 -80% during exertion) • Mixed venous blood is useful for measuring global oxygen delivery (usually requiring presence of pulmonary artery catheter) • Central venous blood Sv. O 2 ~70% usually indicates appropriate global O 2 delivery
Diffusion into cells • Most aerobic respiration in mitochondria • PO 2 falls from 160 mm. Hg to as low as 1 mm. Hg • Below this value cellular demands for O 2 outweigh its delivery
Redox state of the cell • Cell determines how much oxygen it uses by creating O 2 gradient • ATP/ADP ratio and p. H drive ATP production and modify O 2 requirement • Cell is autonomous and use what it needs • Theoretically excess O 2 is of no benefit
Pathology of oxygen delivery
Types of hypoxia
Relationship between oxygen supply and demand Low oxygen delivery made worse by increased demand Metabolic rate increases with sepsis / trauma / seizure Interventions such as adrenergic drugs can lead to increased O 2 demand
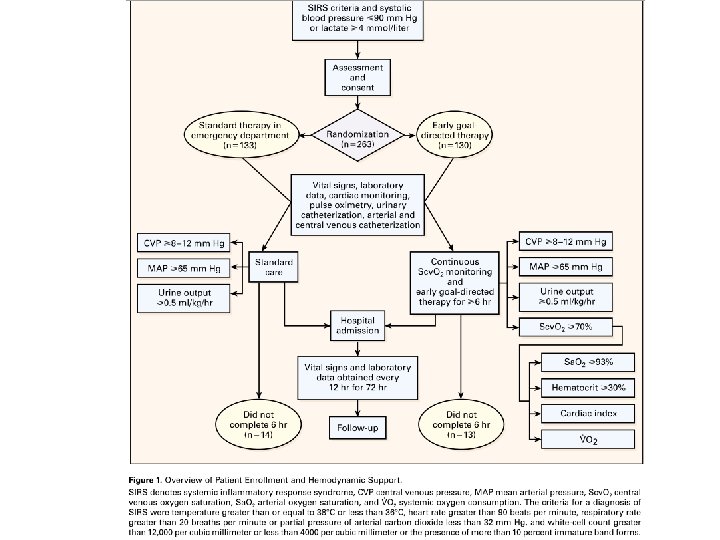
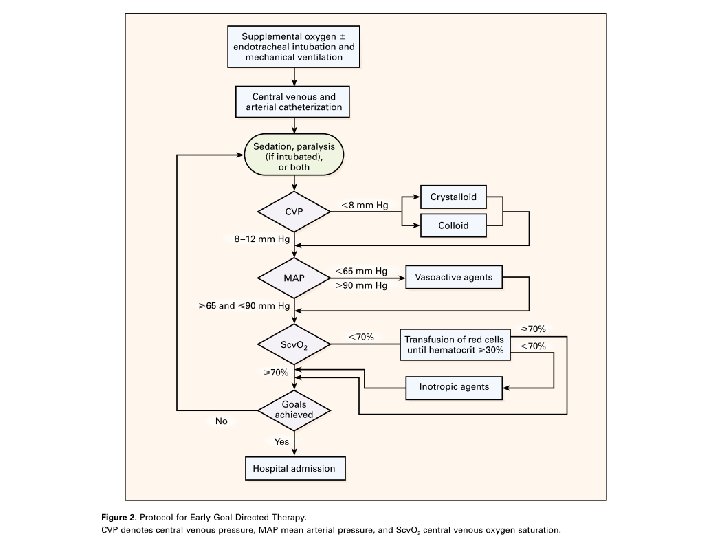
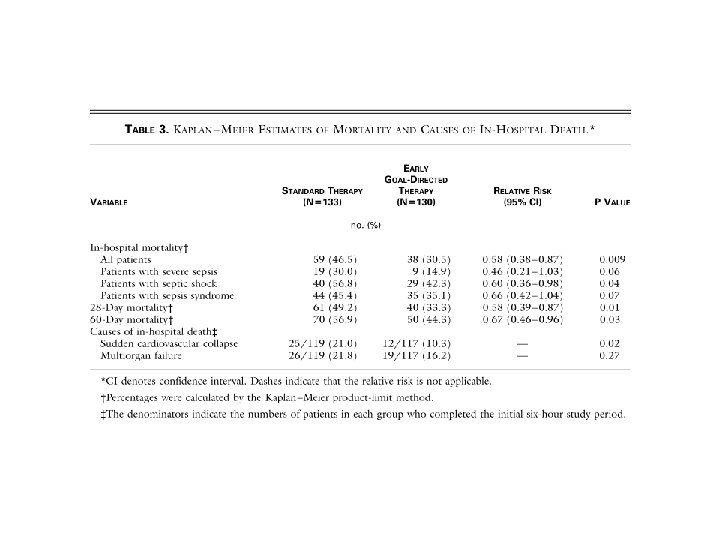
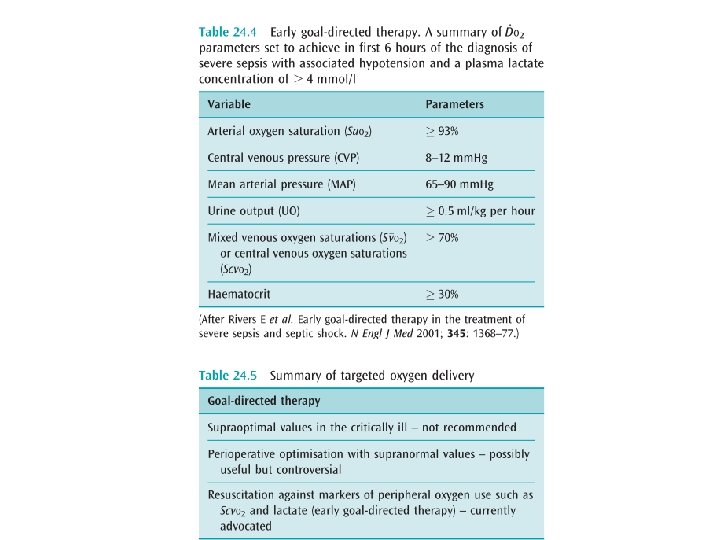
Relationship between supply and demand of O 2 • Tissue hypoxia = inadequate delivery or defective extraction of O 2 (latter more difficult to correct) • Resuscitation beyond supra-normal oxygen requirement not helpful • Early goal directed therapy now included in guidelines for treatment of severe sepsis
0
Short summary Oxygen should not be used routinely Pa. O 2 or Sa. O 2 correlates inadequately with tissue oxygenation Theoretically Sv. O 2 is a better marker of tissue oxygenation and hence indicator of oxygen therapy
Oxygen therapy apparatus and devices
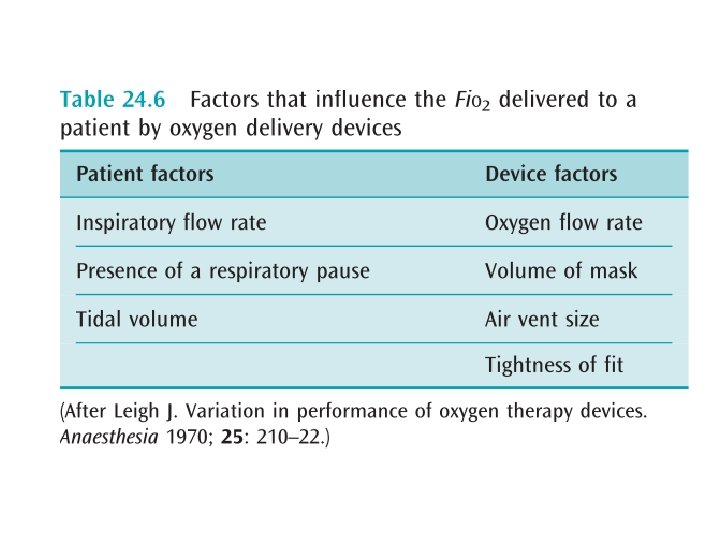
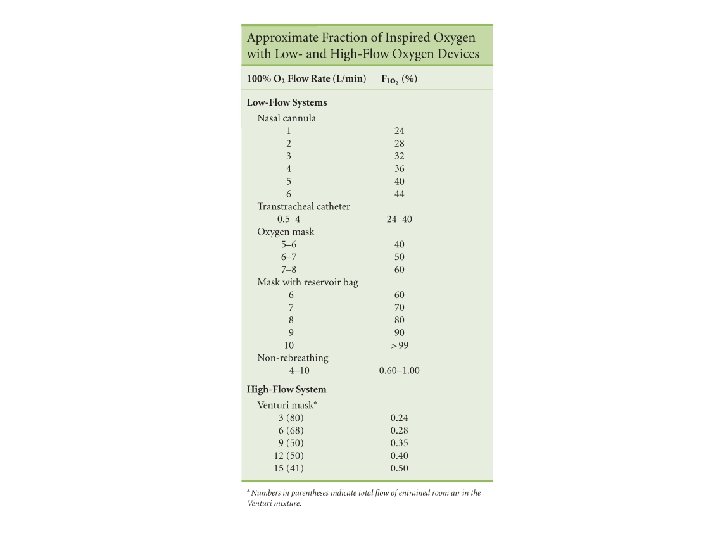
Principles • Most simple devices (e. g. nasal cannula, simple face mask) deliver low O 2 flow rates relative to peak inspiratory flows (25 -100 L/min) • Final Fi. O 2 influenced by entrainment of environmental air which dilutes the set Fi. O 2 • Actual Fi. O 2 determined by interaction between delivery system and patient’s breathing pattern and is unpredictable
Oxygen delivery devices Classified by • Performance (variable or fixed) • Duration (short term or long term) • Flow (low or high) • Non-invasive or invasive
Oxygen delivery devices
Components • Oxygen supply and flow control • Connection tubing (in some systems the tubing can also act as a reservoir) • Reservoir • Patient attachment • Expired gas facility • Humidification • Oxygen monitor
Variable performance systems • Small reservoirs and low gas flow (2 -15 L/min) • Shallow breathing less entrained room air, higher Fi. O 2 • Exhalation time variable filling of devices’ inspiratory reservoir • Nasal cannula • Oxygen mask • Tracheostomy mask
Nasal cannula • The proximity and size of the reservoir (NP/OP~50 ml=1/3 of anatomic dead space) imply sensitivity to changes in inspiratory flow rate and particularly the loss of respiratory pause • Flows>6 L/min do not significantly increase Fi. O 2>44% • Drying of mucosa and epistaxis
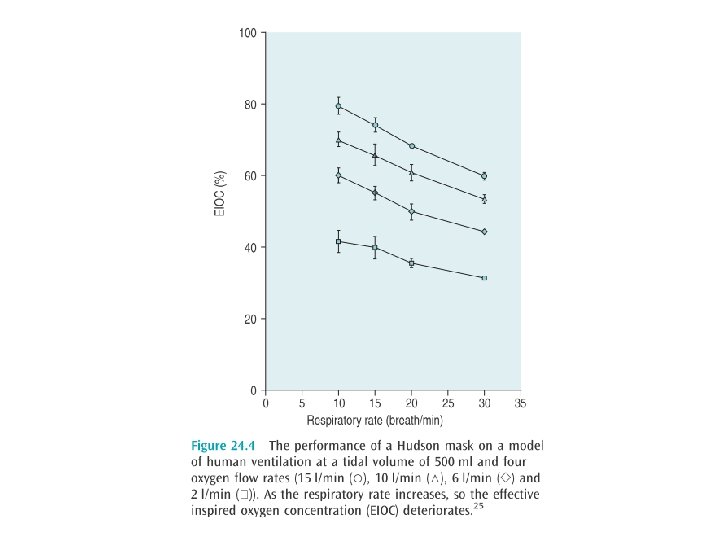
Oxygen masks • Reservoir volume= 150250 ml • Re-breathing occurs at flow rates <4 L/min • Approx Fi. O 2 0. 4 -0. 6 • Interfere with eating • Easy displacement • Increases aspiration by concealment of vomitus
Tracheostomy masks • Delivery depends on presence of ETT and inflation status of its cuff • If absent or cuff is deflated, air from NP will mix with that being delivered to the tracheosotmy, further diluting the Fi. O 2
Fixed performance systems • So called because O 2 delivery is independent of the patient factors outlined above • Venturi-type masks • Anesthestic breathing circuits
Venturi-type masks • High flow oxygen delivery device • Venturi modification of Bernoulli principle • Jet of 100% oxygen through a fixed orifice, past open side ports, entraining room air • Fi. O 2 depends on size of side ports and oxygen flow • Accurate Fi. O 2 up to 0. 5
Anaesthestic breathing circuits • Closed system with valves (e. g. Ambubag) • Reservoir volume = 600 -1000 ml • Re-breathing at low flows (most require flows >150 ml/kg) • Theoretically capable of delivery Fi. O 2 1. 0 but practically ~0. 6 -0. 8 due to sealing problem
Fi. O 2 max 0. 7 -0. 8 Fi. O 2 max 1. 0
Oxygen toxicity
Mechanism of oxygen toxicity • Oxygen is highly reactive free radical • Toxicity dose and time dependent • Considerable variability in susceptibility • CNS (>3 ATM) • Pulmonary (>2 ATM) • N. B. hyperventilation will not cause O 2 toxicity because lower limit for toxicity is 0. 3 ATM
CNS oxygen toxicity • Paul Bert effect • Classically in diving • Symptoms non-specific • • Tunnel vision Tinnitus Irritability Tonic-clonic seizure (exposure time before onset unpredictable) • Mx: stop O 2, benzodiazepines for convulsion
Pulmonary oxygen toxicity • • • Lorrain Smith effect Threshold: 0. 5 -0. 75 ATM Airway collapse due to lack of other non -respiratory gases • Irritation (cough, burning) on deep inspiration, SOB Progressive reduction in compliance, interstitial edema and fibrosis • • • Fi. O 2<0. 5 if possible Safe period of Fi. O 2>0. 5 vary from 1630 hrs • N. B. Safe upper limit of Fi. O 2 for chronic oxygen therapy in ambulatory setting is largely undefined
Hyperbaric oxygen therapy
Principles • Aims to increase amount of O 2 carried in plasma rather than hemoglobin
Indications • CO poisoning • Gas embolism • Decompression sickness • Selected refractory anaerobic infections (gas gangrene, necrotizing soft tissue infections, refractory osteomyelitis) • Cyanide poisoning • Radiation Necrosis • Crush injury and other acute traumatic ischemia • Blood loss anemia that refused transfusion • Dermatological: compromised grafts or flaps, burns, enhancement of healing in selected problem wounds Generally used as an adjunctive therapy
Carbon monoxide poisoning • CO has 210 x affinity to Hb than O 2 • Half-life 320 mins, reduced to 90 mins by 100% O 2 or 23 mins by 3 atm of hyperbaric therapy • Competitive dissociation of CO from Hb and provision of dissolved O 2 to tissues • Age>35, exposure>24 hrs, LOC and COHb >25%
Complications of hyperbaric therapy • Barotrauma (middle ear and sinuses), gas embolism on decompression • Oxygen toxicity • Visual problem (myopia, cataract)
For as a candle burns out much faster in dephlogisticated than in common air, so we might, as may be said, live out too fast… in this pure kind of air Joseph Priestley (1733 -1804), English theologian and philosopher The End Thank you