
FRET Molecular Storytelling April 22 2005 Rose Chase









- Slides: 52
FRET – Molecular Storytelling April 22, 2005 Rose Chase
The beginning… l Theodor Förster l 1940 s proposed mathematical law for dependence of fluorescence decay of donor (D) on the concentration of acceptor (A), assuming a dipole-dipole interaction in solution (J. Phys. Chem. 1965, 69, 1061 -1062) Exponential decay for one D molecule
But… One D, not applicable, therefore average over all distances l His equations, although eventually proven correct, were founded on incorrect/incomplete assumptions l l Different distributions of A l Mathematical shortcuts l But THREE different scientists came to same conclusion nonetheless
Missing point l ASSUMING l Once an A is excited, no further quenching of D l Therefore, A molecules decay exponentially l “It thus seems, that the proper result obtained by Förster nevertheless does not justify his statistical reasoning. ” -Mira Leibowitz
Impact of FRET l l After the initial fuss about the validity of Förster’s derivations, little else. Resurgence in past several years, especially in biology/biochemistry/biophysics thanks to: l l FRET capable spectral GFP mutants Engineering of peptides w/novel fluorescent reagents Ability to couple to different imaging techniques AND the need to “see” finer details
Power of FRET l Probe macromolecular interactions l Interaction assumed upon fluorescence decay Study kinetics of association/dissociation between macromolecules l Estimation of distances l In vitro AND in vivo l Single molecule studies l
What is FRET? l Förster Resonance Energy Transfer l Fluorescence if both D and A are fluorescent Radiation-less energy transition b/t a D and A w/ finite probability based on proximity l Energy is transferred through the resonant coupling of the dipole moments of D and A l
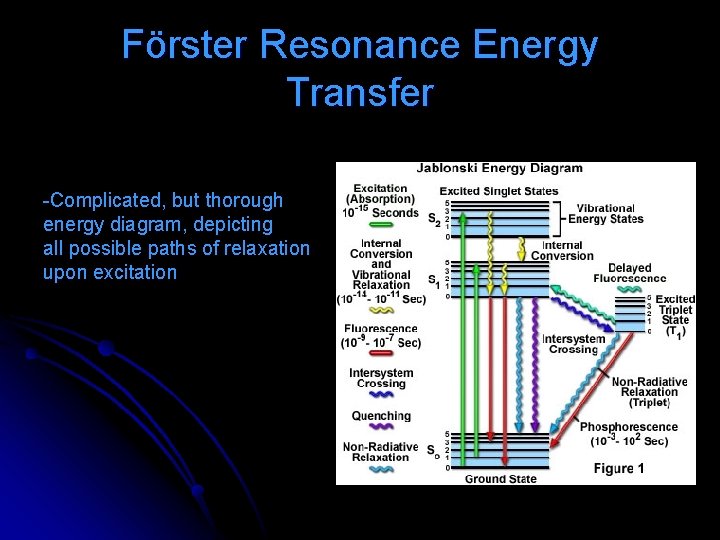
Förster Resonance Energy Transfer -Complicated, but thorough energy diagram, depicting all possible paths of relaxation upon excitation
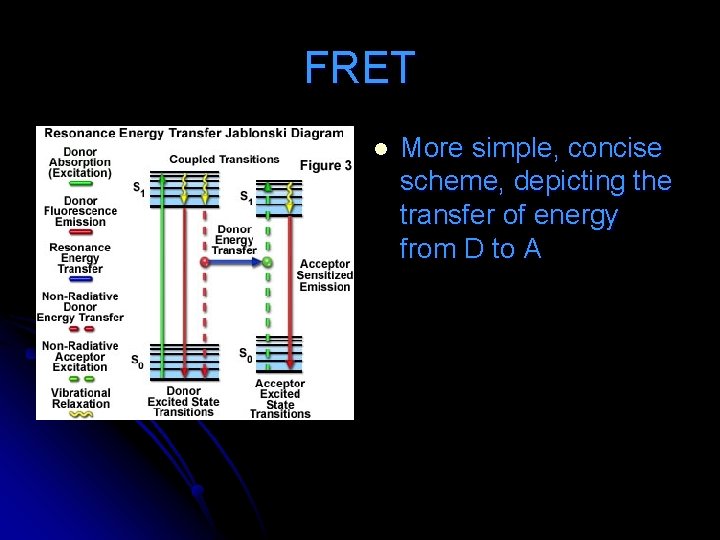
FRET l More simple, concise scheme, depicting the transfer of energy from D to A
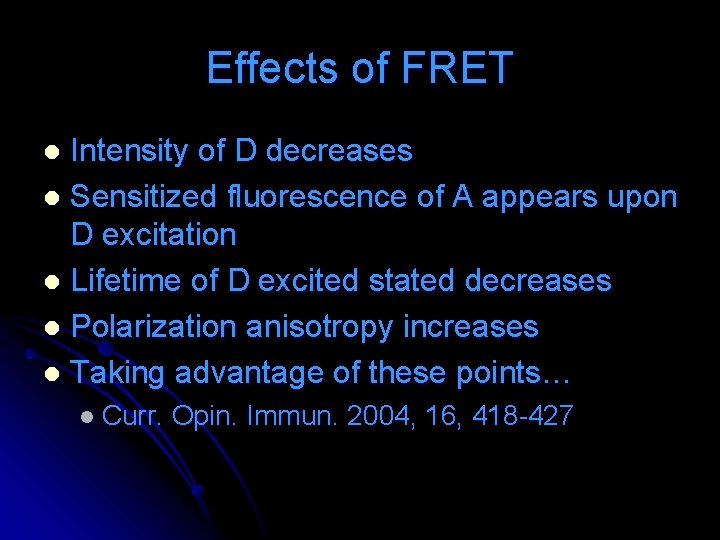
Effects of FRET Intensity of D decreases l Sensitized fluorescence of A appears upon D excitation l Lifetime of D excited stated decreases l Polarization anisotropy increases l Taking advantage of these points… l l Curr. Opin. Immun. 2004, 16, 418 -427
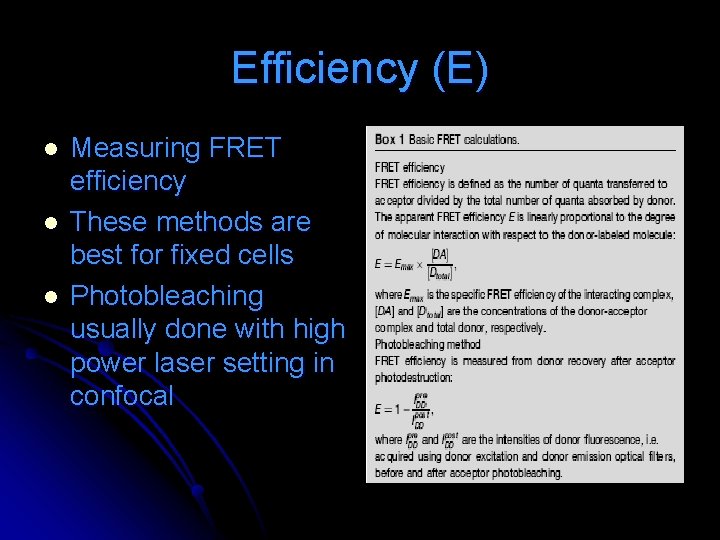
Efficiency (E) l l l Measuring FRET efficiency These methods are best for fixed cells Photobleaching usually done with high power laser setting in confocal
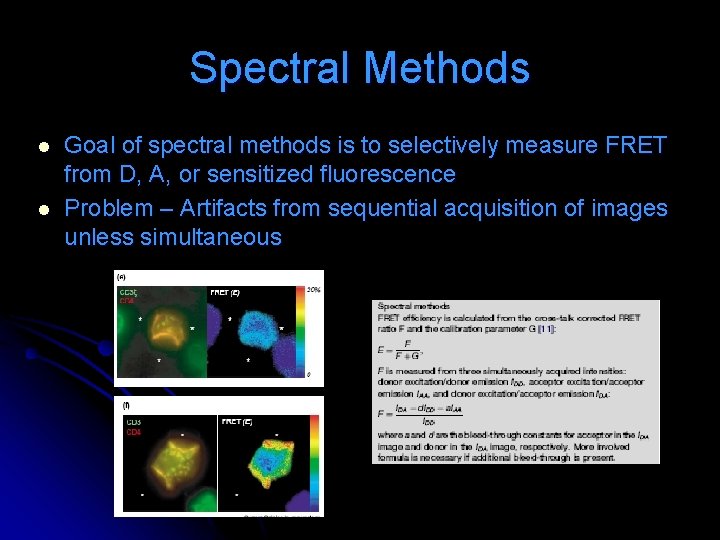
Spectral Methods l l Goal of spectral methods is to selectively measure FRET from D, A, or sensitized fluorescence Problem – Artifacts from sequential acquisition of images unless simultaneous
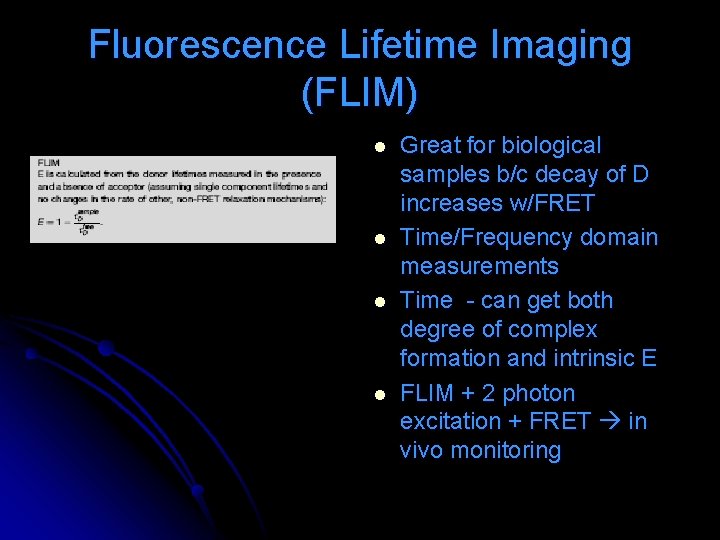
Fluorescence Lifetime Imaging (FLIM) l l Great for biological samples b/c decay of D increases w/FRET Time/Frequency domain measurements Time - can get both degree of complex formation and intrinsic E FLIM + 2 photon excitation + FRET in vivo monitoring
Polarization Anisotropy and FRET l l l Polarization anisotropy – ability of fluorescence to retain the direction of polarization of excitation source Illuminate sample w/ polarized excitation and read fluorescence parallel and perpendicular to polarization axis Ex. GFP – slow moving w/ short lifetime, therefore little loss parallel; but cluster and get energy migration FRET perpendicular
Limits ASSUMPTION of interaction based on fluorescence, possible intermediate l Changes in E may be attributed to conformational changes or restrictions l Crowding/aggregation l COST l On to applications… l
Ratiometric indicator for Cl. Neuron 2000, 27, 447 -459 l Cll l Regulation of cell volume, intracell. p. H, fluid secretion, stabilization of resting potential l Developmental intracell. [Cl-] determines whether GAGAergic synapes excite/inhibit postsynaptic target l Change in gradient has other periphery effects
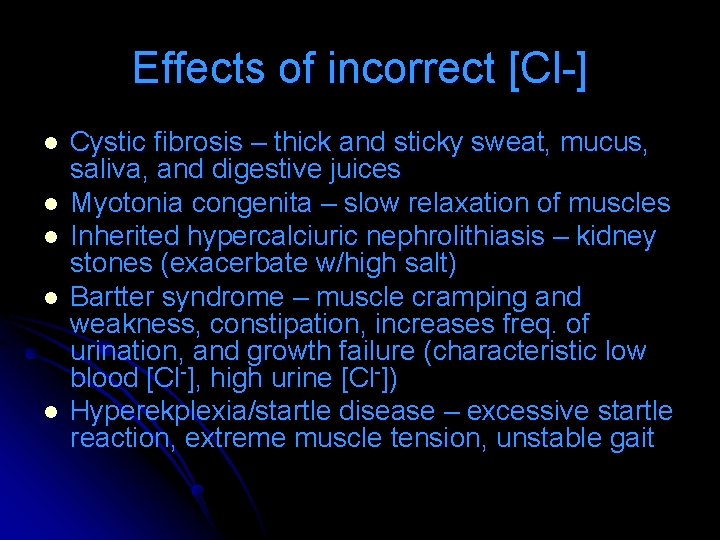
Effects of incorrect [Cl-] l l l Cystic fibrosis – thick and sticky sweat, mucus, saliva, and digestive juices Myotonia congenita – slow relaxation of muscles Inherited hypercalciuric nephrolithiasis – kidney stones (exacerbate w/high salt) Bartter syndrome – muscle cramping and weakness, constipation, increases freq. of urination, and growth failure (characteristic low blood [Cl-], high urine [Cl-]) Hyperekplexia/startle disease – excessive startle reaction, extreme muscle tension, unstable gait
Measuring [Cl-] While using FRET realized Cl- senisitivity! l Fusion protein CPF/YFP fluorophores can be used as a ratiometric, targetable, and genetically encoded indicator l On to the good stuff… l
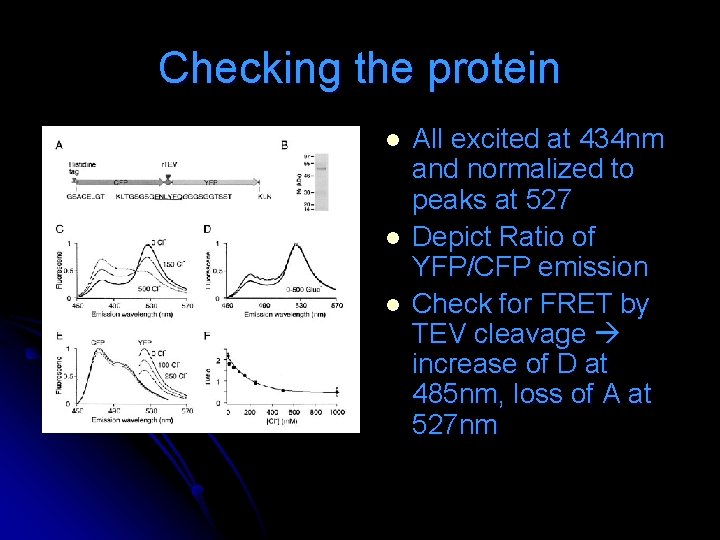
Checking the protein l l l All excited at 434 nm and normalized to peaks at 527 Depict Ratio of YFP/CFP emission Check for FRET by TEV cleavage increase of D at 485 nm, loss of A at 527 nm
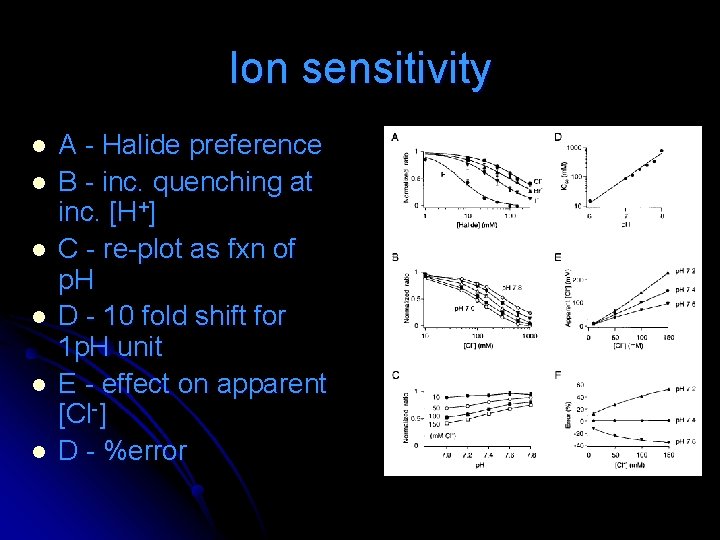
Ion sensitivity l l l A - Halide preference B - inc. quenching at inc. [H+] C - re-plot as fxn of p. H D - 10 fold shift for 1 p. H unit E - effect on apparent [Cl-] D - %error
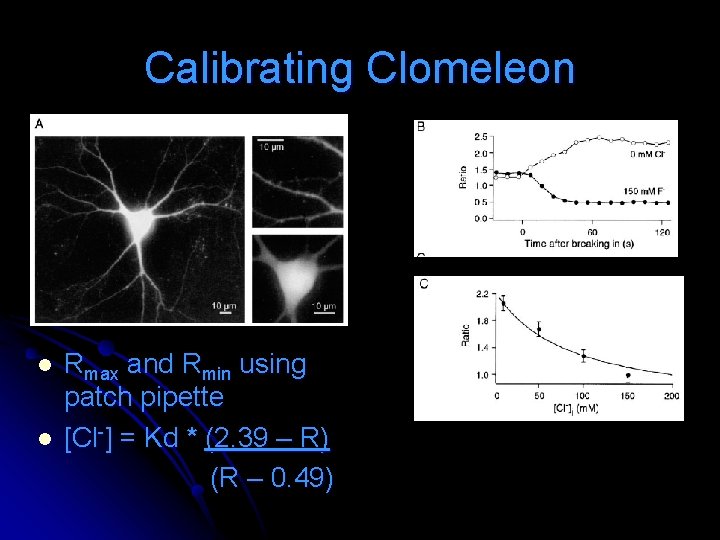
Calibrating Clomeleon l l Rmax and Rmin using patch pipette [Cl-] = Kd * (2. 39 – R) (R – 0. 49)
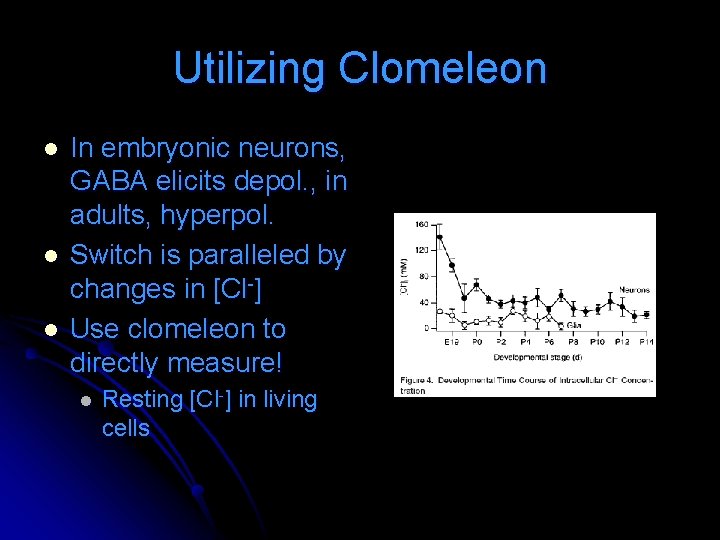
Utilizing Clomeleon l l l In embryonic neurons, GABA elicits depol. , in adults, hyperpol. Switch is paralleled by changes in [Cl-] Use clomeleon to directly measure! l Resting [Cl-] in living cells
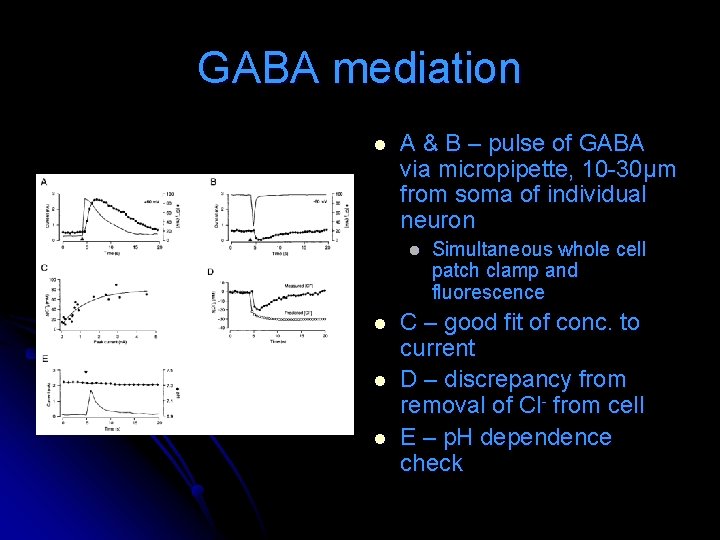
GABA mediation l A & B – pulse of GABA via micropipette, 10 -30μm from soma of individual neuron l l Simultaneous whole cell patch clamp and fluorescence C – good fit of conc. to current D – discrepancy from removal of Cl- from cell E – p. H dependence check
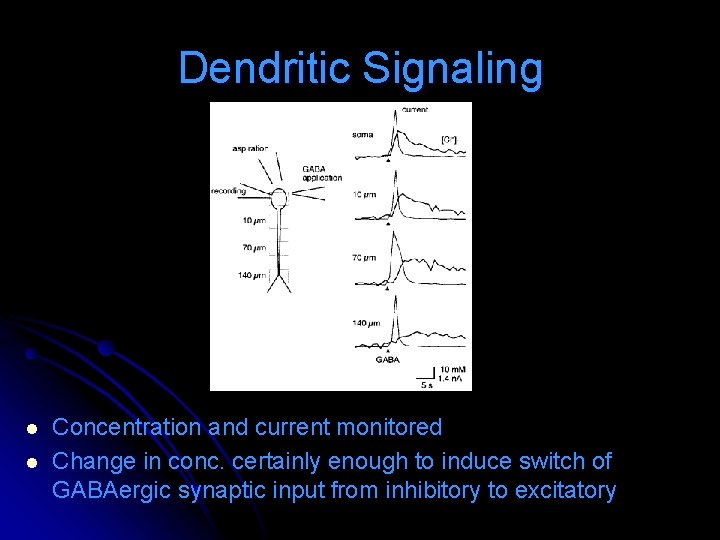
Dendritic Signaling l l Concentration and current monitored Change in conc. certainly enough to induce switch of GABAergic synaptic input from inhibitory to excitatory
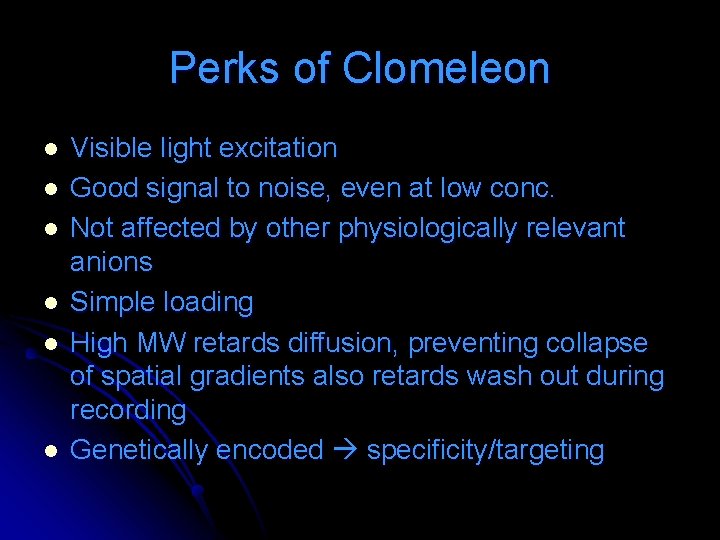
Perks of Clomeleon l l l Visible light excitation Good signal to noise, even at low conc. Not affected by other physiologically relevant anions Simple loading High MW retards diffusion, preventing collapse of spatial gradients also retards wash out during recording Genetically encoded specificity/targeting
Probing interactions with FRET Biochemistry 2004, 43, 8754 -8765 l Phospholamban (PLB) inhibits Ca-ATPase of the sarcoplasmic reticulum (SERCA) at submicromolar Ca+2 l Inhibition relieved by either elevation of Ca+2 to micromolar, or phosphorylation of PLB (adrenergic response) l
Importance of PLB-SERCA Linked to development of dilated cardiomyopathy and progression to heart failure in young adults l PLB possible drug target l Therefore, elucidation of mechanism by which PLB regulates SERCA important l
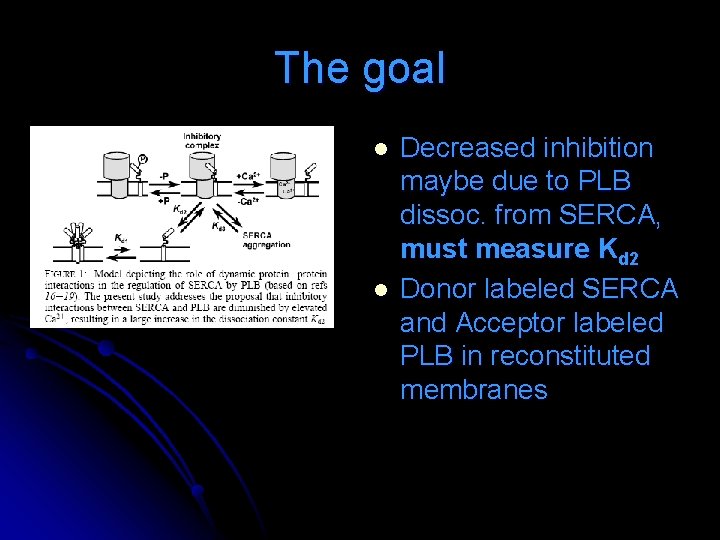
The goal l l Decreased inhibition maybe due to PLB dissoc. from SERCA, must measure Kd 2 Donor labeled SERCA and Acceptor labeled PLB in reconstituted membranes
A quick look at methods l PLB l DABCYL-SE, chosen b/c lacks fluorescence emission and therefore does not interfere with donor emission signal l SERCA l Labeled with IAEDANS Excitation at 351. 1 nm l Temp controlled by water bath at 25°C l
A tiny bit of math… l l A lot like earlier equations… FRET Efficiency and D-A distance
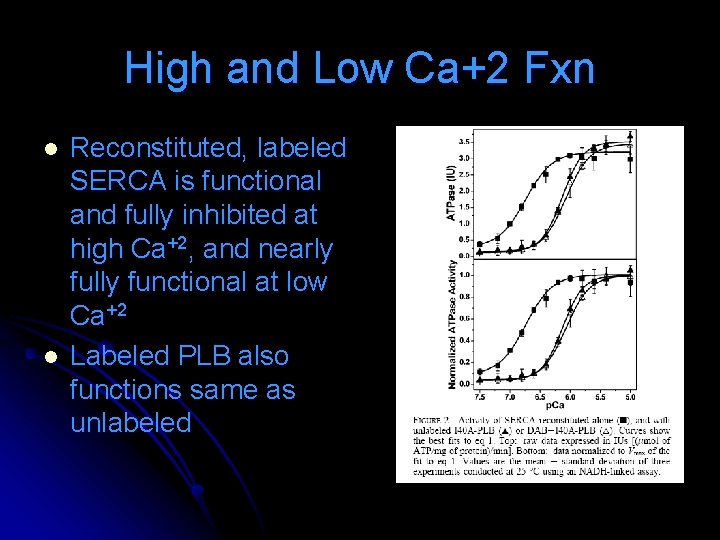
High and Low Ca+2 Fxn l l Reconstituted, labeled SERCA is functional and fully inhibited at high Ca+2, and nearly fully functional at low Ca+2 Labeled PLB also functions same as unlabeled
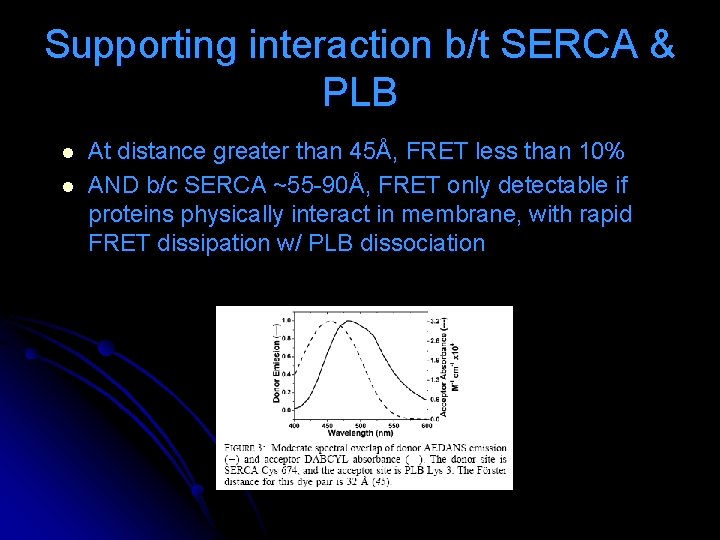
Supporting interaction b/t SERCA & PLB l l At distance greater than 45Å, FRET less than 10% AND b/c SERCA ~55 -90Å, FRET only detectable if proteins physically interact in membrane, with rapid FRET dissipation w/ PLB dissociation
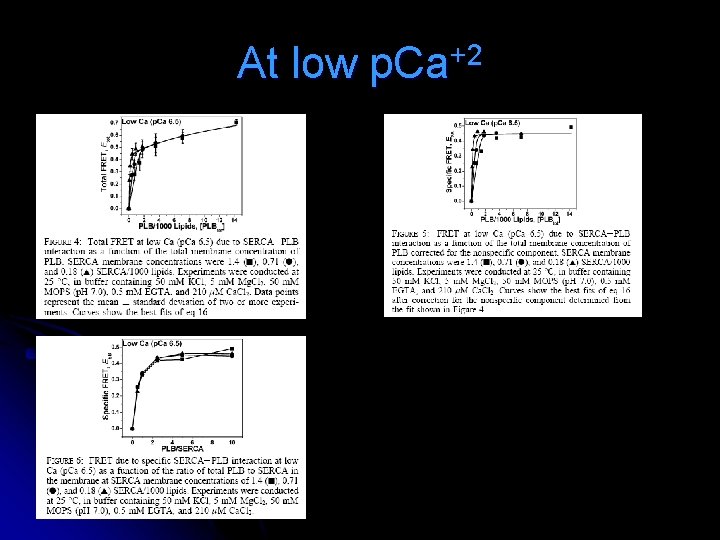
At low p. Ca+2
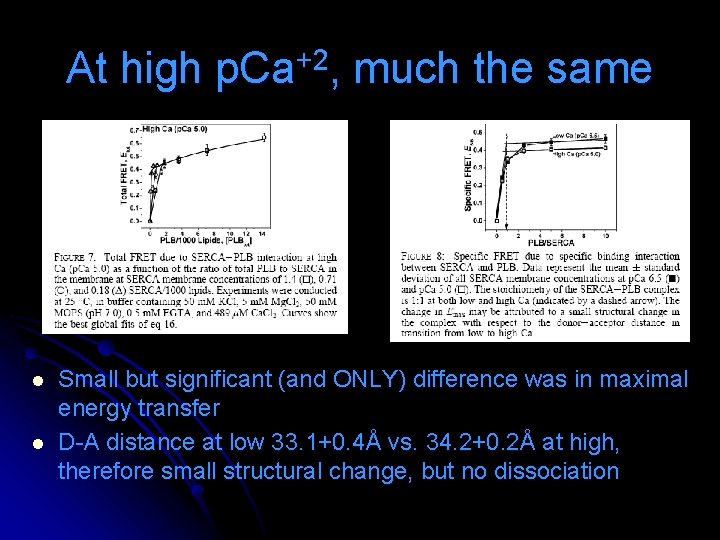
At high p. Ca+2, much the same l l Small but significant (and ONLY) difference was in maximal energy transfer D-A distance at low 33. 1+0. 4Å vs. 34. 2+0. 2Å at high, therefore small structural change, but no dissociation
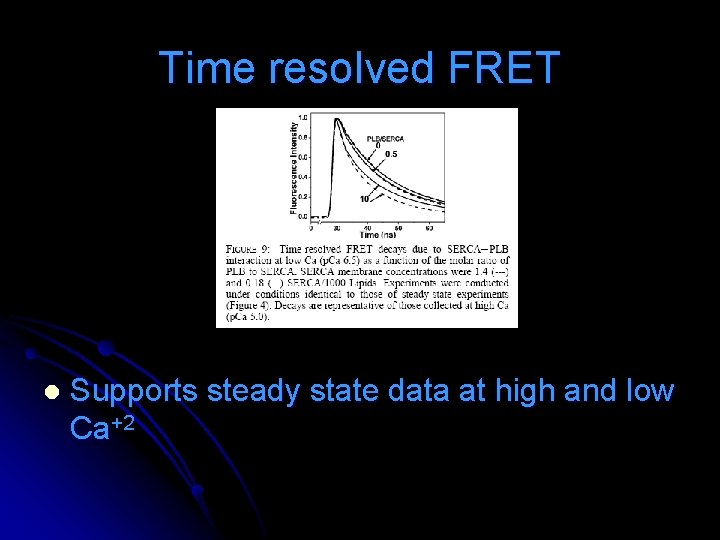
Time resolved FRET l Supports steady state data at high and low Ca+2
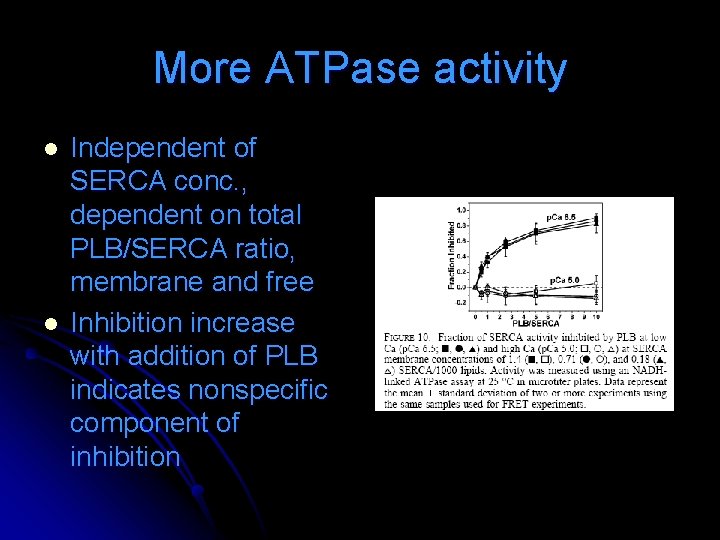
More ATPase activity l l Independent of SERCA conc. , dependent on total PLB/SERCA ratio, membrane and free Inhibition increase with addition of PLB indicates nonspecific component of inhibition
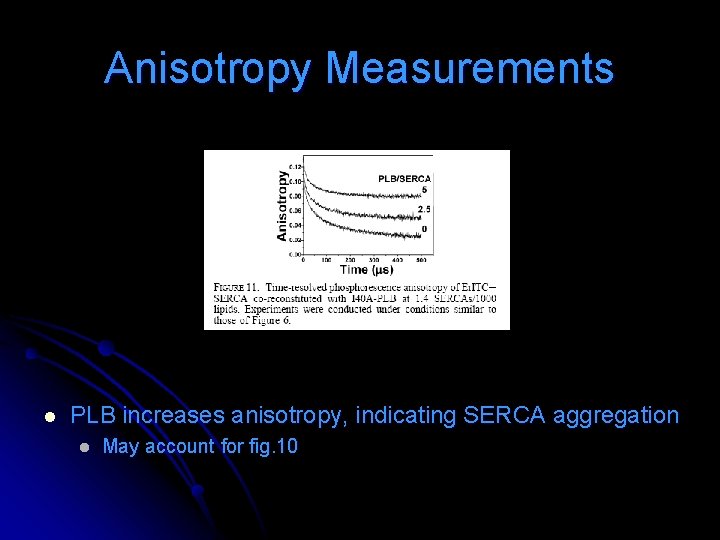
Anisotropy Measurements l PLB increases anisotropy, indicating SERCA aggregation l May account for fig. 10
Therefore… l The conclude the hypothesis must be revised.
Conclusions Affinity of PLB for SERCA is so high it is essentially a SERCA subunit under physiological conditions l Relief of inhibition at micromolar Ca+2 is due to structural rearrangement within the SERCA-PLB complex, rather than dissociation l
Association of TM helices in lipid bilayers l l Langmuir 2004, 20, 9053 -9060 Membrane proteins l l l l Cell adhesion Recognition Motility Energy production Transport of nutrients and cholesterol Biochemical signal transduction Engineering of surface immobilized bilayers containing active, integral membrane proteins: l Drug screening devices, mimetics of cell and tissue surfaces, matrices for stress free cell immobilization
Focus on… l Fibroblast growth factor receptor 3 (FGFR 3) l Causes various cancers and developmental abnormalities by affecting lateral dimerization in the membrane
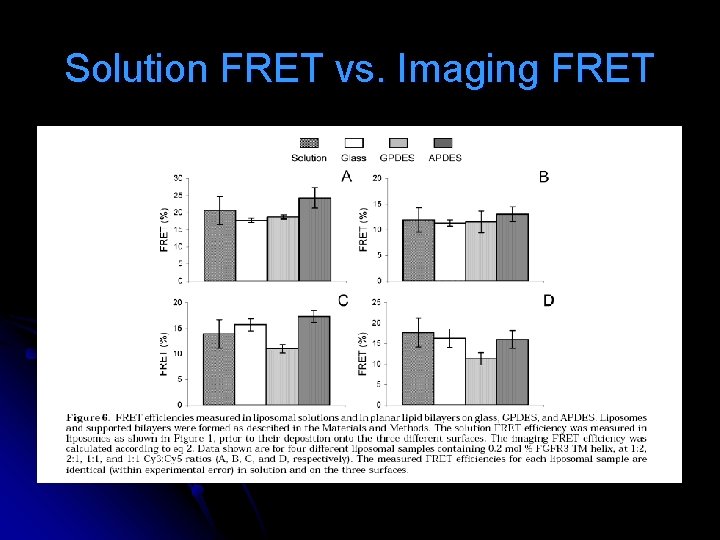
Ambitions l Characterize the architecture of surface supported protein/lipid bilayers l l l Fluorescence recovery after photobleaching (FRAP) FRET – show that FRET signal is same in suspended liposomes and in surface supported bilayers Further develop an imaging FRET methodology that may provide a less expensive and less tedious alternative to solution FRET
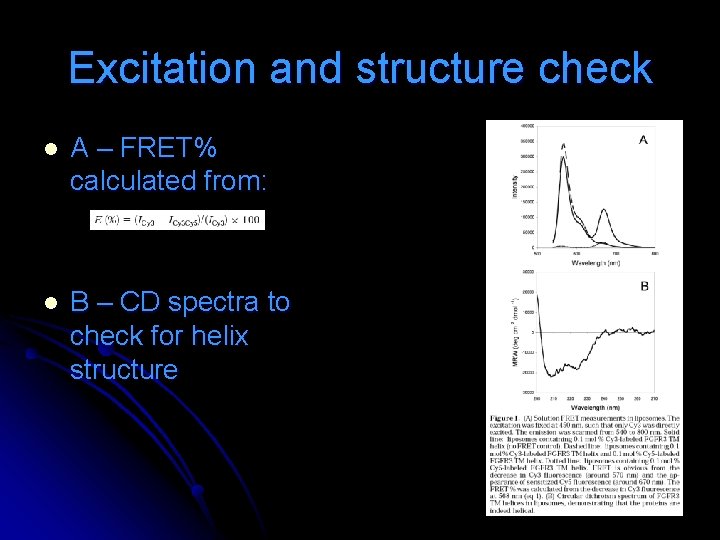
Excitation and structure check l A – FRET% calculated from: l B – CD spectra to check for helix structure
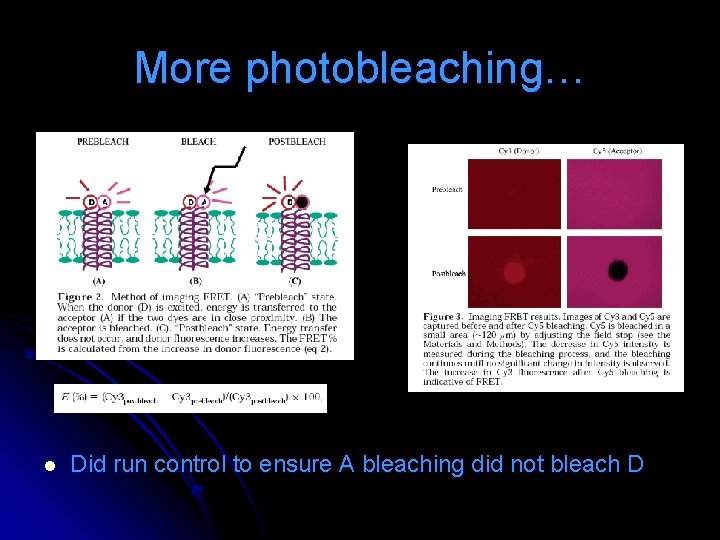
Short on Photobleaching Images taken of D and A prior to bleaching l A is bleached in small area, while measuring the decrease in intensity. Continued until no significant change in intensity is noted. l D image captured after A bleaching. With A bleached, no ET from D to A. FRET is obvious from the appearance of a bright spot in the D spot, where A was bleached. l
More photobleaching… l Did run control to ensure A bleaching did not bleach D
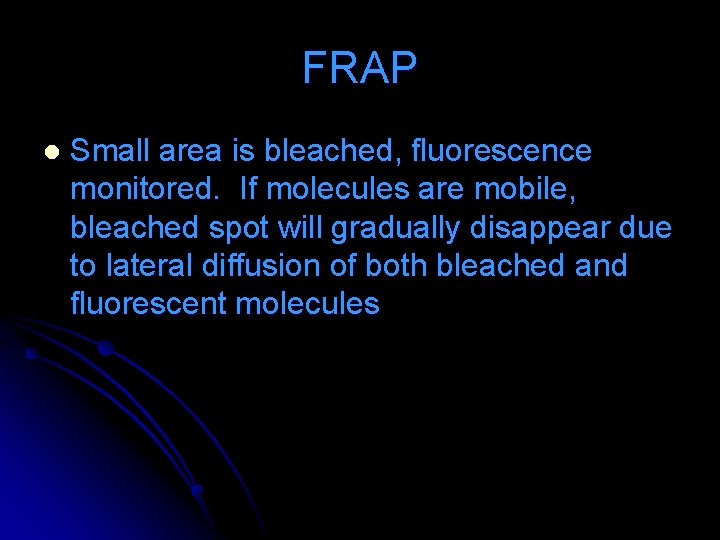
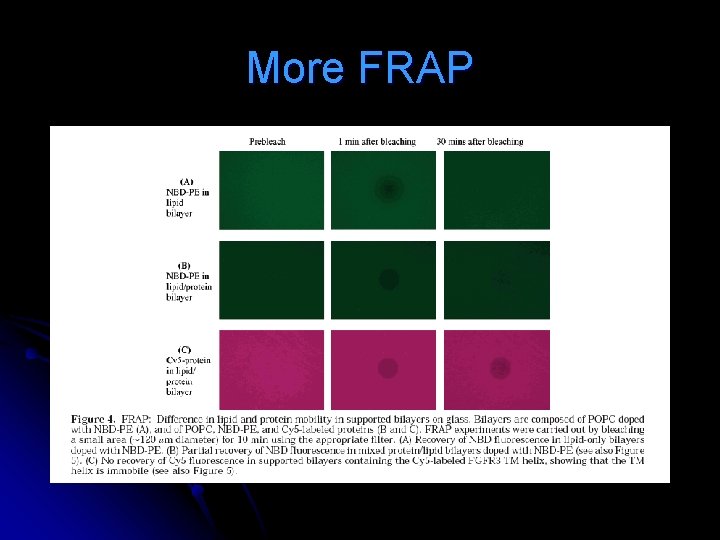
FRAP l Small area is bleached, fluorescence monitored. If molecules are mobile, bleached spot will gradually disappear due to lateral diffusion of both bleached and fluorescent molecules
More FRAP
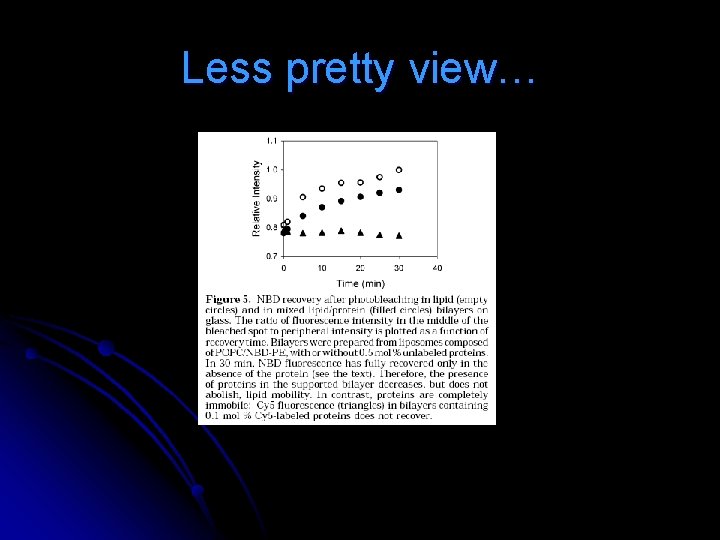
Less pretty view…
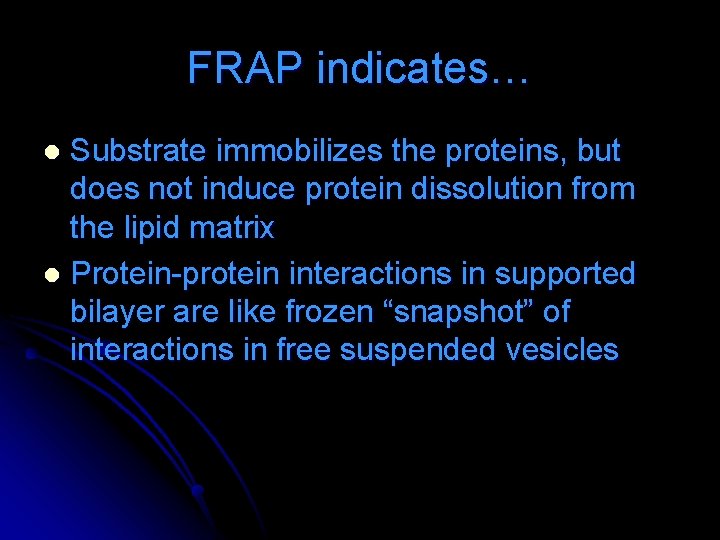
FRAP indicates… Substrate immobilizes the proteins, but does not induce protein dissolution from the lipid matrix l Protein-protein interactions in supported bilayer are like frozen “snapshot” of interactions in free suspended vesicles l
Solution FRET vs. Imaging FRET
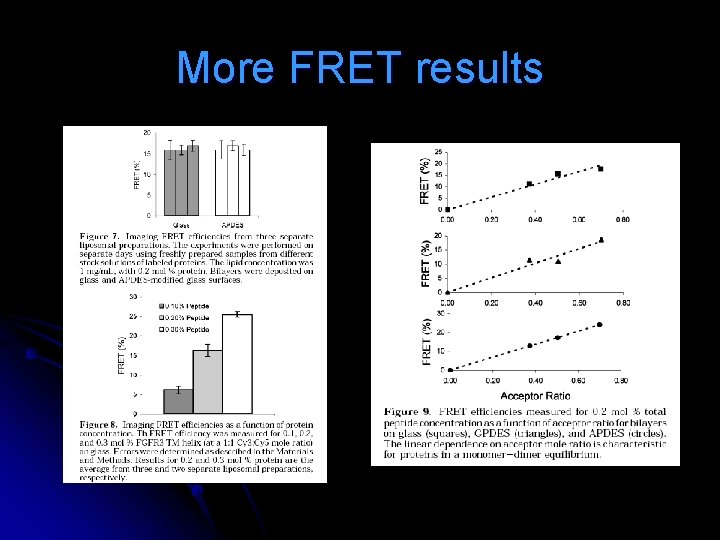
More FRET results
Conclusions Imaging FRET can be used as a means to quantify TM helix dimerization in surface supported bilayers l Better, due to use of a single sample repeatedly l Less expensive than solution (equipment and sample volume) l